You are not logged in.
This means you
CAN ONLY VIEW reports that were published prior to Monday, April 14, 2025.
You
MUST UPGRADE YOUR MEMBERSHIP if you want to see any current reports.
AFTER MARKET UPDATE - TUESDAY, DECEMBER 11TH, 2012
Previous After Market Report Next After Market Report >>>
|
|
|
|
DOW |
+78.56 |
13,248.44 |
+0.60% |
|
Volume |
693,296,570 |
+17% |
|
Volume |
1,805,167,710 |
+22% |
|
NASDAQ |
+35.34 |
3,022.30 |
+1.18% |
|
Advancers |
2,052 |
65% |
|
Advancers |
1,767 |
68% |
|
S&P 500 |
+9.29 |
1,427.84 |
+0.65% |
|
Decliners |
975 |
31% |
|
Decliners |
715 |
28% |
|
Russell 2000 |
+8.73 |
834.99 |
+1.06% |
|
52 Wk Highs |
125 |
|
|
52 Wk Highs |
90 |
|
|
S&P 600 |
+4.27 |
468.14 |
+0.92% |
|
52 Wk Lows |
18 |
|
|
52 Wk Lows |
30 |
|
|
 |
Leadership Expanded While Major Averages Rose on Higher Volume Totals
Kenneth J. Gruneisen - Passed the CAN SLIM® Master's Exam
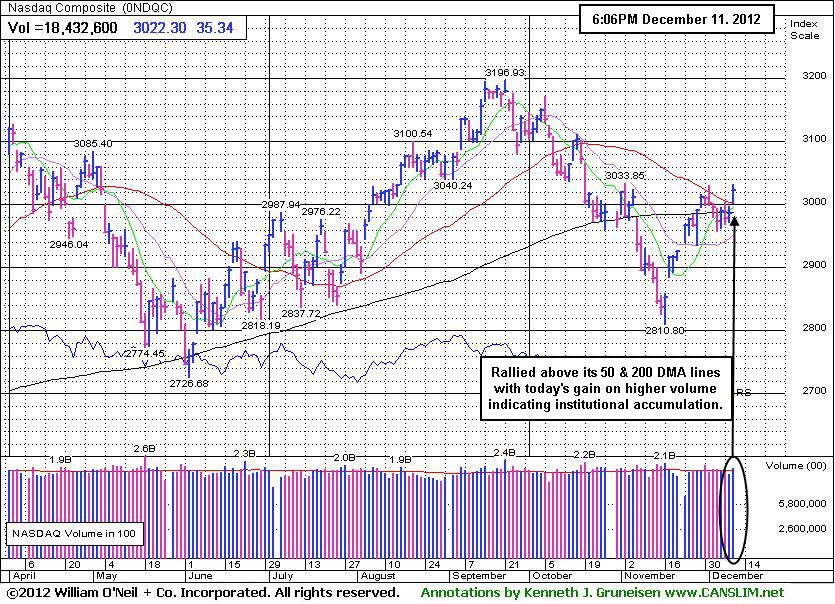
Markets ended the session higher, albeit off of Tuesday's best levels.The volume totals were reported higher than the prior session on the Nasdaq exchange and on the NYSE indicating an encouraging increase in buying conviction from the institutional crowd. Advancing shares led decliners by a 2-1 margin on the NYSE and by a 9-7 margin on the Nasdaq exchange. The total number of stocks hitting new 52-week highs swelled and easily outnumbered new 52-week lows on the NYSE and also on the Nasdaq exchange. There were 57 high-ranked companies from the CANSLIM.net Leaders List making new 52-week highs and appearing on the CANSLIM.net BreakOuts Page, up nicely from the prior session total of 32 stocks. Any sustainable rally requires a healthy crop of companies hitting new 52-week highs, so it was encouraging to see leadership expanding again. There were gains for 9 of the 12 high-ranked companies currently included on the Featured Stocks Page.
Stocks pared their early gains on renewed concerns over the fiscal cliff. Senate Majority Leader Harry Reid halted the rally by saying that democrats would not offer spending cuts and that a deal before Christmas was unlikely.
All 10 sectors on the S&P 500 finished higher. On the earnings front, Dollar General Corp (DG -7.79%) sank after falling short of analysts' expectations in the quarter. In other news, Delta Airlines (DAL +5.13%) rose on news that the company was buying a stake in Virgin Atlantic Airways to expand their operations in Europe.
Turning to fixed income, Treasuries were lower along the curve with the 10-year note falling 9/32 to yield 1.65%.
The Dow Jones Industrial Average, S&P 500 Index, and the Nasdaq Composite Index have collectively rallied above their respective 50-day moving average (DMA) lines and the market direction (M criteria) remains in a "confirmed uptrend". New buying efforts may be justified only in worthy high-ranked leaders. See the noteworthy companies included on the Featured Stocks Page.
Watch for an announcement via email concerning the next WEBCAST. The webcast will also be available via an updated link highlighted at the top of the Premium Member Homepage.
PICTURED: The Nasdaq Composite Index has rallied above its 50 and 200 DMA lines. This is an encouraging improvement in its technical stance and a reassuring sign that the tech sector is providing some backbone for the market's current rally.
|
 Kenneth J. Gruneisen started out as a licensed stockbroker in August 1987, a couple of months prior to the historic stock market crash that took the Dow Jones Industrial Average down -22.6% in a single day. He has published daily fact-based fundamental and technical analysis on high-ranked stocks online for two decades. Through FACTBASEDINVESTING.COM, Kenneth provides educational articles, news, market commentary, and other information regarding proven investment systems that work in good times and bad.
Comments contained in the body of this report are technical opinions only and are not necessarily those of Gruneisen Growth Corp. The material herein has been obtained from sources believed to be reliable and accurate, however, its accuracy and completeness cannot be guaranteed. Our firm, employees, and customers may effect transactions, including transactions contrary to any recommendation herein, or have positions in the securities mentioned herein or options with respect thereto. Any recommendation contained in this report may not be suitable for all investors and it is not to be deemed an offer or solicitation on our part with respect to the purchase or sale of any securities. |
|
 |
Tech and Financial Groups Led Broad Market Rally
Kenneth J. Gruneisen - Passed the CAN SLIM® Master's Exam
The Semiconductor Index ($SOX +1.88%) was a standout gainer and led the tech sector higher while the Internet Index ($IIX +1.39%), Biotechnology Index ($BTK +1.25% ), and the Networking Index ($NWX +0.84%) posted unanimous gains. Gains in the influential financial groups also helped underpin the rally as the Bank Index ($BKX +0.43%) and Broker/Dealer Index ($XBD +0.89%) posted gains.The Retail Index ($RLX -0.15%) lagged with a small loss. Defensive groups were mixed as the Gold & Silver Index ($XAU -0.29%) edged lower and the Healthcare Index ($HMO +0.23%) edged higher. Energy-related shares had a slightly positive bias as the Oil Services Index ($OSX +0.10%) and the Integrated Oil Index ($XOI +0.39%) posted small gains while rounding out the mostly positive session.
Charts courtesy www.stockcharts.com
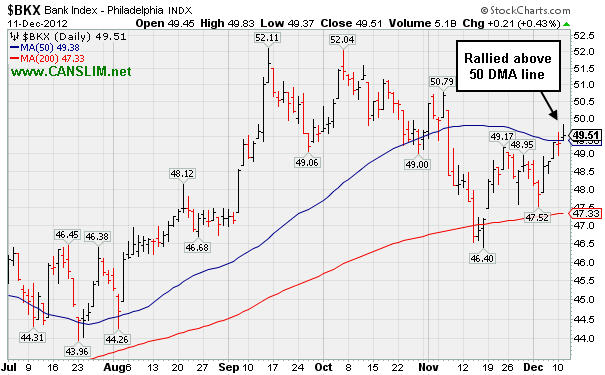
PICTURED: The Bank Index ($BKX +0.43%) rallied above its 50-day moving average (DMA) line improving its technical stance. That is an encouraging sign for the broader market since financials are a reliable leading indicator all regular readers should recognize.
| Oil Services |
$OSX |
221.83 |
+0.22 |
+0.10% |
+2.57% |
| Healthcare |
$HMO |
2,554.65 |
+5.76 |
+0.23% |
+11.97% |
| Integrated Oil |
$XOI |
1,233.71 |
+4.76 |
+0.39% |
+0.38% |
| Semiconductor |
$SOX |
389.00 |
+7.17 |
+1.88% |
+6.74% |
| Networking |
$NWX |
217.31 |
+1.82 |
+0.84% |
+1.00% |
| Internet |
$IIX |
325.56 |
+4.46 |
+1.39% |
+15.55% |
| Broker/Dealer |
$XBD |
87.60 |
+0.77 |
+0.89% |
+5.20% |
| Retail |
$RLX |
655.79 |
-1.00 |
-0.15% |
+25.34% |
| Gold & Silver |
$XAU |
163.68 |
-0.47 |
-0.29% |
-9.39% |
| Bank |
$BKX |
49.51 |
+0.21 |
+0.43% |
+25.72% |
| Biotech |
$BTK |
1,565.64 |
+19.29 |
+1.25% |
+43.45% |
|
|
|
 |
Featured in Mid-day Report and Finished With Strong Gain Above Pivot Point
Kenneth J. Gruneisen - Passed the CAN SLIM® Master's Exam
Often, when a leading stock is setting up to breakout of a solid base it is highlighted in CANSLIM.net's Mid-Day Breakouts Report. Sometimes stocks are highlighted shortly after a technical breakout, yet while the potential buy candidate may still be considered action-worthy. The most relevant factors are noted in the report which alerts prudent CANSLIM oriented investors to place the issue in their watch list. After doing any necessary backup research, the investor is prepared to act after the stock triggers a technical buy signal (breaks above its pivot point on more than +50% average turnover) but before it gets too extended from a sound base. In the event the stock fails to trigger a technical buy signal and its price declines then it will simply be removed from the watch list. Disciplined investors know to buy as near as possible to the pivot point and avoid chasing stocks after they have rallied more than +5% above their pivot point. It is crucial to always limit losses whenever any stock heads the wrong direction, and disciplined investors sell if a struggling stock ever falls more than -7% from their purchase price.
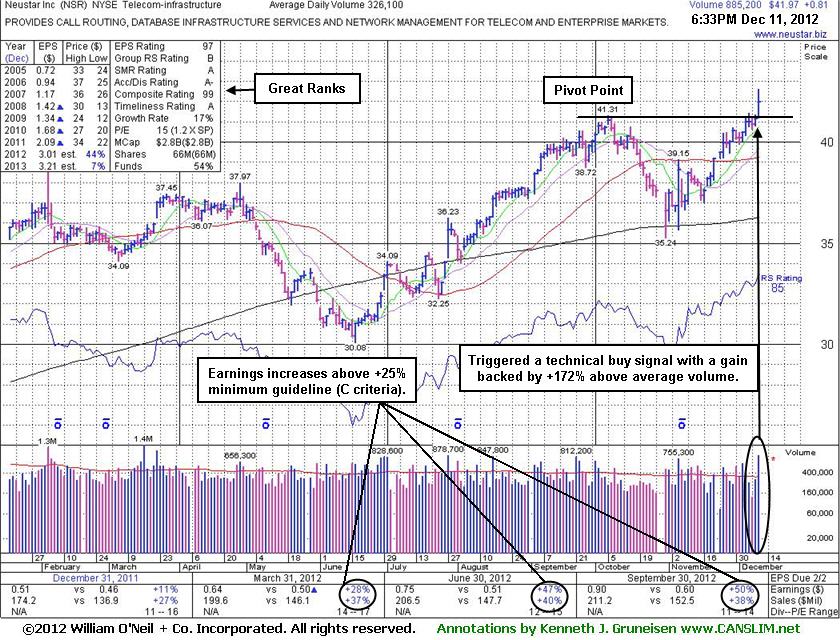
Neustar Inc (NSR +$0.69 or +1.68% to $41.85) was highlighted in yellow with pivot point cited based on its 10/05/12 high plus 10 cents in the earlier mid-day report (read here) and its strong finish on heavy volume +172% above average clinched a technical buy signal. It hit a new 52-week high today, rising from a 10-week base during which it found support at its 200-day moving average (DMA) line. Quarterly comparisons through Sep '12 showed 3 consecutive increases of more than the +25% minimum earnings guideline (C criteria).
The number of top-rated funds owning its shares rose from 404 in Dec '11 to 422 in Sep '12, a slightly reassuring trend concerning the I criteria. Its Return On Equity is reported at 29%, well above the 17% minimum guideline. Leadership from a couple of other high-ranked leaders in the Telecom - Infrastructure group is a reassuring sign (concerning the L criteria) although its Group Relative Strength Rating of 61 is mediocre. Its small supply of 65 million shares (S criteria) outstanding can lead to greater price volatility if the institutional crowd rushes to accumulate shares, or if they decide to leave.
Disciplined investors know to avoid chasing extended stocks more than +5% above their pivot point, and they always sell if ever any stock falls more than -7% from their purchase price to properly manage risk under the fact-based system's guidelines.
|
|
|
Color Codes Explained :
Y - Better candidates highlighted by our
staff of experts.
G - Previously featured
in past reports as yellow but may no longer be buyable under the
guidelines.
***Last / Change / Volume data in this table is the closing quote data***
Symbol/Exchange
Company Name
Industry Group |
PRICE |
CHANGE
(%Change) |
Day High |
Volume
(% DAV)
(% 50 day avg vol) |
52 Wk Hi
% From Hi |
Featured
Date |
Price
Featured |
Pivot Featured |
|
Max Buy |
CELG
-
NASDAQ
Celgene Corp
DRUGS - Drug Manufacturers - Major
|
$82.08
|
+1.58
1.96% |
$82.78
|
6,100,981
228.16% of 50 DAV
50 DAV is 2,674,000
|
$81.24
1.03%
|
12/11/2012
|
$82.24
|
PP = $81.34
|
|
MB = $85.41
|
 Most Recent Note - 12/11/2012 6:30:18 PM
Y - Finished above its pivot point with a volume-driven gain for a new 52-week high today triggering a technical buy signal. It was highlighted in yellow with pivot point cited based on its 10/05/12 high plus 10 cents in today's mid-day report (with the annotated graph included below). Maintained a strong earnings history (C and A criteria) and rebounded impressively from a deep consolidation since dropped from the Featured Stocks list on 5/04/12.

>>> The latest Featured Stock Update with an annotated graph appeared on 3/26/2012. Click here.
View all notes |
Alert me of new notes |
CANSLIM.net Company Profile |
SEC |
Zacks Reports |
StockTalk |
News |
Chart |
Request a new note
C
A N
S L
I M


|
CFNL
-
NASDAQ
Cardinal Financial Corp
BANKING - Regional - Southeast Banks
|
$16.00
|
+0.23
1.46% |
$16.19
|
335,222
172.35% of 50 DAV
50 DAV is 194,500
|
$16.21
-1.30%
|
12/3/2012
|
$15.20
|
PP = $16.31
|
|
MB = $17.13
|
Most Recent Note - 12/11/2012 6:33:40 PM
Y - Traded above average volume today, but the gain was not big enough to help it rally above its pivot point to trigger a proper new (or add-on) technical buy signal.
>>> The latest Featured Stock Update with an annotated graph appeared on 12/10/2012. Click here.
View all notes |
Alert me of new notes |
CANSLIM.net Company Profile |
SEC |
Zacks Reports |
StockTalk |
News |
Chart |
Request a new note
C
A N
S L
I M
|
CMCSA
-
NASDAQ
Comcast Corp Cl A
MEDIA - CATV Systems
|
$37.40
|
+0.15
0.40% |
$37.55
|
11,711,188
99.56% of 50 DAV
50 DAV is 11,763,500
|
$37.96
-1.48%
|
12/3/2012
|
$37.08
|
PP = $38.06
|
|
MB = $39.96
|
Most Recent Note - 12/7/2012 5:37:35 PM
Y - Perched -2.5% off its 52-week high. Subsequent volume-driven gains above the pivot point may trigger a new (or add-on) technical buy signal. See the latest FSU analysis for more details and a new annotated graph.
>>> The latest Featured Stock Update with an annotated graph appeared on 12/7/2012. Click here.
View all notes |
Alert me of new notes |
CANSLIM.net Company Profile |
SEC |
Zacks Reports |
StockTalk |
News |
Chart |
Request a new note
C
A N
S L
I M
|
LKQ
-
NASDAQ
L K Q Corp
WHOLESALE - Auto Parts
|
$21.52
|
-0.03
-0.14% |
$21.76
|
1,535,244
72.16% of 50 DAV
50 DAV is 2,127,600
|
$22.29
-3.43%
|
8/9/2012
|
$18.97
|
PP = $18.72
|
|
MB = $19.66
|
Most Recent Note - 12/11/2012 6:25:18 PM
G - Volume totals have been cooling while consolidating. Previously noted a worrisome "negative reversal" on 11/26/12 followed by additional losses on above average volume. Results below the +25% minimum earnings guideline (C criteria) for Sep '12 recently raised fundamental concerns.
>>> The latest Featured Stock Update with an annotated graph appeared on 11/30/2012. Click here.
View all notes |
Alert me of new notes |
CANSLIM.net Company Profile |
SEC |
Zacks Reports |
StockTalk |
News |
Chart |
Request a new note
C
A N
S L
I M
|
MIDD
-
NASDAQ
Middleby Corp
MANUFACTURING - Diversified Machinery
|
$129.43
|
+2.74
2.16% |
$129.98
|
125,369
167.83% of 50 DAV
50 DAV is 74,700
|
$129.99
-0.43%
|
10/8/2012
|
$118.46
|
PP = $122.67
|
|
MB = $128.80
|
Most Recent Note - 12/11/2012 7:00:05 PM
G - Color code is changed to green after a volume-driven gain today above its "max buy" level. Earnings +23% on +18% sales for the Sep '12 quarter, below the +25% minimum earnings guideline (C criteria), raised concerns.
>>> The latest Featured Stock Update with an annotated graph appeared on 12/6/2012. Click here.
View all notes |
Alert me of new notes |
CANSLIM.net Company Profile |
SEC |
Zacks Reports |
StockTalk |
News |
Chart |
Request a new note
C
A N
S L
I M
|
Symbol/Exchange
Company Name
Industry Group |
PRICE |
CHANGE
(%Change) |
Day High |
Volume
(% DAV)
(% 50 day avg vol) |
52 Wk Hi
% From Hi |
Featured
Date |
Price
Featured |
Pivot Featured |
|
Max Buy |
NSR
-
NYSE
Neustar Inc
TELECOMMUNICATIONS - Diversified Communication Serv
|
$41.97
|
+0.81
1.97% |
$42.62
|
885,500
271.54% of 50 DAV
50 DAV is 326,100
|
$41.41
1.35%
|
12/11/2012
|
$41.85
|
PP = $41.41
|
|
MB = $43.48
|
Most Recent Note - 12/11/2012 6:58:09 PM
Y - After highlighted in yellow with pivot point cited based on its 10/05/12 high plus 10 cents in the earlier mid-day report its strong finish on heavy volume clinched a technical buy signal. Hit a new 52-week high today, rising from a 10-week base during which it found support at its 200 DMA line. Quarterly comparisons through Sep '12 showed 3 consecutive increases of more than the +25% minimum earnings guideline (C criteria). See the latest FSU analysis for more details and a new annotated graph.
>>> The latest Featured Stock Update with an annotated graph appeared on 12/11/2012. Click here.
View all notes |
Alert me of new notes |
CANSLIM.net Company Profile |
SEC |
Zacks Reports |
StockTalk |
News |
Chart |
Request a new note
C
A N
S L
I M
|
RAX
-
NYSE
Rackspace Hosting Inc
INTERNET - Internet Software and; Services
|
$67.55
|
+0.02
0.03% |
$68.34
|
954,279
62.58% of 50 DAV
50 DAV is 1,524,800
|
$70.00
-3.50%
|
11/26/2012
|
$66.26
|
PP = $67.18
|
|
MB = $70.54
|
Most Recent Note - 12/10/2012 2:28:24 PM
Y - Quietly perched within close striking distance of its 52-week high. Confirming gains above its pivot point with at least +40% above average volume would be a welcome reassurance. Disciplined investors may be wise to use a tactic called "pyramiding" to allow the market action to dictate their weighting in new buys while always limiting losses by selling if any stock ever falls more than -7% from their purchase price.
>>> The latest Featured Stock Update with an annotated graph appeared on 11/27/2012. Click here.
View all notes |
Alert me of new notes |
CANSLIM.net Company Profile |
SEC |
Zacks Reports |
StockTalk |
News |
Chart |
Request a new note
C
A N
S L
I M
|
RGR
-
NYSE
Sturm Ruger & Co Inc
CONSUMER DURABLES - Sporting Goods
|
$48.73
|
+0.13
0.27% |
$49.09
|
970,839
196.45% of 50 DAV
50 DAV is 494,200
|
$60.11
-18.93%
|
11/20/2012
|
$52.23
|
PP = $52.65
|
|
MB = $55.28
|
Most Recent Note - 12/11/2012 7:02:18 PM
G - Managed a positive reversal today after early weakness. The current pullback may be a high handle forming on its larger 7-month cup shaped base, but the volume is supposed to be light in the handle portion of a cup-with-handle base. Instead, it has been enduring distributional pressure in recent days since trading ex-dividend 12/05/12 following its previously noted $4.50/sh special dividend. Prior highs and its 50 DMA line define near-term chart support. Patience may allow for an ideal new base and breakout to be noted. See additional details in the article "Ken's Mailbag Q&A 12/10/12 - Challenges of when to lock in a profit or accumulate more shares"
>>> The latest Featured Stock Update with an annotated graph appeared on 11/21/2012. Click here.
View all notes |
Alert me of new notes |
CANSLIM.net Company Profile |
SEC |
Zacks Reports |
StockTalk |
News |
Chart |
Request a new note
C
A N
S L
I M
|
RNF
-
NYSE
Rentech Nitrogen Ptnr Lp
CHEMICALS - Agricultural Chemicals
|
$39.12
|
+0.14
0.36% |
$39.46
|
154,612
44.28% of 50 DAV
50 DAV is 349,200
|
$41.15
-4.93%
|
11/1/2012
|
$39.11
|
PP = $40.15
|
|
MB = $42.16
|
Most Recent Note - 12/10/2012 2:29:18 PM
Y - Still quietly perched within close striking distance of its 52-week high. Recent gains with below average volume indicate lackluster buying demand from the institutional crowd. Disciplined investors may watch for volume-driven gains for a new high close to trigger a technical buy signal.
>>> The latest Featured Stock Update with an annotated graph appeared on 11/26/2012. Click here.
View all notes |
Alert me of new notes |
CANSLIM.net Company Profile |
SEC |
Zacks Reports |
StockTalk |
News |
Chart |
Request a new note
C
A N
S L
I M
|
ULTA
-
NASDAQ
Ulta Salon Cosm & Frag
SPECIALTY RETAIL - Specialty Retail, Other
|
$97.03
|
-2.50
-2.51% |
$100.02
|
982,076
130.82% of 50 DAV
50 DAV is 750,700
|
$103.52
-6.27%
|
12/4/2012
|
$100.29
|
PP = $103.62
|
|
MB = $108.80
|
Most Recent Note - 12/11/2012 7:05:33 PM
Y - Damaging loss today on higher volume indicated distributional pressure against a mostly positive market backdrop, retreating from new its 52-week high. Disciplined investors will watch for volume-driven gains above the pivot point to trigger a new technical buy signal.
>>> The latest Featured Stock Update with an annotated graph appeared on 12/4/2012. Click here.
View all notes |
Alert me of new notes |
CANSLIM.net Company Profile |
SEC |
Zacks Reports |
StockTalk |
News |
Chart |
Request a new note
C
A N
S L
I M
|
Symbol/Exchange
Company Name
Industry Group |
PRICE |
CHANGE
(%Change) |
Day High |
Volume
(% DAV)
(% 50 day avg vol) |
52 Wk Hi
% From Hi |
Featured
Date |
Price
Featured |
Pivot Featured |
|
Max Buy |
VSI
-
NYSE
Vitamin Shoppe Inc
SPECIALTY RETAIL - Specialty Retail, Other
|
$57.10
|
-0.37
-0.64% |
$58.12
|
202,371
83.52% of 50 DAV
50 DAV is 242,300
|
$61.89
-7.74%
|
12/3/2012
|
$59.06
|
PP = $61.99
|
|
MB = $65.09
|
Most Recent Note - 12/10/2012 2:32:50 PM
G - Sputtering below its 50 DMA line for the past week and it reversed today's early gain. Technically, the longer it lingers below its important short-term average the worse its outlook gets The $61 area has been a stubborn resistance level in recent months.
>>> The latest Featured Stock Update with an annotated graph appeared on 12/3/2012. Click here.
View all notes |
Alert me of new notes |
CANSLIM.net Company Profile |
SEC |
Zacks Reports |
StockTalk |
News |
Chart |
Request a new note
C
A N
S L
I M
|
WPI
-
NYSE
Watson Pharmaceuticals
DRUGS - Drugs - Generic
|
$89.78
|
+1.44
1.63% |
$89.96
|
859,775
110.13% of 50 DAV
50 DAV is 780,700
|
$90.00
-0.24%
|
8/24/2012
|
$82.90
|
PP = $81.10
|
|
MB = $85.16
|
Most Recent Note - 12/11/2012 6:26:59 PM
G - Challenged its 52-week high today and finished at a best-ever close with a solid gain on slightly above average volume. No resistance remains due to overhead supply. Quarterly comparisons for sales revenues and earnings increases have shown sequential deceleration in its growth rate raising some fundamental concerns, as recently noted.
>>> The latest Featured Stock Update with an annotated graph appeared on 11/23/2012. Click here.
View all notes |
Alert me of new notes |
CANSLIM.net Company Profile |
SEC |
Zacks Reports |
StockTalk |
News |
Chart |
Request a new note
C
A N
S L
I M
|
|
|
|
THESE ARE NOT BUY RECOMMENDATIONS!
Comments contained in the body of this report are technical
opinions only. The material herein has been obtained
from sources believed to be reliable and accurate, however,
its accuracy and completeness cannot be guaranteed.
This site is not an investment advisor, hence it does
not endorse or recommend any securities or other investments.
Any recommendation contained in this report may not
be suitable for all investors and it is not to be deemed
an offer or solicitation on our part with respect to
the purchase or sale of any securities. All trademarks,
service marks and trade names appearing in this report
are the property of their respective owners, and are
likewise used for identification purposes only.
This report is a service available
only to active Paid Premium Members.
You may opt-out of receiving report notifications
at any time. Questions or comments may be submitted
by writing to Premium Membership Services 665 S.E. 10 Street, Suite 201 Deerfield Beach, FL 33441-5634 or by calling 1-800-965-8307
or 954-785-1121.
|
|
|

