You are not logged in.
This means you
CAN ONLY VIEW reports that were published prior to Monday, April 14, 2025.
You
MUST UPGRADE YOUR MEMBERSHIP if you want to see any current reports.
AFTER MARKET UPDATE - MONDAY, DECEMBER 10TH, 2012
Previous After Market Report Next After Market Report >>>
|
|
|
|
DOW |
+14.75 |
13,169.88 |
+0.11% |
|
Volume |
592,745,040 |
-2% |
|
Volume |
1,479,596,370 |
-6% |
|
NASDAQ |
+8.92 |
2,986.96 |
+0.30% |
|
Advancers |
1,666 |
53% |
|
Advancers |
1,417 |
55% |
|
S&P 500 |
+0.48 |
1,418.55 |
+0.03% |
|
Decliners |
1,345 |
43% |
|
Decliners |
1,052 |
41% |
|
Russell 2000 |
+3.99 |
826.26 |
+0.49% |
|
52 Wk Highs |
85 |
|
|
52 Wk Highs |
54 |
|
|
S&P 600 |
+1.73 |
463.87 |
+0.37% |
|
52 Wk Lows |
29 |
|
|
52 Wk Lows |
32 |
|
|
Many members have written in to us in the past saying they enjoyed prior Q&A with CANSLIM.net founder, Ken Gruneisen. This evening be sure to check out the "Ken's Mailbag Q&A" included just below the Featured Stock Update section under the table of the latest notes on all Featured Stocks.
|
 |
Major Averages Inched Higher With Lighter Volume
Kenneth J. Gruneisen - Passed the CAN SLIM® Master's Exam
The indices failed to advance past Monday's early morning highs as ongoing concerns over the fiscal cliff kept investors sidelined. The volume totals were reported lighter than the prior session on the Nasdaq exchange and on the NYSE, revealing a lack of conviction from the institutional crowd. Advancing shares led decliners by an 8-7 margin on the NYSE and by a 7-5 margin on the Nasdaq exchange. The total number of stocks hitting new 52-week highs outnumbered new 52-week lows on the NYSE and also on the Nasdaq exchange. There were 32 high-ranked companies from the CANSLIM.net Leaders List making new 52-week highs and appearing on the CANSLIM.net BreakOuts Page, better than the prior session total of 24 stocks. Any sustainable rally requires a healthy crop of companies hitting new 52-week highs, so it is important for leadership to remain present. There were gains for 6 of the 10 high-ranked companies currently included on the Featured Stocks Page.
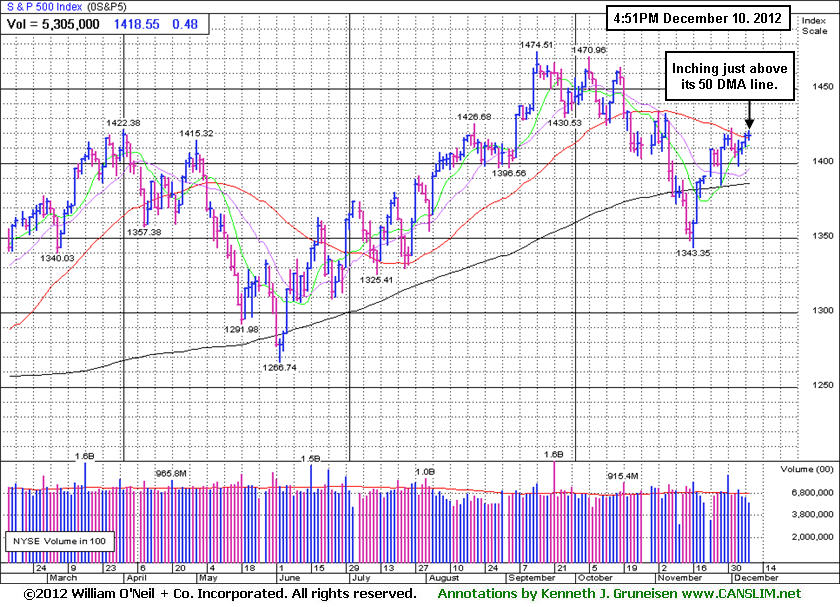
The Dow Jones Industrial Average and the S&P 500 Index rallied enough on Friday to finish the week above their respective 50-day moving average (DMA) lines. Meanwhile, the Nasdaq Composite Index has encountered resistance at its 50 DMA line.
Investors were cautious heading into the session after Italy's Prime Minister Mario Monti announced he would resign after the passage of the 2013 budget. This news sent European markets lower on fears that new leadership could derail the country's progress in reducing their much needed budget cuts. On our shores, the fiscal cliff remained in focus following President Obama and House Speaker Boehner's meeting Sunday.
Sector action was mixed with material stocks leading the advance.
Restaurant stocks are active in pre-market trading. Shares of McDonald's Corp (MCD +1.05%) were up after the company topped expectations in the November same-store sales. In other news, Ingersoll-Rand Plc (IR -1.85%) reversed into the red after an initial rally from the opening bell following the announcement that they were spinning off their security technology business. On the M&A front, Intermec Inc (IN +23.18%) rallied on news that the company was being acquired by Honeywell (HON -0.18%) in a $600 million deal. Hewlett-Packard Co (HPQ +2.61%) ended higher on rumors that Carl Icahn may be interested in the company.
Turning to fixed income markets, Treasuries were modestly higher along with curve. The benchmark 10-year note was 5/32 to yield 1.62% and the 30-year bond was up 9/32 to yield 2.80%.
The market direction (M criteria) is currently a "confirmed uptrend" and new buying efforts may be justified only in worthy high-ranked leaders. See the noteworthy companies included on the Featured Stocks Page.
Watch for an announcement via email concerning the next WEBCAST. The webcast will also be available via an updated link highlighted at the top of the Premium Member Homepage.
PICTURED: The S&P 500 Index has inched above its 50-day moving average (DMA) line.
|
 Kenneth J. Gruneisen started out as a licensed stockbroker in August 1987, a couple of months prior to the historic stock market crash that took the Dow Jones Industrial Average down -22.6% in a single day. He has published daily fact-based fundamental and technical analysis on high-ranked stocks online for two decades. Through FACTBASEDINVESTING.COM, Kenneth provides educational articles, news, market commentary, and other information regarding proven investment systems that work in good times and bad.
Comments contained in the body of this report are technical opinions only and are not necessarily those of Gruneisen Growth Corp. The material herein has been obtained from sources believed to be reliable and accurate, however, its accuracy and completeness cannot be guaranteed. Our firm, employees, and customers may effect transactions, including transactions contrary to any recommendation herein, or have positions in the securities mentioned herein or options with respect thereto. Any recommendation contained in this report may not be suitable for all investors and it is not to be deemed an offer or solicitation on our part with respect to the purchase or sale of any securities. |
|
 |
Defensive and Tech Groups Led Gains
Kenneth J. Gruneisen - Passed the CAN SLIM® Master's Exam
Defensive groups posted gains again on Monday as the Gold & Silver Index ($XAU +1.28%) and the Healthcare Index ($HMO +0.69%) rose. The tech sector had a positive bias as the Semiconductor Index ($SOX +0.62%), Networking Index ($NWX +1.12%), and the Biotechnology Index ($BTK +1.29%) rallied. Meanwhile, the Retail Index ($RLX -1.47%) and the Broker/Dealer Index ($XBD -1.11%) created a drag on the major averages and the Bank Index ($BKX -0.06%) ended flat. The Oil Services Index ($OSX -0.02%) was also unchanged as the Integrated Oil Index ($XOI +0.27%) edged higher.
Charts courtesy www.stockcharts.com
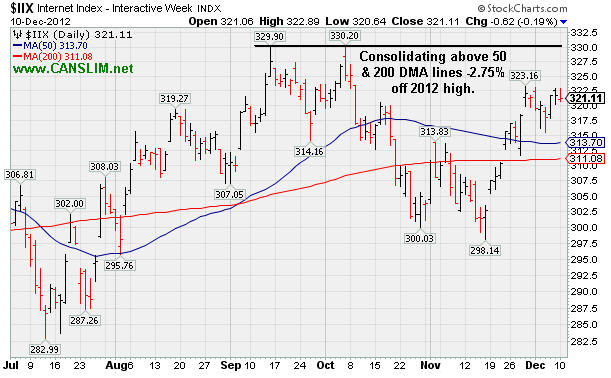
PICTURED: The Internet Index ($IIX -0.19%) is consolidating above its 50-day and 200-day moving average (DMA) lines -2.75% off its 2012 high.
| Oil Services |
$OSX |
221.61 |
-0.05 |
-0.02% |
+2.46% |
| Healthcare |
$HMO |
2,548.89 |
+17.55 |
+0.69% |
+11.71% |
| Integrated Oil |
$XOI |
1,228.95 |
+3.28 |
+0.27% |
-0.01% |
| Semiconductor |
$SOX |
381.83 |
+2.37 |
+0.62% |
+4.77% |
| Networking |
$NWX |
215.49 |
+2.39 |
+1.12% |
+0.15% |
| Internet |
$IIX |
321.11 |
-0.62 |
-0.19% |
+13.97% |
| Broker/Dealer |
$XBD |
86.83 |
-0.98 |
-1.11% |
+4.27% |
| Retail |
$RLX |
656.79 |
-9.81 |
-1.47% |
+25.53% |
| Gold & Silver |
$XAU |
164.15 |
+2.07 |
+1.28% |
-9.13% |
| Bank |
$BKX |
49.30 |
-0.03 |
-0.06% |
+25.19% |
| Biotech |
$BTK |
1,546.36 |
+19.65 |
+1.29% |
+41.68% |
|
|
|
 |
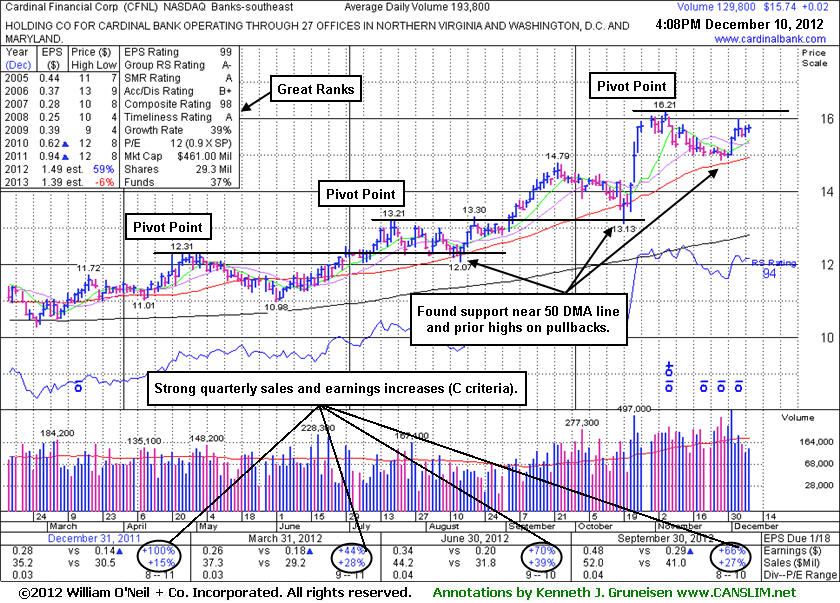
Forming New Orderly Base Above Prior Highs and 50-Day Average
Kenneth J. Gruneisen - Passed the CAN SLIM® Master's Exam
Cardinal Financial Corp's (CFNL (CFNL +$0.02 or +0.07% to $15.74) color code was recently changed to yellow again with a new pivot point cited based on its 11/06/12 high while still building on a new base pattern. Its recent low and its 50-day moving average (DMA) line define near-term chart support where violations may trigger technical sell signals. Subsequent gains above its pivot point backed by at least +40% above average volume may trigger a new (or add-on) technical buy signal. It was last shown in this FSU section on 11/20/12 with an annotated graph under the headline, "Consolidating After Surge of +26% in Just Over 3 Months", when we observed - "Prior high ($14.79 on 9/24/12) defines initial support to watch above its 50 DMA line. Disciplined investors may watch out for worrisome technical sell signals while awaiting a new base or secondary buy point and more favorable market."
CFNL rallied as much as +26.15% from $12.85 when first featured in the 7/20/12 mid-day report (read here). The high-ranked leader hailing from the Banks - Southeast industry group reported earnings +66% on +27% sales revenues for the quarter ended September 30, 2012 versus the year ago period, continuing its track record of strong quarterly earnings comparisons underpinned by encouraging sales revenues increases. It has earned high ranks and matches favorably with the C and A criteria. The number of top-rated funds owning its shares rose from 172 in Sep '11 to 185 in Sep '12, a reassuring trend concerning the I criteria. Its small supply (S criteria) of only 29.3 millions shares outstanding is a favorable characteristic, yet it can contribute to greater price volatility in the event of institutional accumulation or distributional pressure.
|
|
|
Color Codes Explained :
Y - Better candidates highlighted by our
staff of experts.
G - Previously featured
in past reports as yellow but may no longer be buyable under the
guidelines.
***Last / Change / Volume data in this table is the closing quote data***
Symbol/Exchange
Company Name
Industry Group |
PRICE |
CHANGE
(%Change) |
Day High |
Volume
(% DAV)
(% 50 day avg vol) |
52 Wk Hi
% From Hi |
Featured
Date |
Price
Featured |
Pivot Featured |
|
Max Buy |
CFNL
-
NASDAQ
Cardinal Financial Corp
BANKING - Regional - Southeast Banks
|
$15.77
|
+0.05
0.32% |
$15.84
|
152,417
78.65% of 50 DAV
50 DAV is 193,800
|
$16.21
-2.71%
|
12/3/2012
|
$15.20
|
PP = $16.31
|
|
MB = $17.13
|
Most Recent Note - 12/6/2012 3:49:22 PM
Y - Color code was changed to yellow with a new pivot point cited based on its 11/06/12 high while still building on a short base-on-base pattern. Recent low and its 50 DMA line define near-term chart support where violations may trigger technical sell signals. Volume-driven gains above its pivot point may trigger a new (or add-on) technical buy signal.
>>> The latest Featured Stock Update with an annotated graph appeared on 12/10/2012. Click here.
View all notes |
Alert me of new notes |
CANSLIM.net Company Profile |
SEC |
Zacks Reports |
StockTalk |
News |
Chart |
Request a new note
C
A N
S L
I M


|
CMCSA
-
NASDAQ
Comcast Corp Cl A
MEDIA - CATV Systems
|
$37.25
|
+0.22
0.59% |
$37.54
|
9,226,757
77.82% of 50 DAV
50 DAV is 11,857,100
|
$37.96
-1.87%
|
12/3/2012
|
$37.08
|
PP = $38.06
|
|
MB = $39.96
|
Most Recent Note - 12/7/2012 5:37:35 PM
Y - Perched -2.5% off its 52-week high. Subsequent volume-driven gains above the pivot point may trigger a new (or add-on) technical buy signal. See the latest FSU analysis for more details and a new annotated graph.
>>> The latest Featured Stock Update with an annotated graph appeared on 12/7/2012. Click here.
View all notes |
Alert me of new notes |
CANSLIM.net Company Profile |
SEC |
Zacks Reports |
StockTalk |
News |
Chart |
Request a new note
C
A N
S L
I M
|
LKQ
-
NASDAQ
L K Q Corp
WHOLESALE - Auto Parts
|
$21.55
|
+0.01
0.05% |
$21.90
|
1,425,313
66.84% of 50 DAV
50 DAV is 2,132,300
|
$22.29
-3.30%
|
8/9/2012
|
$18.97
|
PP = $18.72
|
|
MB = $19.66
|
Most Recent Note - 12/4/2012 1:50:29 PM
G - Churning above average volume in recent weeks without making meaningful price progress. Encountering resistance after a worrisome "negative reversal" and finish near the session low on 11/26/12 followed by additional losses on above average volume. Results below the +25% minimum earnings guideline (C criteria) for Sep '12 recently raised fundamental concerns.
>>> The latest Featured Stock Update with an annotated graph appeared on 11/30/2012. Click here.
View all notes |
Alert me of new notes |
CANSLIM.net Company Profile |
SEC |
Zacks Reports |
StockTalk |
News |
Chart |
Request a new note
C
A N
S L
I M
|
MIDD
-
NASDAQ
Middleby Corp
MANUFACTURING - Diversified Machinery
|
$126.69
|
+0.19
0.15% |
$126.85
|
102,538
139.70% of 50 DAV
50 DAV is 73,400
|
$129.99
-2.54%
|
10/8/2012
|
$118.46
|
PP = $122.67
|
|
MB = $128.80
|
Most Recent Note - 12/6/2012 4:46:13 PM
Y - Wedged to new highs with recent gains lacking great volume conviction. Earnings +23% on +18% sales for the Sep '12 quarter, below the +25% minimum earnings guideline (C criteria), raised concerns. See the latest FSU analysis for more details and a new annotated graph.
>>> The latest Featured Stock Update with an annotated graph appeared on 12/6/2012. Click here.
View all notes |
Alert me of new notes |
CANSLIM.net Company Profile |
SEC |
Zacks Reports |
StockTalk |
News |
Chart |
Request a new note
C
A N
S L
I M
|
RAX
-
NYSE
Rackspace Hosting Inc
INTERNET - Internet Software and; Services
|
$67.53
|
+0.20
0.30% |
$68.08
|
970,499
62.66% of 50 DAV
50 DAV is 1,548,800
|
$70.00
-3.53%
|
11/26/2012
|
$66.26
|
PP = $67.18
|
|
MB = $70.54
|
 Most Recent Note - 12/10/2012 2:28:24 PM
Y - Quietly perched within close striking distance of its 52-week high. Confirming gains above its pivot point with at least +40% above average volume would be a welcome reassurance. Disciplined investors may be wise to use a tactic called "pyramiding" to allow the market action to dictate their weighting in new buys while always limiting losses by selling if any stock ever falls more than -7% from their purchase price.
>>> The latest Featured Stock Update with an annotated graph appeared on 11/27/2012. Click here.
View all notes |
Alert me of new notes |
CANSLIM.net Company Profile |
SEC |
Zacks Reports |
StockTalk |
News |
Chart |
Request a new note
C
A N
S L
I M
|
Symbol/Exchange
Company Name
Industry Group |
PRICE |
CHANGE
(%Change) |
Day High |
Volume
(% DAV)
(% 50 day avg vol) |
52 Wk Hi
% From Hi |
Featured
Date |
Price
Featured |
Pivot Featured |
|
Max Buy |
RGR
-
NYSE
Sturm Ruger & Co Inc
CONSUMER DURABLES - Sporting Goods
|
$48.60
|
-2.84
-5.52% |
$51.22
|
971,523
202.65% of 50 DAV
50 DAV is 479,400
|
$60.11
-19.15%
|
11/20/2012
|
$52.23
|
PP = $52.65
|
|
MB = $55.28
|
Most Recent Note - 12/10/2012 2:24:12 PM
G - The current pullback may be a high handle forming on its larger 7-month cup shaped base, but the volume is supposed to be light in the handle portion of a cup-with-handle base. Instead, it has been enduring distributional pressure in recent days since trading ex-dividend 12/05/12 following its previously noted $4.50/sh special dividend. Prior highs and its 50 DMA line define near-term chart support. Patience may allow for an ideal new base and breakout to be noted. See additional details in this evening's "Ken's Mailbag Q&A 12/10/12 - Challenges of when to lock in a profit or accumulate more shares"
>>> The latest Featured Stock Update with an annotated graph appeared on 11/21/2012. Click here.
View all notes |
Alert me of new notes |
CANSLIM.net Company Profile |
SEC |
Zacks Reports |
StockTalk |
News |
Chart |
Request a new note
C
A N
S L
I M
|
RNF
-
NYSE
Rentech Nitrogen Ptnr Lp
CHEMICALS - Agricultural Chemicals
|
$38.98
|
-0.21
-0.54% |
$39.42
|
116,255
31.70% of 50 DAV
50 DAV is 366,700
|
$41.15
-5.27%
|
11/1/2012
|
$39.11
|
PP = $40.15
|
|
MB = $42.16
|
Most Recent Note - 12/10/2012 2:29:18 PM
Y - Still quietly perched within close striking distance of its 52-week high. Recent gains with below average volume indicate lackluster buying demand from the institutional crowd. Disciplined investors may watch for volume-driven gains for a new high close to trigger a technical buy signal.
>>> The latest Featured Stock Update with an annotated graph appeared on 11/26/2012. Click here.
View all notes |
Alert me of new notes |
CANSLIM.net Company Profile |
SEC |
Zacks Reports |
StockTalk |
News |
Chart |
Request a new note
C
A N
S L
I M
|
ULTA
-
NASDAQ
Ulta Salon Cosm & Frag
SPECIALTY RETAIL - Specialty Retail, Other
|
$99.53
|
-0.91
-0.91% |
$100.59
|
538,815
71.82% of 50 DAV
50 DAV is 750,200
|
$103.52
-3.85%
|
12/4/2012
|
$100.29
|
PP = $103.62
|
|
MB = $108.80
|
Most Recent Note - 12/10/2012 2:30:20 PM
Y - Still quietly perched within close striking distance of its 52-week high. Disciplined investors will watch for volume-driven gains above the pivot point to trigger a new technical buy signal.
>>> The latest Featured Stock Update with an annotated graph appeared on 12/4/2012. Click here.
View all notes |
Alert me of new notes |
CANSLIM.net Company Profile |
SEC |
Zacks Reports |
StockTalk |
News |
Chart |
Request a new note
C
A N
S L
I M
|
VSI
-
NYSE
Vitamin Shoppe Inc
SPECIALTY RETAIL - Specialty Retail, Other
|
$57.47
|
+0.18
0.31% |
$58.23
|
173,539
71.30% of 50 DAV
50 DAV is 243,400
|
$61.89
-7.14%
|
12/3/2012
|
$59.06
|
PP = $61.99
|
|
MB = $65.09
|
Most Recent Note - 12/10/2012 2:32:50 PM
G - Sputtering below its 50 DMA line for the past week and it reversed today's early gain. Technically, the longer it lingers below its important short-term average the worse its outlook gets The $61 area has been a stubborn resistance level in recent months.
>>> The latest Featured Stock Update with an annotated graph appeared on 12/3/2012. Click here.
View all notes |
Alert me of new notes |
CANSLIM.net Company Profile |
SEC |
Zacks Reports |
StockTalk |
News |
Chart |
Request a new note
C
A N
S L
I M
|
WPI
-
NYSE
Watson Pharmaceuticals
DRUGS - Drugs - Generic
|
$88.34
|
-0.28
-0.32% |
$89.16
|
521,953
66.93% of 50 DAV
50 DAV is 779,900
|
$90.00
-1.84%
|
8/24/2012
|
$82.90
|
PP = $81.10
|
|
MB = $85.16
|
Most Recent Note - 12/4/2012 1:48:03 PM
G - Consolidating within close striking distance of its 52-week high today with very little resistance remaining due to overhead supply. Quarterly comparisons for sales revenues and earnings increases have shown sequential deceleration in its growth rate raising some fundamental concerns, as recently noted.
>>> The latest Featured Stock Update with an annotated graph appeared on 11/23/2012. Click here.
View all notes |
Alert me of new notes |
CANSLIM.net Company Profile |
SEC |
Zacks Reports |
StockTalk |
News |
Chart |
Request a new note
C
A N
S L
I M
|
Symbol/Exchange
Company Name
Industry Group |
PRICE |
CHANGE
(%Change) |
Day High |
Volume
(% DAV)
(% 50 day avg vol) |
52 Wk Hi
% From Hi |
Featured
Date |
Price
Featured |
Pivot Featured |
|
Max Buy |
|
 |
| Subscriber Question: |
December 6, 2012 |
Dear Ken,
Two questions: 1. I'm confused as to the right time to sell. I've realized some modest gains on a couple of stocks, and I'd like to set a sell order at some point below the current price to avoid losing the gains in the event of a downturn, but I don't know where to set that point. I understand cutting losses at 7-8% below the purchase price, but how do I know how far to give back some of my gains before selling? I would think its dependent on the volatility of the stock. That is, if it routinely fluctuates 2-3%, you clearly want the sell order outside that window to preclude a sale based on a momentary swing. How far back do I go when calculating that volatility and is there a calculator that allows me to do so fairly easily ie, without going back and manually checking price changes each day? 2. I recently purchased RGR and it went up nicely before paying out on a dividend, which reduced its price back into the window between Pivot Point and Max Buy values. Should I buy more shares since it back within that window? Seems like I should, but I'm not sure. Thanks for your help.
Thank you,
Kent V. |
| Ken's Response: |
December 10, 2012 |
Dear Kent V:
Thank you for writing in with two great questions which dwell on the very challenging task of determining when to lock in a profit and when to accumulate more shares in an already held position.
They do not teach any rules in the Certification that aim to calculate and account for a specific stock's volatility as you are suggesting. In cases where you already have bought a stock properly and you have a profit cushion, your bias should be usually lean more toward giving it the benefit of the doubt and perhaps accumulating more shares. Market action overall (the M criteria) should weigh greatly on the decision-making process though, since 3 out of 4 stocks will tend to go along with the general direction of the major averages.
Remain concerned and focused primarily on the technical chart (price/volume) action, and you may consider multiple distribution days (damaging down days with volume higher than the prior session volume total) in a short span as a technical sell signal even if there are not any specific trendlines or moving averages being violated.
If a secondary buy point develops or a new technical breakout occurs from a sound base then you sometimes might be wise to add to an existing position in a stock. In the Certification they teach that you should already have a substantial profit in the stock, not a marginal profit, and you must be very careful to not substantially average your cost up with later purchases. For example, assuming you bought 1,000 shares of a stock earlier, if it eventually triggers another new buy signal you might buy 500 shares at the higher price. Always sell all of the shares bought at the higher price if it falls -7% from that higher purchase price (not the averaged price), if not additionally selling some or all of the shares you owned at a lower price. Do not try to be counter-intuitive or move contrary to the market by bargain hunting for buys. The technical action should always dictate how seriously you react, so you should hurry out of it if the technical action is poor, and you should pile into it if the technical action is strong. Historic studies have proven that investors odds are best when buying stocks that are on the rise, rather than buying stocks that are pulling back.
If you are ever not sure what to do we would urge you to err on the side of caution. Prior reports noted an earlier pivot point and specifically did not yet cite a new pivot point based on RGR's high on 5/01/12, or based on its 11/30/12 high. Note that prices cited in our reports and via other sources may be noted and adjusted in the near-term to account for the Special Dividend, so you may note that data such as 52-week high and even the Featured Price, Pivot Point, and Max Buy levels cited in our reports may be noted and adjusted in the near-term. Suffice it to say that unless you subsequently see a powerful rally into new high territory, it is very hard to argue that it has the bullish look of institutional accumulation or the beginning of another substantial leg up in price.
CANSLIM.net is not an investment adviser and we cannot give members specific recommendations on what to do with any stock at any given time. We can discuss the fact-based system and clarify whether a stock has met the criteria, and we can analyze the technical action as buy signals and sell signals according to the investment system's guidelines to help our members understand what has happened and hopefully know what to do. Please see our site's Terms & Conditions page for additional legal information. ( http://www.canslim.net/termsandconditions.htm )
Hopefully this answer will be somewhat helpful to you. If you need additional clarification of anything please feel free to contact me directly as I will be glad to assist you.
We appreciate any suggestions you may have on how we can improve our services. Please use the inquiry form if you have any other questions about the upgraded services we provide. We always say around here that if one person asks a question there were probably 20 other members who had the same question, but they were too busy and didn't take time to ask!
We wish you the utmost success with the fact-based investment system we support.
Best regards,

Kenneth J. Gruneisen
Founder & Contributing Writer for CANSLIM.net
www.canslim.net |
|
|
|
THESE ARE NOT BUY RECOMMENDATIONS!
Comments contained in the body of this report are technical
opinions only. The material herein has been obtained
from sources believed to be reliable and accurate, however,
its accuracy and completeness cannot be guaranteed.
This site is not an investment advisor, hence it does
not endorse or recommend any securities or other investments.
Any recommendation contained in this report may not
be suitable for all investors and it is not to be deemed
an offer or solicitation on our part with respect to
the purchase or sale of any securities. All trademarks,
service marks and trade names appearing in this report
are the property of their respective owners, and are
likewise used for identification purposes only.
This report is a service available
only to active Paid Premium Members.
You may opt-out of receiving report notifications
at any time. Questions or comments may be submitted
by writing to Premium Membership Services 665 S.E. 10 Street, Suite 201 Deerfield Beach, FL 33441-5634 or by calling 1-800-965-8307
or 954-785-1121.
|
|
|

