***Last / Change / Volume data in this table is the closing quote data***
Symbol/Exchange
Company Name
Industry Group |
PRICE |
CHANGE
(%Change) |
Day High |
Volume
(% DAV)
(% 50 day avg vol) |
52 Wk Hi
% From Hi |
Featured
Date |
Price
Featured |
Pivot Featured |
|
Max Buy |
ABV
-
NYSE
Comp De Bebidas Adr
FOOD and BEVERAGE - Beverages - Brewers
|
$141.30
|
+1.75
1.25% |
$141.65
|
367,554
57.70% of 50 DAV
50 DAV is 637,000
|
$145.36
-2.79%
|
12/10/2010
|
$139.87
|
PP = $145.46
|
|
MB = $152.73
|
 Most Recent Note - 12/10/2010 1:49:21 PM
Y - Volume totals have been drying up while consolidating just above its 50 DMA line. Color code remains yellow while a slightly higher pivot point is cited today after a longer orderly base has been formed. A gain into new high territory with great volume conviction may trigger a new (or add-on) buy signal. Recent lows in the $133 area define important chart support to watch.
>>> The latest Featured Stock Update with an annotated graph appeared on 12/3/2010. Click here.
View all notes |
Alert me of new notes |
CANSLIM.net Company Profile |
SEC |
Zacks Reports |
StockTalk |
News |
Chart |
Request a new note
C
A N
S L
I M


|
ARUN
-
NASDAQ
Aruba Networks Inc
COMPUTER HARDWARE - Networking andamp; Communication Dev
|
$23.16
|
+0.04
0.17% |
$23.28
|
1,854,839
69.82% of 50 DAV
50 DAV is 2,656,500
|
$24.28
-4.61%
|
8/30/2010
|
$18.12
|
PP = $18.51
|
|
MB = $19.44
|
Most Recent Note - 12/8/2010 6:05:29 PM
G - Small gain today on light volume, still quietly consolidating above its 50 DMA line. Perched -5.7% off its 52-week high with volume totals cooling after enduring distributional pressure last week. It made a stand near an upward trendline connecting May - November lows previously noted as support to watch.
>>> The latest Featured Stock Update with an annotated graph appeared on 10/26/2010. Click here.
View all notes |
Alert me of new notes |
CANSLIM.net Company Profile |
SEC |
Zacks Reports |
StockTalk |
News |
Chart |
Request a new note
C
A N
S L
I M
|
BIDU
-
NASDAQ
Baidu Inc Ads
INTERNET - Internet Information Providers
|
$107.86
|
-0.22
-0.20% |
$108.57
|
5,666,482
49.54% of 50 DAV
50 DAV is 11,439,200
|
$115.04
-6.25%
|
12/10/2010
|
$108.00
|
PP = $115.14
|
|
MB = $120.90
|
Most Recent Note - 12/10/2010 1:53:27 PM
Y - Consolidating above important support at its 50 DMA line, a new pivot point is cited and its color code is changed to yellow. BIDU has been noted as a riskier "late stage" candidate, yet could trigger a new (or add-on) buy signal and go on to produce more climactic gains. Meanwhile, any damaging violation of its short-term average or recent chart low ($103.11 on 11/16/10) would raise concerns and trigger technical sell signals.
>>> The latest Featured Stock Update with an annotated graph appeared on 11/30/2010. Click here.
View all notes |
Alert me of new notes |
CANSLIM.net Company Profile |
SEC |
Zacks Reports |
StockTalk |
News |
Chart |
Request a new note
C
A N
S L
I M
|
CACC
-
NASDAQ
Credit Acceptance Corp
FINANCIAL SERVICES - Credit Services
|
$61.53
|
-0.39
-0.63% |
$61.94
|
9,922
41.00% of 50 DAV
50 DAV is 24,200
|
$63.45
-3.02%
|
11/22/2010
|
$59.97
|
PP = $62.00
|
|
MB = $65.10
|
Most Recent Note - 12/9/2010 5:33:26 PM
Y - Hovering only -2.4% off its 52-week high, stubbornly holding its ground since the 11/29/10 gain with +69% above average volume triggered a technical buy signal. Additional volume-driven gains into new high territory would be a reassuring sign.
>>> The latest Featured Stock Update with an annotated graph appeared on 10/29/2010. Click here.
View all notes |
Alert me of new notes |
CANSLIM.net Company Profile |
SEC |
Zacks Reports |
StockTalk |
News |
Chart |
Request a new note
C
A N
S L
I M
|
CIS
-
NYSE
Camelot Info Systems Ads
COMPUTER SOFTWARE andamp; SERVICES - Information Technology Service
|
$21.39
|
+1.39
6.95% |
$21.75
|
2,585,670
842.24% of 50 DAV
50 DAV is 307,000
|
$24.89
-14.06%
|
11/26/2010
|
$18.93
|
PP = $19.72
|
|
MB = $20.71
|
Most Recent Note - 12/10/2010 11:45:13 AM
G - Rising today after pricing a Secondary Offering in which the company will not receive any proceeds from the sale by existing shareholders. Following a couple of damaging distribution days, it found support near prior highs in the $19.50 area previously noted as chart support to watch.
>>> The latest Featured Stock Update with an annotated graph appeared on 11/26/2010. Click here.
View all notes |
Alert me of new notes |
CANSLIM.net Company Profile |
SEC |
Zacks Reports |
StockTalk |
News |
Chart |
Request a new note
C
A N
S L
I M
|
Symbol/Exchange
Company Name
Industry Group |
PRICE |
CHANGE
(%Change) |
Day High |
Volume
(% DAV)
(% 50 day avg vol) |
52 Wk Hi
% From Hi |
Featured
Date |
Price
Featured |
Pivot Featured |
|
Max Buy |
CMG
-
NYSE
Chipotle Mexican Grill
LEISURE - Restaurants
|
$238.22
|
+2.59
1.10% |
$239.00
|
494,066
48.05% of 50 DAV
50 DAV is 1,028,200
|
$262.78
-9.34%
|
9/1/2010
|
$158.31
|
PP = $155.52
|
|
MB = $163.30
|
Most Recent Note - 12/8/2010 5:56:33 PM
G - Down today on lighter volume following recent damaging distributional losses with above average volume. It was repeatedly noted as -"Extended from any sound base pattern." Its 50 DMA line (now $213.45) defines the nearest chart support level.
>>> The latest Featured Stock Update with an annotated graph appeared on 10/28/2010. Click here.
View all notes |
Alert me of new notes |
CANSLIM.net Company Profile |
SEC |
Zacks Reports |
StockTalk |
News |
Chart |
Request a new note
C
A N
S L
I M
|
DECK
-
NASDAQ
Deckers Outdoor Corp
CONSUMER NON-DURABLES - Textile - Apparel Footwear
|
$82.78
|
+3.48
4.39% |
$82.94
|
2,504,658
147.02% of 50 DAV
50 DAV is 1,703,600
|
$85.00
-2.61%
|
10/27/2010
|
$54.16
|
PP = $54.86
|
|
MB = $57.60
|
Most Recent Note - 12/10/2010 1:42:14 PM
G - Up today after distributional losses this week including a negative reversal at an all-time high. It has been noted as very extended from any sound base, while its 50 DMA line defines the nearest chart support.
>>> The latest Featured Stock Update with an annotated graph appeared on 10/27/2010. Click here.
View all notes |
Alert me of new notes |
CANSLIM.net Company Profile |
SEC |
Zacks Reports |
StockTalk |
News |
Chart |
Request a new note
C
A N
S L
I M
|
EZCH
-
NASDAQ
Ezchip Semiconductor Ltd
ELECTRONICS - Semiconductor - Specialized
|
$28.89
|
+0.61
2.16% |
$29.01
|
209,664
76.08% of 50 DAV
50 DAV is 275,600
|
$29.65
-2.56%
|
12/2/2010
|
$27.53
|
PP = $26.00
|
|
MB = $27.30
|
Most Recent Note - 12/10/2010 2:25:18 PM
G - Hovering near its 52-week high, stubbornly holding its ground after considerable gains with above average volume. It is extended from the previously noted "double bottom" base pattern. Prior chart highs in the $26 area define an important technical support level to watch.
>>> The latest Featured Stock Update with an annotated graph appeared on 12/2/2010. Click here.
View all notes |
Alert me of new notes |
CANSLIM.net Company Profile |
SEC |
Zacks Reports |
StockTalk |
News |
Chart |
Request a new note
C
A N
S L
I M
|
EZPW
-
NASDAQ
Ezcorp Inc Cl A
SPECIALTY RETAIL - Specialty Retail, Other
|
$27.76
|
+0.37
1.35% |
$27.96
|
252,547
76.62% of 50 DAV
50 DAV is 329,600
|
$27.87
-0.39%
|
11/5/2010
|
$24.02
|
PP = $23.85
|
|
MB = $25.04
|
Most Recent Note - 12/8/2010 6:01:40 PM
G - Gain today with above average volume for a new all-time high. Extended from a sound base pattern, its prior highs in the $22-23 area define chart support to watch coinciding with its 50 DMA line.
>>> The latest Featured Stock Update with an annotated graph appeared on 11/6/2010. Click here.
View all notes |
Alert me of new notes |
CANSLIM.net Company Profile |
SEC |
Zacks Reports |
StockTalk |
News |
Chart |
Request a new note
C
A N
S L
I M
|
FFIV
-
NASDAQ
F 5 Networks Inc
INTERNET - Internet Software and Services
|
$143.09
|
+4.17
3.00% |
$143.55
|
4,260,221
145.40% of 50 DAV
50 DAV is 2,930,000
|
$143.00
0.06%
|
6/16/2010
|
$74.50
|
PP = $74.10
|
|
MB = $77.81
|
Most Recent Note - 12/10/2010 12:40:13 PM
G - Holding its ground stubbornly near an all-time high, extended from any sound base pattern. Its 50 DMA line and prior highs define chart support levels to watch.
>>> The latest Featured Stock Update with an annotated graph appeared on 11/15/2010. Click here.
View all notes |
Alert me of new notes |
CANSLIM.net Company Profile |
SEC |
Zacks Reports |
StockTalk |
News |
Chart |
Request a new note
C
A N
S L
I M
|
Symbol/Exchange
Company Name
Industry Group |
PRICE |
CHANGE
(%Change) |
Day High |
Volume
(% DAV)
(% 50 day avg vol) |
52 Wk Hi
% From Hi |
Featured
Date |
Price
Featured |
Pivot Featured |
|
Max Buy |
FOSL
-
NASDAQ
Fossil Inc
CONSUMER DURABLES - Recreational Goods, Other
|
$73.42
|
+0.09
0.12% |
$74.24
|
491,558
58.12% of 50 DAV
50 DAV is 845,800
|
$74.34
-1.24%
|
11/26/2010
|
$69.10
|
PP = $70.17
|
|
MB = $73.68
|
Most Recent Note - 12/9/2010 5:34:29 PM
Y - Gain today with light volume for a new high close. It rallied to a new all-time high above its pivot point with volume +147% above average behind its considerable 12/02/10 gain, triggering a technical buy signal after an advanced "3-weeks tight" pattern.
>>> The latest Featured Stock Update with an annotated graph appeared on 11/29/2010. Click here.
View all notes |
Alert me of new notes |
CANSLIM.net Company Profile |
SEC |
Zacks Reports |
StockTalk |
News |
Chart |
Request a new note
C
A N
S L
I M
|
HMSY
-
NASDAQ
H M S Holdings Corp
COMPUTER SOFTWARE and SERVICES - Healthcare Information Service
|
$65.15
|
-0.73
-1.11% |
$65.88
|
257,287
129.29% of 50 DAV
50 DAV is 199,000
|
$67.01
-2.78%
|
11/19/2010
|
$61.89
|
PP = $63.01
|
|
MB = $66.16
|
Most Recent Note - 12/10/2010 2:10:54 PM
G - Consolidating after a streak of gains with below average volume. Prior highs near $62 define initial chart support to watch above its 50 DMA line.
>>> The latest Featured Stock Update with an annotated graph appeared on 11/19/2010. Click here.
View all notes |
Alert me of new notes |
CANSLIM.net Company Profile |
SEC |
Zacks Reports |
StockTalk |
News |
Chart |
Request a new note
C
A N
S L
I M
|
HS
-
NYSE
Healthspring Inc
HEALTH SERVICES - Health Care Plans
|
$28.36
|
+0.11
0.39% |
$28.53
|
386,316
67.22% of 50 DAV
50 DAV is 574,700
|
$29.80
-4.83%
|
8/27/2010
|
$19.91
|
PP = $19.75
|
|
MB = $20.74
|
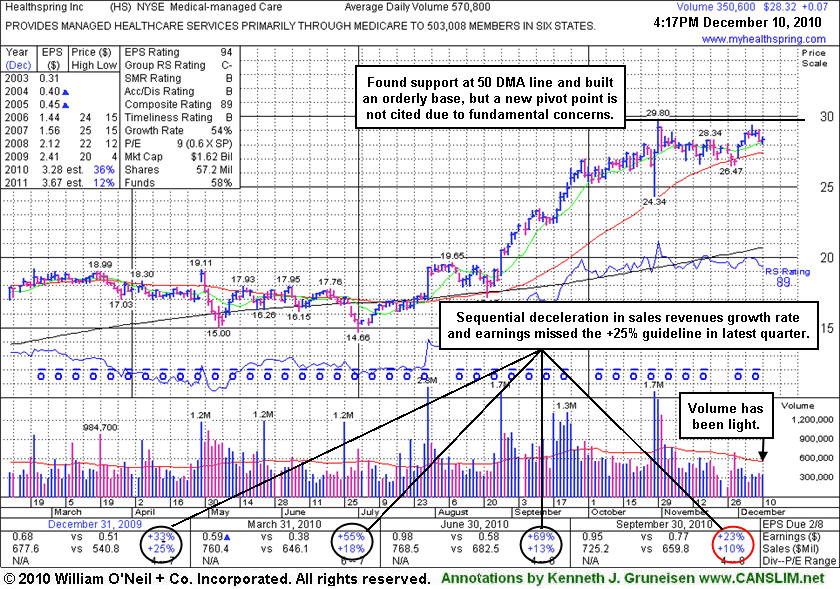
Most Recent Note - 12/10/2010 4:34:22 PM
G - See the latest FSU analysis for more details and an annotated graph. Volume totals have been cooling since spiking higher in late October. It has built an orderly base above support at its 50 DMA line, however its color code remains green and a new pivot point is not being cited. Recent low near $26.50 defines chart support to watch just below its short-term average. Earnings increased by +23% in the latest quarter, just under the +25% guideline. Sales revenues growth has shown sequential deceleration from +25%, +18%, +13%, to +10% in the Dec '09 and Mar, Jun, Sep '10 quarters, respectively, raising some fundamental concerns.
>>> The latest Featured Stock Update with an annotated graph appeared on 12/10/2010. Click here.
View all notes |
Alert me of new notes |
CANSLIM.net Company Profile |
SEC |
Zacks Reports |
StockTalk |
News |
Chart |
Request a new note
C
A N
S L
I M
|
JOBS
-
NASDAQ
Fifty One Job Inc Ads
DIVERSIFIED SERVICES - Staffing and; Outsourcing Service
|
$53.94
|
-0.06
-0.11% |
$55.50
|
172,131
91.56% of 50 DAV
50 DAV is 188,000
|
$54.20
-0.48%
|
10/13/2010
|
$42.07
|
PP = $40.60
|
|
MB = $42.63
|
Most Recent Note - 12/10/2010 2:15:55 PM
G - Posting a 4th consecutive gain today with light volume, approaching its all-time high at $55 from 2004. It is extended from any sound base, and a steep upward trendline defines initial support to watch above its 50 DMA line.
>>> The latest Featured Stock Update with an annotated graph appeared on 11/16/2010. Click here.
View all notes |
Alert me of new notes |
CANSLIM.net Company Profile |
SEC |
Zacks Reports |
StockTalk |
News |
Chart |
Request a new note
C
A N
S L
I M
|
LULU
-
NASDAQ
Lululemon Athletica
MANUFACTURING - Textile Manufacturing
|
$68.70
|
+5.14
8.09% |
$69.25
|
5,824,955
517.87% of 50 DAV
50 DAV is 1,124,800
|
$66.66
3.06%
|
10/8/2010
|
$47.66
|
PP = $46.67
|
|
MB = $49.00
|
Most Recent Note - 12/10/2010 12:57:55 PM
G - Gain today for another new high after a considerable gap up gain on 12/09/10 for new all-time highs above its 2007 best. Reported +80% earnings on +56% sales revenues for the quarter ended October 31, 2010 versus the year ago period.
>>> The latest Featured Stock Update with an annotated graph appeared on 12/1/2010. Click here.
View all notes |
Alert me of new notes |
CANSLIM.net Company Profile |
SEC |
Zacks Reports |
StockTalk |
News |
Chart |
Request a new note
C
A N
S L
I M
|
Symbol/Exchange
Company Name
Industry Group |
PRICE |
CHANGE
(%Change) |
Day High |
Volume
(% DAV)
(% 50 day avg vol) |
52 Wk Hi
% From Hi |
Featured
Date |
Price
Featured |
Pivot Featured |
|
Max Buy |
MWIV
-
NASDAQ
M W I Veterinary Supply
HEALTH SERVICES - Medical Instruments and; Supplies
|
$59.18
|
-1.10
-1.82% |
$60.06
|
71,435
129.88% of 50 DAV
50 DAV is 55,000
|
$63.94
-7.44%
|
11/4/2010
|
$61.79
|
PP = $59.60
|
|
MB = $62.58
|
Most Recent Note - 12/10/2010 1:39:23 PM
Y - Down today for a 3rd consecutive loss, consolidating near its 50 DMA line, now -7.8% off its 52-week high. Volume totals have been drying up since hitting its all-time high on 11/04/10. Its short-term average and an upward trendline connecting its May - August lows define chart support levels to watch.
>>> The latest Featured Stock Update with an annotated graph appeared on 11/2/2010. Click here.
View all notes |
Alert me of new notes |
CANSLIM.net Company Profile |
SEC |
Zacks Reports |
StockTalk |
News |
Chart |
Request a new note
C
A N
S L
I M
|
NEOG
-
NASDAQ
Neogen Corp
DRUGS - Diagnostic Substances
|
$39.69
|
+0.70
1.80% |
$39.60
|
58,811
78.94% of 50 DAV
50 DAV is 74,500
|
$39.44
0.63%
|
9/1/2010
|
$30.79
|
PP = $30.49
|
|
MB = $32.01
|
Most Recent Note - 12/10/2010 2:20:54 PM
G - Posting a 5th consecutive gain today with below average volume for another new all-time high. Extended from any sound base after steadily advancing. Its 50 DMA line has been a reliable support level.
>>> The latest Featured Stock Update with an annotated graph appeared on 12/6/2010. Click here.
View all notes |
Alert me of new notes |
CANSLIM.net Company Profile |
SEC |
Zacks Reports |
StockTalk |
News |
Chart |
Request a new note
C
A N
S L
I M
|
NFLX
-
NASDAQ
Netflix Inc
SPECIALTY RETAIL - Music and Video Stores
|
$194.63
|
+3.58
1.87% |
$197.97
|
6,783,704
112.07% of 50 DAV
50 DAV is 6,053,200
|
$206.80
-5.88%
|
11/9/2010
|
$173.10
|
PP = $184.84
|
|
MB = $194.08
|
Most Recent Note - 12/10/2010 2:19:07 PM
G - Held its ground above prior highs in the $184 area after recent negative reversals and distributional pressure raised concerns. An upward trendline connecting its July - November lows defines initial support to watch above its 50 DMA line.
>>> The latest Featured Stock Update with an annotated graph appeared on 11/24/2010. Click here.
View all notes |
Alert me of new notes |
CANSLIM.net Company Profile |
SEC |
Zacks Reports |
StockTalk |
News |
Chart |
Request a new note
C
A N
S L
I M
|
NTAP
-
NASDAQ
Netapp Inc
COMPUTER HARDWARE - Data Storage Devices
|
$54.15
|
-0.40
-0.73% |
$54.87
|
4,991,515
72.74% of 50 DAV
50 DAV is 6,862,300
|
$57.96
-6.57%
|
9/8/2010
|
$46.98
|
PP = $44.99
|
|
MB = $47.24
|
Most Recent Note - 12/8/2010 6:03:16 PM
G - Closed near the session high with a gain on light volume today, still consolidating above its 50 DMA line. It is not near a sound base pattern, but last week's gains above its short-term average improved its technical stance.
>>> The latest Featured Stock Update with an annotated graph appeared on 11/3/2010. Click here.
View all notes |
Alert me of new notes |
CANSLIM.net Company Profile |
SEC |
Zacks Reports |
StockTalk |
News |
Chart |
Request a new note
C
A N
S L
I M
|
ORCL
-
NASDAQ
Oracle Corp
COMPUTER SOFTWARE and SERVICES - Application Software
|
$29.95
|
+0.69
2.34% |
$29.78
|
28,514,428
88.33% of 50 DAV
50 DAV is 32,283,200
|
$29.82
0.42%
|
12/7/2010
|
$29.05
|
PP = $29.92
|
|
MB = $31.42
|
Most Recent Note - 12/10/2010 2:07:10 PM
Y - Posting a 4th consecutive gain today, hitting a new 52-week high without great volume conviction. After consolidating in an orderly fashion and finding support above prior highs a new pivot point was cited. A subsequent breakout with great volume conviction may trigger a new (or add-on) buy signal.
>>> The latest Featured Stock Update with an annotated graph appeared on 11/18/2010. Click here.
View all notes |
Alert me of new notes |
CANSLIM.net Company Profile |
SEC |
Zacks Reports |
StockTalk |
News |
Chart |
Request a new note
C
A N
S L
I M
|
Symbol/Exchange
Company Name
Industry Group |
PRICE |
CHANGE
(%Change) |
Day High |
Volume
(% DAV)
(% 50 day avg vol) |
52 Wk Hi
% From Hi |
Featured
Date |
Price
Featured |
Pivot Featured |
|
Max Buy |
PAY
-
NYSE
Verifone Systems Inc
COMPUTER HARDWARE - Transaction Automation Systems
|
$40.21
|
-0.46
-1.13% |
$40.91
|
1,720,255
114.91% of 50 DAV
50 DAV is 1,497,100
|
$40.81
-1.46%
|
11/29/2010
|
$33.96
|
PP = $36.04
|
|
MB = $37.84
|
Most Recent Note - 12/10/2010 1:56:13 PM
G - Extended from a sound base and stubbornly holding its ground. Prior high in the $36 area defines initial chart support to watch above its 50 DMA line.
>>> The latest Featured Stock Update with an annotated graph appeared on 10/25/2010. Click here.
View all notes |
Alert me of new notes |
CANSLIM.net Company Profile |
SEC |
Zacks Reports |
StockTalk |
News |
Chart |
Request a new note
C
A N
S L
I M
|
RAX
-
NYSE
Rackspace Hosting Inc
INTERNET - Internet Software and; Services
|
$31.01
|
+0.96
3.19% |
$32.69
|
6,126,015
254.00% of 50 DAV
50 DAV is 2,411,800
|
$31.42
-1.30%
|
9/21/2010
|
$22.84
|
PP = $23.61
|
|
MB = $24.79
|
Most Recent Note - 12/10/2010 1:12:48 PM
G - Volume has already doubled its average daily volume total, but it is off the session's earlier highs after rallying to a new all-time high today. No resistance remains due to overhead supply, but it is extended from any sound base.
>>> The latest Featured Stock Update with an annotated graph appeared on 11/17/2010. Click here.
View all notes |
Alert me of new notes |
CANSLIM.net Company Profile |
SEC |
Zacks Reports |
StockTalk |
News |
Chart |
Request a new note
C
A N
S L
I M
|
ROVI
-
NASDAQ
Rovi Corp
COMPUTER SOFTWARE andamp; SERVICES - Security Software andamp; Services
|
$58.31
|
-0.17
-0.29% |
$58.68
|
698,782
57.33% of 50 DAV
50 DAV is 1,218,900
|
$58.48
-0.29%
|
10/29/2010
|
$49.99
|
PP = $53.10
|
|
MB = $55.76
|
Most Recent Note - 12/8/2010 6:30:16 PM
G - Posted a 4th consecutive gain today with average volume for another new 52-week high. Color code was changed to green after getting extended from its latest base without enough volume behind gains in recent weeks to trigger a proper new (or add-on) technical buy signal. Meanwhile, its 50 DMA line defines important support to watch.
>>> The latest Featured Stock Update with an annotated graph appeared on 10/20/2010. Click here.
View all notes |
Alert me of new notes |
CANSLIM.net Company Profile |
SEC |
Zacks Reports |
StockTalk |
News |
Chart |
Request a new note
C
A N
S L
I M
|
SHOO
-
NASDAQ
Steven Madden Limited
CONSUMER NON-DURABLES - Textile - Apparel Footwear
|
$46.50
|
-0.03
-0.06% |
$46.50
|
365,422
98.58% of 50 DAV
50 DAV is 370,700
|
$47.69
-2.50%
|
11/23/2010
|
$44.61
|
PP = $44.95
|
|
MB = $47.20
|
Most Recent Note - 12/10/2010 2:23:05 PM
G - Holding its ground above prior highs since its solid gain on 12/07/10 with +90% above average volume. Prior highs in the $44 area define initial support to watch on pullbacks.
>>> The latest Featured Stock Update with an annotated graph appeared on 11/23/2010. Click here.
View all notes |
Alert me of new notes |
CANSLIM.net Company Profile |
SEC |
Zacks Reports |
StockTalk |
News |
Chart |
Request a new note
C
A N
S L
I M
|
SLW
-
NYSE
Silver Wheaton Corp
METALS and; MINING - Silver
|
$38.51
|
+0.03
0.08% |
$38.54
|
8,642,650
85.90% of 50 DAV
50 DAV is 10,060,800
|
$42.34
-9.05%
|
8/25/2010
|
$21.40
|
PP = $21.99
|
|
MB = $23.09
|
Most Recent Note - 12/8/2010 5:40:36 PM
G - Gapped down today following a negative reversal on the prior session after reaching an all-time high and capping a streak of 6 consecutive gains. Extended from any sound base, its prior chart highs in the $36-37 area define initial support well above its 50 DMA line.
>>> The latest Featured Stock Update with an annotated graph appeared on 12/8/2010. Click here.
View all notes |
Alert me of new notes |
CANSLIM.net Company Profile |
SEC |
Zacks Reports |
StockTalk |
News |
Chart |
Request a new note
C
A N
S L
I M
|
Symbol/Exchange
Company Name
Industry Group |
PRICE |
CHANGE
(%Change) |
Day High |
Volume
(% DAV)
(% 50 day avg vol) |
52 Wk Hi
% From Hi |
Featured
Date |
Price
Featured |
Pivot Featured |
|
Max Buy |
UA
-
NYSE
Under Armour Inc Cl A
CONSUMER NON-DURABLES - Textile - Apparel Clothing
|
$60.01
|
+1.00
1.69% |
$59.51
|
632,980
91.12% of 50 DAV
50 DAV is 694,700
|
$60.12
-0.18%
|
9/9/2010
|
$39.99
|
PP = $40.10
|
|
MB = $42.11
|
Most Recent Note - 12/10/2010 1:57:57 PM
G - Hovering near its 52-week high, stubbornly holding its ground. The high-ranked Apparel - Clothing firm is extended from any sound base and well above support at its 50 DMA line.
>>> The latest Featured Stock Update with an annotated graph appeared on 11/4/2010. Click here.
View all notes |
Alert me of new notes |
CANSLIM.net Company Profile |
SEC |
Zacks Reports |
StockTalk |
News |
Chart |
Request a new note
C
A N
S L
I M
|
ULTA
-
NASDAQ
Ulta Salon Cosm & Frag
SPECIALTY RETAIL - Specialty Retail, Other
|
$34.71
|
-0.05
-0.14% |
$34.93
|
418,609
81.11% of 50 DAV
50 DAV is 516,100
|
$37.24
-6.79%
|
9/3/2010
|
$26.36
|
PP = $25.89
|
|
MB = $27.18
|
Most Recent Note - 12/10/2010 2:02:57 PM
G - Holding its ground near all-time highs after enduring distributional pressure including a negative reversal on 12/02/10. It is extended from any sound base, meanwhile, its 50 DMA line defines initial support to watch.
>>> The latest Featured Stock Update with an annotated graph appeared on 11/1/2010. Click here.
View all notes |
Alert me of new notes |
CANSLIM.net Company Profile |
SEC |
Zacks Reports |
StockTalk |
News |
Chart |
Request a new note
C
A N
S L
I M
|
VIT
-
NYSE
Vanceinfo Tech Inc Ads
COMPUTER SOFTWARE and SERVICES - Business Software and Services
|
$36.42
|
+1.28
3.64% |
$35.67
|
1,077,359
168.68% of 50 DAV
50 DAV is 638,700
|
$41.06
-11.30%
|
7/8/2010
|
$25.20
|
PP = $26.58
|
|
MB = $27.91
|
Most Recent Note - 12/10/2010 2:14:47 PM
G - Up from early lows today, promptly repairing the violation of its 50 DMA line after enduring heavy distributional pressure this week. Completed a Public Offering on 11/23/10. See the latest FSU analysis for more details and an annotated graph.
>>> The latest Featured Stock Update with an annotated graph appeared on 12/9/2010. Click here.
View all notes |
Alert me of new notes |
CANSLIM.net Company Profile |
SEC |
Zacks Reports |
StockTalk |
News |
Chart |
Request a new note
C
A N
S L
I M
|