You are not logged in.
This means you
CAN ONLY VIEW reports that were published prior to Monday, April 14, 2025.
You
MUST UPGRADE YOUR MEMBERSHIP if you want to see any current reports.
AFTER MARKET UPDATE - MONDAY, DECEMBER 9TH, 2013
Previous After Market Report Next After Market Report >>>
|
|
|
|
DOW |
+5.33 |
16,025.53 |
+0.03% |
|
Volume |
684,373,090 |
+2% |
|
Volume |
1,587,101,060 |
-5% |
|
NASDAQ |
+6.23 |
4,068.75 |
+0.15% |
|
Advancers |
1,498 |
48% |
|
Advancers |
1,051 |
39% |
|
S&P 500 |
+3.28 |
1,808.37 |
+0.18% |
|
Decliners |
1,483 |
48% |
|
Decliners |
1,521 |
57% |
|
Russell 2000 |
-1.92 |
1,129.46 |
-0.17% |
|
52 Wk Highs |
153 |
|
|
52 Wk Highs |
152 |
|
|
S&P 600 |
-0.91 |
648.67 |
-0.14% |
|
52 Wk Lows |
61 |
|
|
52 Wk Lows |
37 |
|
|
 |
Major Averages Quietly Edged Higher
Kenneth J. Gruneisen - Passed the CAN SLIM® Master's Exam
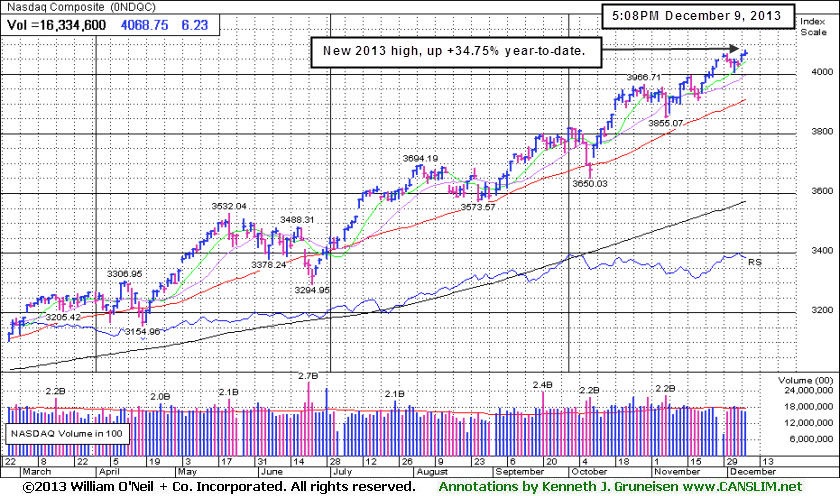
The Dow Jones Industrial Average gained 5 points to 16,025, the S&P 500 added 3 points for its best-ever close at 1,808 and the NASDAQ advanced 6 points with the index closing at 4,068. The volume totals were reported mixed, lighter on the Nasdaq exchange while volume was higher on the NYSE. Advancers led decliners by a 3-2 margin on the Nasdaq exchange while breadth was even on the NYSE. There were 56 high-ranked companies from the CANSLIM.net Leaders List that made new 52-week highs and appeared on the CANSLIM.net BreakOuts Page, down slightly from a total of 59 stocks on the prior session. The list of stocks hitting new 52-week highs outnumbered new lows on the Nasdaq exchange and also on the NYSE. There were gains for only 8 of the 18 high-ranked companies currently included on the Featured Stocks Page. That was discouraging action in that group of leading stocks versus the broader market's positive breadth.
Stocks traded in a narrow range throughout the session. Investors were cautious as Richmond regional Fed president Jeffrey Lacker said he expected stimulus tapering to be a topic of discussion during next week's FOMC meeting.
Most sectors on the S&P ended higher, led by gains in tech stocks. Shares of Apple Inc (AAPL -1.1%) and Facebook Inc (FB +1.9%) . Food distributor Sysco Corp (SYY +9.6%) rallied on news that the company was acquiring competitor US Foods. In other news, McDonald's Corp (MCD -1.1%) after the restaurant chain reported disappointing November sales data.
Turning to fixed income markets, Treasuries were modestly higher along the curve. The benchmark 10-year note was up 3/32 to yield 2.85% and the 30-year bond gained 9/32 to yield 3.87%.
The Market (M criteria) remains in a confirmed rally, however showing signs of distribution and waning leadership, yet the Dow and S&P 500 Index both remain perched near new all-time highs. As always, any new buying efforts should be selective. The CANSLIM.net Featured Stocks Page shows the most action-worthy candidates and their latest notes and a new Headline Link directs members to the latest detailed analysis with data-packed graphs annotated by a Certified expert along with links to additional resources. The Premium Member Homepage - includes "dynamic archives" to all prior pay reports published. Watch for an announcement via email concerning the next WEBCAST.
PICTURED: The Nasdaq Composite Index is up +34.75% year-to-date, hitting new 2013 highs.
|
 Kenneth J. Gruneisen started out as a licensed stockbroker in August 1987, a couple of months prior to the historic stock market crash that took the Dow Jones Industrial Average down -22.6% in a single day. He has published daily fact-based fundamental and technical analysis on high-ranked stocks online for two decades. Through FACTBASEDINVESTING.COM, Kenneth provides educational articles, news, market commentary, and other information regarding proven investment systems that work in good times and bad.
Comments contained in the body of this report are technical opinions only and are not necessarily those of Gruneisen Growth Corp. The material herein has been obtained from sources believed to be reliable and accurate, however, its accuracy and completeness cannot be guaranteed. Our firm, employees, and customers may effect transactions, including transactions contrary to any recommendation herein, or have positions in the securities mentioned herein or options with respect thereto. Any recommendation contained in this report may not be suitable for all investors and it is not to be deemed an offer or solicitation on our part with respect to the purchase or sale of any securities. |
|
 |
Industry Group Action Was Mixed and Mostly Quiet
Kenneth J. Gruneisen - Passed the CAN SLIM® Master's Exam
The Retail Index ($RLX -0.20%) and the Biotechnology Index ($BTK -0.32%) both had a slightly negative bias while the Semiconductor Index ($SOX +0.23%) and the Networking Index ($NWX +0.23%) posted small gains. The Bank Index ($BKX +0.27%) eked out a tiny gain while the Broker/Dealer Index ($XBD +0.02%) finished flat. The Oil Services Index ($OSX -0.42%) edged lower while the Integrated Oil Index ($XOI +0.00%) finished flat. The Gold & Silver Index ($XAU +2.08%) posted a solid gain.
Charts courtesy www.stockcharts.com
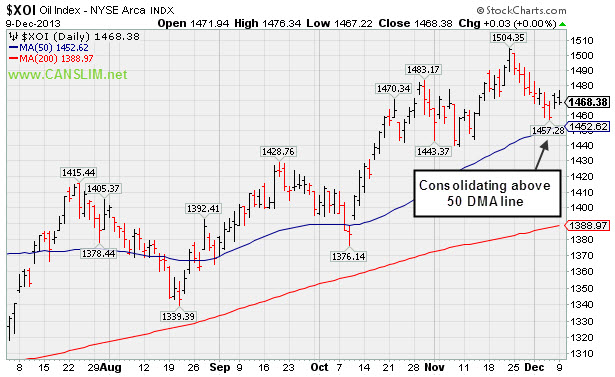
PICTURED: The Integrated Oil Index ($XOI +0.00%) finished flat, consolidating above its 50-day moving average (DMA) line.
| Oil Services |
$OSX |
276.47 |
-1.17 |
-0.42% |
+25.58% |
| Integrated Oil |
$XOI |
1,468.38 |
+0.03 |
+0.00% |
+18.24% |
| Semiconductor |
$SOX |
516.81 |
+1.18 |
+0.23% |
+34.56% |
| Networking |
$NWX |
311.89 |
+0.72 |
+0.23% |
+37.67% |
| Broker/Dealer |
$XBD |
154.28 |
+0.03 |
+0.02% |
+63.56% |
| Retail |
$RLX |
921.01 |
-1.81 |
-0.20% |
+41.03% |
| Gold & Silver |
$XAU |
82.48 |
+1.68 |
+2.08% |
-50.19% |
| Bank |
$BKX |
67.60 |
+0.18 |
+0.27% |
+31.83% |
| Biotech |
$BTK |
2,278.70 |
-7.31 |
-0.32% |
+47.30% |
|
|
|
 |
Extended From Base Yet May Produce More Climactic Gains
Kenneth J. Gruneisen - Passed the CAN SLIM® Master's Exam
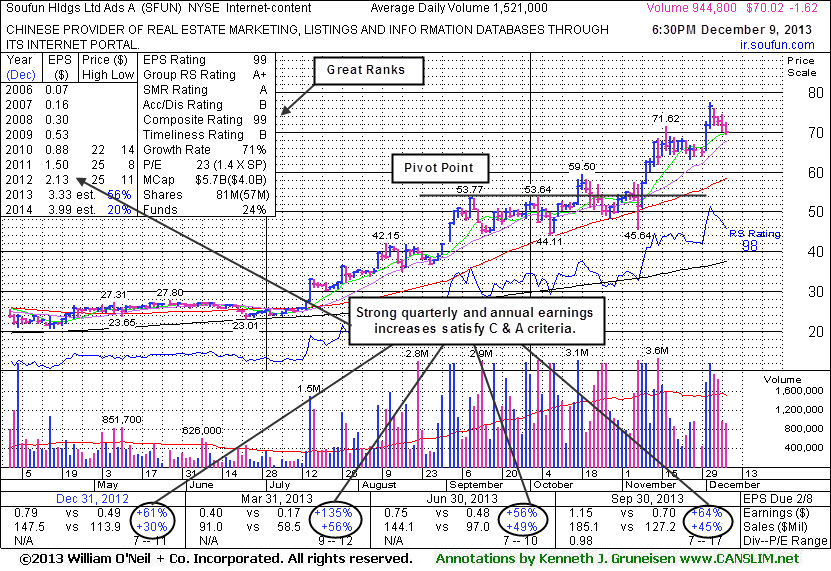
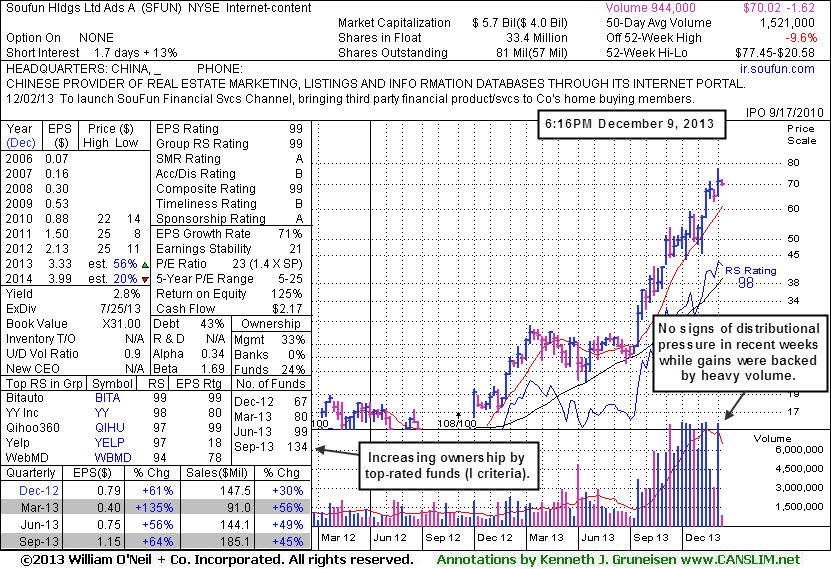
Soufun Hldgs Ltd Ads (SFUN -$1.62 or -2.26% to $70.02) is -9.6% off its all-time high after it pulled back for a 4th consecutive loss today with lighter volume, consolidating from its all-time high hit last week. It is extended from any sound base pattern yet may produce more climactic gains. Disciplined investors avoid chasing extended stocks. Prior highs and its 50-day moving average (DMA) line coincide in the $59 area defining important support to watch.
The high-ranked Internet - Content firm powered into new high territory since last shown in this FSU section on 11/08/13 with annotated graphs under the headline, "Perched Near All-Time High After Testing Support". It has rallied +182% since first featured in the 2/11/13 mid-day report in yellow (read here).
Fundamentals remain strong as it reported +64% earnings on +45% sales revenues for the Sep '13 quarter versus the year ago period, solidly satisfying the C criteria. The number of top-rated funds owning its shares rose from 67 in Sep '12 to 134 in Sep '13, a reassuring sign concerning the I criteria. Its small supply (S criteria) of only 33.4 million shares in the public float can contribute to greater price volatility in the event of institutional buying or selling.
|
|
|
Color Codes Explained :
Y - Better candidates highlighted by our
staff of experts.
G - Previously featured
in past reports as yellow but may no longer be buyable under the
guidelines.
***Last / Change / Volume data in this table is the closing quote data***
Symbol/Exchange
Company Name
Industry Group |
PRICE |
CHANGE
(%Change) |
Day High |
Volume
(% DAV)
(% 50 day avg vol) |
52 Wk Hi
% From Hi |
Featured
Date |
Price
Featured |
Pivot Featured |
|
Max Buy |
BITA
-
NYSE
Bitauto Hldgs Ltd Ads
INTERNET - Internet Information Providers
|
$28.54
|
+0.12
0.42% |
$28.85
|
1,499,730
123.32% of 50 DAV
50 DAV is 1,216,100
|
$35.04
-18.55%
|
9/24/2013
|
$16.40
|
PP = $17.31
|
|
MB = $18.18
|
Most Recent Note - 12/6/2013 3:53:46 PM
G - Priced a new Public Offering and it is down considerably today with heavy volume, now trading -19% off its 52-week high and slumping near its prior high in the $28 area defining initial support above its 50 DMA line.
>>> FEATURED STOCK ARTICLE : Consolidating After Getting Extended From Prior Base - 11/11/2013
View all notes |
Set NEW NOTE alert |
CANSLIM.net Company Profile |
SEC
News |
Chart |
Request a new note
C
A N
S L
I M


|
CELG
-
NASDAQ
Celgene Corp
DRUGS - Drug Manufacturers - Major
|
$170.01
|
+3.58
2.15% |
$173.80
|
5,024,548
176.11% of 50 DAV
50 DAV is 2,853,100
|
$167.25
1.65%
|
9/12/2013
|
$149.50
|
PP = $150.02
|
|
MB = $157.52
|
 Most Recent Note - 12/9/2013 12:16:30 PM
G - Gapped up hitting new 52-week and all-time highs with today's 4th consecutive gain, getting extended from prior highs in the $161 area defining initial support to watch on pullbacks. See the latest FSU analysis for more details and annotated daily and weekly graphs.
>>> FEATURED STOCK ARTICLE : Cooling Volume Totals While Hovering Near Highs - 12/4/2013
View all notes |
Set NEW NOTE alert |
CANSLIM.net Company Profile |
SEC
News |
Chart |
Request a new note
C
A N
S L
I M
|
EGOV
-
NASDAQ
N I C Inc
INTERNET - Internet Software and Services
|
$23.88
|
-0.15
-0.62% |
$24.10
|
156,518
53.53% of 50 DAV
50 DAV is 292,400
|
$25.99
-8.12%
|
10/18/2013
|
$25.17
|
PP = $23.66
|
|
MB = $24.84
|
Most Recent Note - 12/9/2013 7:09:23 PM
G - Still holding its ground stubbonrly, consolidating in a tight range just above its 50 DMA line. Disciplined investors always limit losses by selling any stock that falls more than -7% from their purchase price.
>>> FEATURED STOCK ARTICLE : Finding Support Near 50-Day Average During Distributional Pressure - 11/25/2013
View all notes |
Set NEW NOTE alert |
CANSLIM.net Company Profile |
SEC
News |
Chart |
Request a new note
C
A N
S L
I M
|
FLT
-
NYSE
Fleetcor Technologies
DIVERSIFIED SERVICES - Business/Management Services
|
$118.31
|
-0.42
-0.35% |
$119.72
|
985,018
115.45% of 50 DAV
50 DAV is 853,200
|
$123.96
-4.56%
|
8/19/2013
|
$99.01
|
PP = $100.97
|
|
MB = $106.02
|
Most Recent Note - 12/6/2013 12:51:13 PM
G - Gapped down today retreating from all-time highs, violating the previously noted steep upward trendline connecting its Oct-Nov lows defining initial support. Its 50 DMA line ($113.99 now) defines the next important near-term support level to watch.
>>> FEATURED STOCK ARTICLE : Perched Near All-Time High Tallying Quiet Gains - 11/13/2013
View all notes |
Set NEW NOTE alert |
CANSLIM.net Company Profile |
SEC
News |
Chart |
Request a new note
C
A N
S L
I M
|
GNRC
-
NYSE
Generac Hldgs Inc
CONSUMER DURABLES - Electronic Equipment
|
$53.44
|
+0.18
0.34% |
$53.50
|
411,952
49.39% of 50 DAV
50 DAV is 834,000
|
$53.74
-0.55%
|
11/26/2013
|
$53.02
|
PP = $52.42
|
|
MB = $55.04
|
Most Recent Note - 12/6/2013 4:32:10 PM
Y - Still perched at its 52-week high today, consolidating above prior highs in the $52 area defining initial support to watch after its 11/26/13 breakout from a short flat base with +59% above average volume triggered a new (or-add on) technical buy signal.
>>> FEATURED STOCK ARTICLE : Following Latest Breakout Prior Highs Define Support - 11/29/2013
View all notes |
Set NEW NOTE alert |
CANSLIM.net Company Profile |
SEC
News |
Chart |
Request a new note
C
A N
S L
I M
|
Symbol/Exchange
Company Name
Industry Group |
PRICE |
CHANGE
(%Change) |
Day High |
Volume
(% DAV)
(% 50 day avg vol) |
52 Wk Hi
% From Hi |
Featured
Date |
Price
Featured |
Pivot Featured |
|
Max Buy |
HLF
-
NYSE
Herbalife Ltd
DRUGS - Nutrition and Weight Management
|
$72.78
|
-0.08
-0.11% |
$74.02
|
1,732,649
66.06% of 50 DAV
50 DAV is 2,622,900
|
$77.39
-5.96%
|
11/22/2013
|
$72.21
|
PP = $75.04
|
|
MB = $78.79
|
Most Recent Note - 12/6/2013 3:55:26 PM
Y - Pulling back from its 52-week high with higher volume today indicative of distributional pressure. Volume-driven gains this week helped it rally above its pivot point to trigger a technical buy signal.
>>> FEATURED STOCK ARTICLE : Perched Near Highs Following Rebound - 11/22/2013
View all notes |
Set NEW NOTE alert |
CANSLIM.net Company Profile |
SEC
News |
Chart |
Request a new note
C
A N
S L
I M
|
JAZZ
-
NASDAQ
Jazz Pharmaceuticals Plc
DRUGS - Biotechnology
|
$117.13
|
+0.09
0.08% |
$117.81
|
1,154,516
149.59% of 50 DAV
50 DAV is 771,800
|
$118.80
-1.41%
|
9/30/2013
|
$93.20
|
PP = $89.10
|
|
MB = $93.56
|
Most Recent Note - 12/6/2013 4:13:53 PM
G - Still hovering near its 52-week high, stubbornly holding its ground while extended from any sound base. Prior notes reminded members - "Disciplined investors avoid chasing stocks more than +5% above prior highs and always limit losses by selling any stock that falls more than -7% from their purchase price."
>>> FEATURED STOCK ARTICLE : Hovering Near All-Time Highs Following Volume-Driven Gains - 11/7/2013
View all notes |
Set NEW NOTE alert |
CANSLIM.net Company Profile |
SEC
News |
Chart |
Request a new note
C
A N
S L
I M
|
KORS
-
NYSE
Michael Kors Hldgs Ltd
RETAIL - Apparel Stores
|
$80.61
|
+0.93
1.17% |
$80.98
|
2,777,944
61.80% of 50 DAV
50 DAV is 4,494,900
|
$83.13
-3.04%
|
8/6/2013
|
$69.66
|
PP = $66.28
|
|
MB = $69.59
|
Most Recent Note - 12/6/2013 5:58:00 PM
G - Pulled back on below average volume today. Prior highs in the $78 area define near-term support coinciding with its 50 DMA line. See the latest FSU analysis for more details and new annotated daily and weekly graphs.
>>> FEATURED STOCK ARTICLE : Consolidation Too Brief To Note New Pivot - 12/6/2013
View all notes |
Set NEW NOTE alert |
CANSLIM.net Company Profile |
SEC
News |
Chart |
Request a new note
C
A N
S L
I M
|
LOPE
-
NASDAQ
Grand Canyon Education
DIVERSIFIED SERVICES - Education and; Training Services
|
$43.91
|
-0.50
-1.13% |
$44.94
|
541,031
133.69% of 50 DAV
50 DAV is 404,700
|
$50.48
-13.02%
|
6/19/2013
|
$31.47
|
PP = $34.17
|
|
MB = $35.88
|
Most Recent Note - 12/3/2013 1:07:13 PM
G - Volume totals have been cooling while consolidating above its 50 DMA line defining near-term support. Repeatedly noted - "Fundamental concerns remain while technical action has been reassuring."
>>> FEATURED STOCK ARTICLE : Fundamental Concerns Noted While Consolidating Above 50-Day Moving Average - 11/26/2013
View all notes |
Set NEW NOTE alert |
CANSLIM.net Company Profile |
SEC
News |
Chart |
Request a new note
C
A N
S L
I M
|
NOAH
-
NYSE
Noah Holdings Ltd Ads
FINANCIAL SERVICES - Asset Management
|
$20.25
|
+0.16
0.80% |
$20.80
|
338,968
41.08% of 50 DAV
50 DAV is 825,100
|
$25.51
-20.62%
|
10/15/2013
|
$19.10
|
PP = $18.33
|
|
MB = $19.25
|
Most Recent Note - 12/3/2013 1:01:27 PM
G - Still consolidating above its 50 DMA line which acted as support throughout its choppy ascent. Previously noted with caution - "A violation may trigger a technical sell signal. Caution is called for after a worrisome 'negative reversal' occurred at its 52-week high, and it is extended from its latest base."
>>> FEATURED STOCK ARTICLE : 50-Day Average And Prior Highs Define Important Support - 11/20/2013
View all notes |
Set NEW NOTE alert |
CANSLIM.net Company Profile |
SEC
News |
Chart |
Request a new note
C
A N
S L
I M
|
Symbol/Exchange
Company Name
Industry Group |
PRICE |
CHANGE
(%Change) |
Day High |
Volume
(% DAV)
(% 50 day avg vol) |
52 Wk Hi
% From Hi |
Featured
Date |
Price
Featured |
Pivot Featured |
|
Max Buy |
PCLN
-
NASDAQ
Priceline.Com Inc
INTERNET - Internet Software and Services
|
$1,178.68
|
-1.72
-0.15% |
$1,187.00
|
482,357
75.22% of 50 DAV
50 DAV is 641,300
|
$1,198.75
-1.67%
|
9/13/2013
|
$966.82
|
PP = $995.08
|
|
MB = $1,044.83
|
Most Recent Note - 12/4/2013 7:14:03 PM
G - Hovering at its 52-week high with volume totals cooling. It may go on to produce more climactic gains but is currently extended from any sound base pattern. Reported earnings +40% on +33% sales revenues for the Sep '13 quarter versus the year-ago period, improving after a slightly sub par Jun '13 report.
>>> FEATURED STOCK ARTICLE : Extended From Any Sound Base Pattern - 12/3/2013
View all notes |
Set NEW NOTE alert |
CANSLIM.net Company Profile |
SEC
News |
Chart |
Request a new note
C
A N
S L
I M
|
SFUN
-
NYSE
Soufun Hldgs Ltd Ads A
INTERNET - Internet Information Providers
|
$70.02
|
-1.62
-2.26% |
$72.59
|
945,862
62.19% of 50 DAV
50 DAV is 1,521,000
|
$77.45
-9.59%
|
10/17/2013
|
$58.02
|
PP = $53.87
|
|
MB = $56.56
|
Most Recent Note - 12/9/2013 6:51:33 PM
G - Pulled back for a 4th consecutive loss today with lighter volume while consolidating from its all-time high hit last week. It is extended from any sound base pattern yet may produce more climactic gains. Prior highs and its 50 DMA line coincide in the $59 area defining important support to watch. See the latest FSU analysis for more details and annotated daily and weekly graphs.
>>> FEATURED STOCK ARTICLE : Extended From Base Yet May Produce More Climactic Gains - 12/9/2013
View all notes |
Set NEW NOTE alert |
CANSLIM.net Company Profile |
SEC
News |
Chart |
Request a new note
C
A N
S L
I M
|
SSNC
-
NASDAQ
S S & C Technologies
COMPUTER SOFTWARE and SERVICES - Application Software
|
$42.14
|
-0.35
-0.82% |
$42.75
|
179,412
57.71% of 50 DAV
50 DAV is 310,900
|
$43.80
-3.79%
|
10/22/2013
|
$39.17
|
PP = $40.04
|
|
MB = $42.04
|
Most Recent Note - 12/3/2013 1:15:54 PM
G - Slumping back near its "max buy" level with today's pullback on below average volume. Prior highs near $41 define initial support to watch above its 50 DMA line on pullbacks.
>>> FEATURED STOCK ARTICLE : Volume Totals Cooling Following Recent Volume-Driven Breakout - 11/12/2013
View all notes |
Set NEW NOTE alert |
CANSLIM.net Company Profile |
SEC
News |
Chart |
Request a new note
C
A N
S L
I M
|
SSYS
-
NASDAQ
Stratasys Ltd
COMPUTER HARDWARE - Computer Peripherals
|
$117.67
|
+0.67
0.57% |
$118.97
|
865,218
73.62% of 50 DAV
50 DAV is 1,175,200
|
$134.00
-12.19%
|
10/11/2013
|
$102.94
|
PP = $105.38
|
|
MB = $110.65
|
Most Recent Note - 12/6/2013 3:56:52 PM
G - Pulling back today with higher but below average volume while still consolidating well above support at its 50 DMA line. More damaging losses would raise greater concerns and trigger worrisome technical sell signals. Reported earnings +13% on +153% sales revenues, below the +25% minimum earnings guideline (C criteria) raising fundamental concerns.
>>> FEATURED STOCK ARTICLE : Rallying For New Highs Despite Fundamental Flaw Raising Concern - 11/18/2013
View all notes |
Set NEW NOTE alert |
CANSLIM.net Company Profile |
SEC
News |
Chart |
Request a new note
C
A N
S L
I M
|
STMP
-
NASDAQ
Stamps.Com Inc
INTERNET - Internet Software and Services
|
$42.94
|
-1.07
-2.43% |
$44.15
|
219,996
185.18% of 50 DAV
50 DAV is 118,800
|
$49.40
-13.08%
|
9/24/2013
|
$45.54
|
PP = $46.57
|
|
MB = $48.90
|
Most Recent Note - 12/9/2013 7:13:04 PM
Down today with above average volume while slumping further below its 50 DMA line and violating the previously noted upward trendline raising more serious concerns. It will be dropped from the Featured Stocks list tonight. Earnings were +24% on +7% sales revenues for the Sep '13 quarter, just below the +25% minimum earnings guideline (C criteria).
>>> FEATURED STOCK ARTICLE : Upward Trendline and 50-Day Average Define Important Near-Term Support - 12/2/2013
View all notes |
Set NEW NOTE alert |
CANSLIM.net Company Profile |
SEC
News |
Chart |
Request a new note
C
A N
S L
I M
|
Symbol/Exchange
Company Name
Industry Group |
PRICE |
CHANGE
(%Change) |
Day High |
Volume
(% DAV)
(% 50 day avg vol) |
52 Wk Hi
% From Hi |
Featured
Date |
Price
Featured |
Pivot Featured |
|
Max Buy |
ULTI
-
NASDAQ
Ultimate Software Group
INTERNET - Internet Software and Services
|
$153.70
|
-1.47
-0.95% |
$156.94
|
104,221
73.14% of 50 DAV
50 DAV is 142,500
|
$162.88
-5.64%
|
10/16/2013
|
$142.95
|
PP = $151.18
|
|
MB = $158.74
|
Most Recent Note - 12/4/2013 7:09:17 PM
Y - Prior highs and its 50 DMA line define near-term support near the $151 area. Finished near the session high after quietly testing its 50 DMA line today. Volume totals have been cooling while holding its ground near its 52-week high yet below its "max buy" level.
>>> FEATURED STOCK ARTICLE : Consolidating Above 50 DMA Line and Prior Highs Defining Support - 11/21/2013
View all notes |
Set NEW NOTE alert |
CANSLIM.net Company Profile |
SEC
News |
Chart |
Request a new note
C
A N
S L
I M
|
VRX
-
NYSE
Valeant Pharmaceuticals
DRUGS - Drug Manufacturers - Other
|
$107.97
|
+0.30
0.28% |
$108.63
|
1,026,917
91.20% of 50 DAV
50 DAV is 1,126,000
|
$115.40
-6.43%
|
9/11/2013
|
$100.26
|
PP = $105.50
|
|
MB = $110.78
|
Most Recent Note - 12/4/2013 7:06:40 PM
Y - Still consolidating in a very tight range near its 50 DMA line. Recent lows in the $102 area define near-term support where a violation may trigger a technical sell signal. Resilient after it reported earnings +24% on +74% sales revenues for the Sep '13 quarter, a notch below the +25% minimum guideline (C criteria).
>>> FEATURED STOCK ARTICLE : Recent Lows Define Support to Watch Below 50 Day Average - 11/15/2013
View all notes |
Set NEW NOTE alert |
CANSLIM.net Company Profile |
SEC
News |
Chart |
Request a new note
C
A N
S L
I M
|
YNDX
-
NASDAQ
Yandex N V Class A
INTERNET - Internet Information Providers
|
$39.84
|
-0.10
-0.25% |
$40.57
|
2,008,755
77.99% of 50 DAV
50 DAV is 2,575,500
|
$42.00
-5.14%
|
11/27/2013
|
$39.61
|
PP = $42.10
|
|
MB = $44.21
|
Most Recent Note - 12/6/2013 4:10:10 PM
Y - Reversed into the red today after challenging its 52-week high. Perched within close striking distance of its pivot point based on its 10/22/13 high plus 10 cents. Subsequent volume-driven gains above the pivot point may trigger a new (or add-on) technical buy signal.
>>> FEATURED STOCK ARTICLE : Forming New Base Pattern With Little Resistance Remaining - 11/27/2013
View all notes |
Set NEW NOTE alert |
CANSLIM.net Company Profile |
SEC
News |
Chart |
Request a new note
C
A N
S L
I M
|
|
|
|
THESE ARE NOT BUY RECOMMENDATIONS!
Comments contained in the body of this report are technical
opinions only. The material herein has been obtained
from sources believed to be reliable and accurate, however,
its accuracy and completeness cannot be guaranteed.
This site is not an investment advisor, hence it does
not endorse or recommend any securities or other investments.
Any recommendation contained in this report may not
be suitable for all investors and it is not to be deemed
an offer or solicitation on our part with respect to
the purchase or sale of any securities. All trademarks,
service marks and trade names appearing in this report
are the property of their respective owners, and are
likewise used for identification purposes only.
This report is a service available
only to active Paid Premium Members.
You may opt-out of receiving report notifications
at any time. Questions or comments may be submitted
by writing to Premium Membership Services 665 S.E. 10 Street, Suite 201 Deerfield Beach, FL 33441-5634 or by calling 1-800-965-8307
or 954-785-1121.
|
|
|

