You are not logged in.
This means you
CAN ONLY VIEW reports that were published prior to Monday, April 14, 2025.
You
MUST UPGRADE YOUR MEMBERSHIP if you want to see any current reports.
AFTER MARKET UPDATE - WEDNESDAY, DECEMBER 9TH, 2009
Previous After Market Report Next After Market Report >>>
|
|
|
|
DOW |
+51.08 |
10,337.05 |
+0.50% |
|
Volume |
1,082,561,400 |
-8% |
|
Volume |
1,947,005,840 |
-5% |
|
NASDAQ |
+10.74 |
2,183.73 |
+0.49% |
|
Advancers |
1,646 |
53% |
|
Advancers |
1,353 |
48% |
|
S&P 500 |
+4.01 |
1,095.95 |
+0.37% |
|
Decliners |
1,346 |
43% |
|
Decliners |
1,342 |
47% |
|
Russell 2000 |
+0.33 |
598.03 |
+0.06% |
|
52 Wk Highs |
113 |
|
|
52 Wk Highs |
45 |
|
|
S&P 600 |
+0.10 |
315.64 |
+0.03% |
|
52 Wk Lows |
7 |
|
|
52 Wk Lows |
21 |
|
|
 |
Volume Totals Lighter As Late Afternoon Rally Help Indices Post Gains
Adam Sarhan, Contributing Writer,
The major averages ended higher thanks in part to a late day decline in the US dollar. Volume, an important indicator of institutional sponsorship, was lower than Tuesday's levels on both major exchanges which signaled that large institutions were not aggressively buying stocks. Advancers led decliners by a narrow 8-to-7 ratio on the NYSE and the mix was about even on the Nasdaq exchange. There were 13 high-ranked companies from the CANSLIM.net Leaders List that made a new 52-week high and appeared on the CANSLIM.net BreakOuts Page, less than the total of 18 issues that appeared on the prior session. New 52-week highs outnumbered new 52-week lows on the NYSE and on the Nasdaq exchange.
Stocks were under pressure for most of the session after disconcerting economic data hit the wires from across the globe. In Asia, Japan's government said that the world's second largest economy grew at a +1.3% annualized rate last quarter which was way below the +4.8% reported last month. The sharp downward revision caught nearly everyone off guard and sparked concern that a double dip recession is likely. In Europe, Standard & Poor's lowered Spain's credit outlook to "negative" and said they were concerned with the country's slow economy and massive deficit spending. This occurred one day after a separate rating agency downgraded Greece's credit rating. Stocks in Greece plunged -12% this week as investors scramble to move into "safer" assets.
Perceived Safety: The US dollar has rallied for most of the week which has put pressure on dollar denominated assets- mainly stocks and commodities. Crude oil plunged, as the dollar edged higher, and hit a fresh two-month low of $73.05 a barrel in New York. The government released a bearish report which showed that US fuel inventories rose as refineries increased operating rates. The report also showed that gasoline stockpiles rose to 2.25 million barrels. Elsewhere, gold continued its week long decline but it was encouraging to see gold equities rally on Wednesday. Gold bulls were happy to see this subtle, yet important, divergence.
Bailout Extended: The bulls cheered after the Obama administration announced that it would extended the $700 billion financial bailout program until October 2010 to help stimulate the economy. This helped offset concerns that that government would prematurely withdraw its support and that would adversely affect the global economy. In addition, many people were concerned that if that were to occur than that could be a major catalyst in the possibility of a double dip recession. At this point, government's across the world are reaffirming their stance and supporting their stimulus packages.
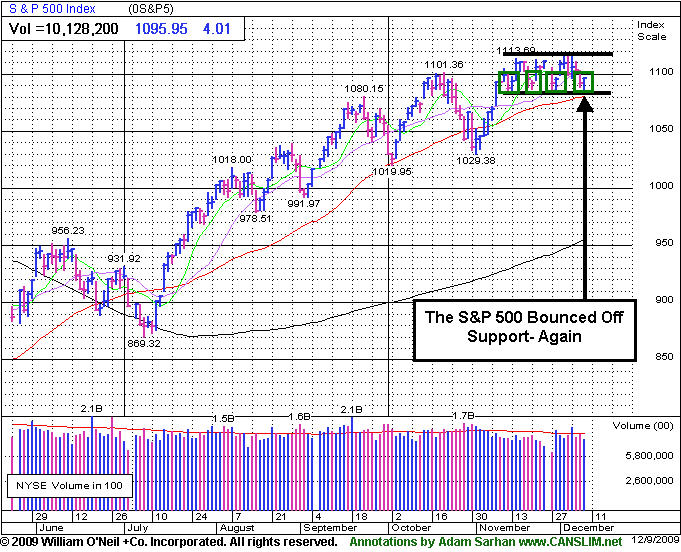
Price and Volume: Around 2PM EST the greenback started to fall and US stocks started to rally. Apple Inc. (AAPL +4.18%) vaulted +$7.66 and closed above its 50-day moving average (DMA) line on above average volume. Apple has been a strong leader since the March lows and the fact that it quickly repaired the recent damage is a bullish sign for this rally. A new crop of high-ranked stocks are currently working on new bases as the major averages continue consolidating their recent move above their respective 50 DMA lines. The bulls deserve the bullish benefit of the doubt until the major averages close below their respective 50 DMA lines.
PICTURED: The S&P 500 Index bounced off support again.
|
|
|
 |
XAU Snaps 4-Day Losing Streak
Kenneth J. Gruneisen - Passed the CAN SLIM® Master's Exam
The Gold & Silver Index ($XAU +2.64%) snapped a 4-day losing streak with a big gain, and other defensive groups also posted modest gains as the Oil Services Index ($OSX +0.87%) and Healthcare Index ($HMO +0.48%) rose. While the Retail Index ($RLX -0.72%) created a drag on the major averages, a modest gain from the Broker/Dealer Index ($XBD +0.48%) and tech sector gains helped offset other weakness. The Semiconductor Index ($SOX +0.63%), Internet Index ($IIX +0.54%), and Biotechnology Index ($BTK +0.47%) posted modest gains. Meanwhile the Bank Index ($BKX +0.07%), Integrated Oil Index ($XOI -0.03%), and Networking Index ($NWX +0.02%) ended virtually unchanged.
Charts courtesy www.stockcharts.com
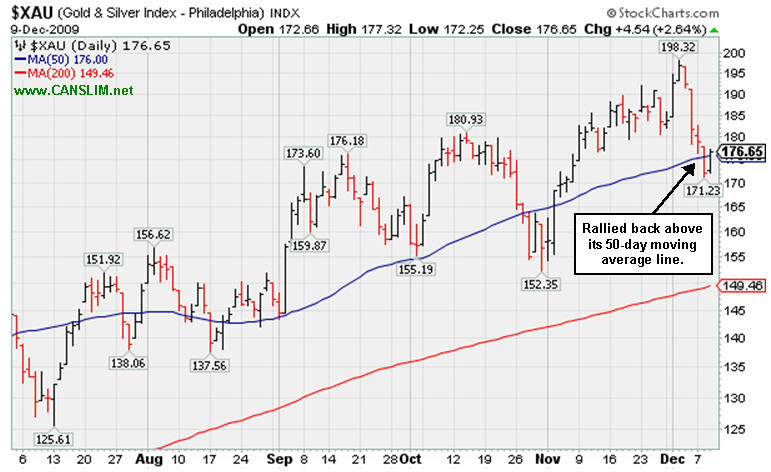
PICTURED: The Gold & Silver Index ($XAU +2.64%) rallied back above its 50-day moving average line, halting a steep 4-day slide.
| Oil Services |
$OSX |
182.65 |
+1.58 |
+0.87% |
+50.47% |
| Healthcare |
$HMO |
1,379.15 |
+6.56 |
+0.48% |
+43.63% |
| Integrated Oil |
$XOI |
1,043.01 |
-0.30 |
-0.03% |
+6.46% |
| Semiconductor |
$SOX |
339.09 |
+2.13 |
+0.63% |
+59.82% |
| Networking |
$NWX |
228.70 |
+0.04 |
+0.02% |
+58.94% |
| Internet |
$IIX |
227.35 |
+1.22 |
+0.54% |
+69.96% |
| Broker/Dealer |
$XBD |
112.94 |
+0.54 |
+0.48% |
+45.79% |
| Retail |
$RLX |
401.19 |
-2.89 |
-0.72% |
+43.66% |
| Gold & Silver |
$XAU |
176.65 |
+4.54 |
+2.64% |
+42.63% |
| Bank |
$BKX |
43.52 |
+0.03 |
+0.07% |
-1.81% |
| Biotech |
$BTK |
909.07 |
+4.25 |
+0.47% |
+40.47% |
|
|
|
 |
Base Building Continues For Baidu.com
Kenneth J. Gruneisen - Passed the CAN SLIM® Master's Exam
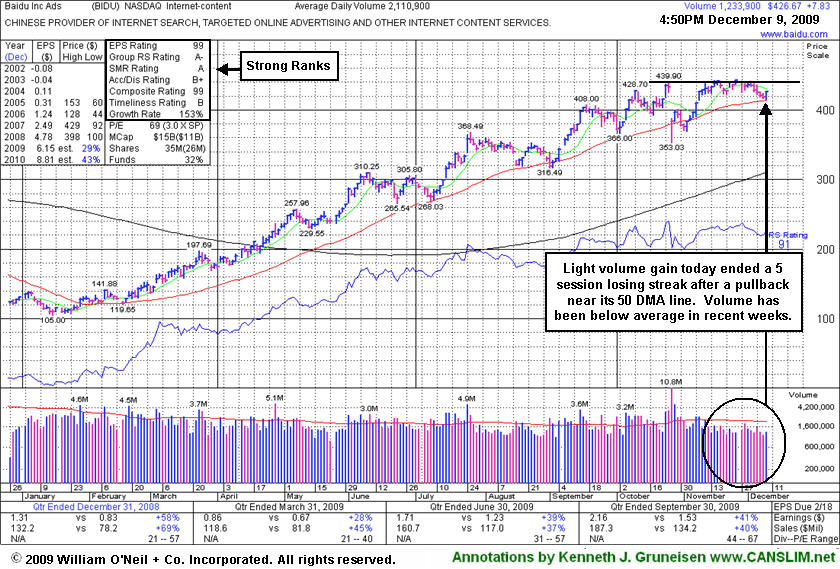
Baidu.com, Inc. (BIDU +$7.62 or +1.82% to $426.46) overcame early weakness today, posting a gain and closing at the session high while breaking a 5 session losing streak. The number of top-rated funds owning BIDU's shares rose from 103 in Dec '08 to 169 in Sep '09, clear evidence its shares were being accumulated by the institutional (I criteria) crowd. Technically, it has built a sloppy base over nearly 7 weeks while consolidating in a tight trading range near all-time highs as its 50-day moving average (DMA) line has caught up. Since quietly rallying to new highs in November, this Chinese provider of Internet search and content services has stalled. Its color code is changed to yellow again with new pivot point cited based upon its 10/26/09 high plus 10 cents. Gains above its pivot point, or to new high ground, with at least +50% above average volume would be considered a new bullish technical buy signal. Meanwhile, any deterioration below its 50 DMA line would raise concerns and hurt its outlook, while it could continue base-building for a longer period. Patience is important because without convincing gains leading to a fresh breakout there is little assurance it can sustain a meaningful rally higher. Even a powerful breakout might be risky to trade after its 4-fold ascent this year, its recent action could be "late-stage" and more failure prone.
BIDU proved resilient near its 50 DMA line after its 10/27/09 gap down, and it was a sign of great institutional support, making a stand near its important short-term average line. Technically it traded a little bit above the prior chart high of $439.90 following the considerable gap down on earnings news, as it clawed its way to new all-time highs on lighter than average volume, leaving questions as to how much appetite the large investors had for accumulating a greater ownership interest in the high-ranked. The last appearance in this FSU section on 11/25/09 included an annotated graph illustrating its "wedging" action under the headline "Wedging To New Highs With Light Volume Behind Gains."
BIDU traded up as much as +23% from its price when featured in yellow in the 9/08/09 Mid-Day BreakOuts Report (read here). In this FSU section on 9/21/09 we summarized more extensive prior coverage this currently Featured Stock has received (read here).
|
|
|
Color Codes Explained :
Y - Better candidates highlighted by our
staff of experts.
G - Previously featured
in past reports as yellow but may no longer be buyable under the
guidelines.
***Last / Change / Volume quote data in this table corresponds with the timestamp on the note***
Symbol/Exchange
Company Name
Industry Group |
Last |
Chg. |
Vol
% DAV |
Date Featured |
Price Featured |
Latest Pivot Point
Featured |
Status |
| Latest Max Buy Price |
ARST
-
|
$23.02
|
-0.39
|
525,527
93% DAV
564,800
|
9/1/2009
(Date
Featured) |
$19.91
(Price
Featured) |
PP = $20.90 |
G |
| MB = $21.95 |
Most Recent Note - 12/9/2009 5:48:16 PM
G - Down today for a 3rd consecutive loss on near average or light volume, sinking further below its 50 DMA line toward recent lows. It proved resilient last week after recently noted technical sell signals. ARST was first featured in yellow at $19.91 in the 9/01/09 mid-day report with an annotated daily graph (read here).
>>> The latest Featured Stock Update with an annotated graph appeared on 12/3/2009. click here.
|
|
C
A
S
I |
News |
Chart |
SEC
View all notes Alert
me of new notes
Company
Profile
|
ASIA
-
|
$30.55
|
-0.32
|
1,595,807
123% DAV
1,296,400
|
10/14/2009
(Date
Featured) |
$23.05
(Price
Featured) |
PP = $22.19 |
G |
| MB = $23.30 |
Most Recent Note - 12/9/2009 5:50:05 PM
G - Holding is ground today while perched near its 52 week high after a gap up for a considerable gain on 12/07/09 with almost 8 times average volume on news it will merge with Linkage Technologies International Holdings Limited, leading providers of software solutions and IT services for the telecommunications industry in China. Featured 10/14/09 in the mid-day report (read here) as it gapped up for a new 52-week high with 5 times average volume, triggering a technical buy signal by blasting above its pivot point. First featured in the August 2009 CANSLIM.net News (read here).
>>> The latest Featured Stock Update with an annotated graph appeared on 12/7/2009. click here.
|
|
C
A
S
I |
News |
Chart |
SEC
View all notes Alert
me of new notes
Company
Profile
|
BIDU
- NASDAQ
Baidu Inc Ads
INTERNET - Internet Information Providers
|
$426.46
|
+7.62
|
1,236,565
59% DAV
2,110,900
|
9/8/2009
(Date
Featured) |
$351.80
(Price
Featured) |
PP = $440.00 |
Y |
| MB = $462.00 |
Most Recent Note - 12/9/2009 5:57:45 PM
Y - Gain today halted a 5 session losing streak. While consolidating in a tight trading range near all-time highs its 50 DMA line has caught up. Color code is changed to yellow with new pivot point cited. Technically, it has built a sloppy base over nearly 7 weeks while consolidating in a tight trading range near all-time highs as its 50-day moving average (DMA) line has caught up. Since quietly rallying to new highs in November it has stalled. BIDU traded up as much as +23% from its price when featured in yellow in the 9/08/09 Mid-Day BreakOuts Report (read here).
>>> The latest Featured Stock Update with an annotated graph appeared on 12/9/2009. click here.
|
|
C
A
S
I |
News |
Chart |
SEC
View all notes Alert
me of new notes
Company
Profile
|
CAAS
- NASDAQ
China Automotive Systems
AUTOMOTIVE - Auto Parts
|
$20.61
|
-0.01
|
480,459
85% DAV
562,300
|
11/30/2009
(Date
Featured) |
$18.84
(Price
Featured) |
PP = $17.62 |
G |
| MB = $18.50 |
Most Recent Note - 12/9/2009 5:59:22 PM
G - Held its ground today after a positive reversal on 12/08/09 for a solid gain with above average volume. It is extended from a sound base under the investment system rules. The Chinese maker of power steering systems was rising from an advanced "3-weeks tight" type of chart pattern as it showed up in yellow in the 11/30/09 mid-day report (read here). Recent quarters show accelerating sales revenues and earnings increases, and it has a good annual earnings history.
>>> The latest Featured Stock Update with an annotated graph appeared on 11/30/2009. click here.
|
|
C
A
S
I |
News |
Chart |
SEC
View all notes Alert
me of new notes
Company
Profile
|
CACC
- NASDAQ
Credit Acceptance Corp
FINANCIAL SERVICES - Credit Services
|
$34.56
|
+0.49
|
24,770
69% DAV
35,700
|
9/29/2009
(Date
Featured) |
$33.48
(Price
Featured) |
PP = $37.10 |
Y |
| MB = $38.96 |
Most Recent Note - 12/9/2009 6:00:43 PM
Y - Consolidating quietly near its 50 DMA line, showing some resilience near that important short-term average line after encountering distributional pressure last week. After a near 8-week flat base it is continuing its consolidation above prior chart highs in the $32 area. The Finance - Consumer/Commercial Loans firm has maintained a great track record of annual and quarterly sales revenues and earnings increases. It was featured on 9/29/09 in yellow in the mid-day report (read here).
>>> The latest Featured Stock Update with an annotated graph appeared on 11/27/2009. click here.
|
|
C
A
S
I |
News |
Chart |
SEC
View all notes Alert
me of new notes
Company
Profile
|
CRM
- NYSE
Salesforce.com Inc
INTERNET - Internet Software & Services
|
$63.77
|
-0.37
|
1,149,026
70% DAV
1,630,900
|
8/16/2009
(Date
Featured) |
$47.12
(Price
Featured) |
PP = $45.59 |
G |
| MB = $47.87 |
Most Recent Note - 12/9/2009 6:02:33 PM
G - Down today for a third consecutive loss on light to average volume. Recently consolidating above important support at its 50 DMA line and just -5% from its 52 week high. It has not yet formed a sound new base, and recent distributional pressure raised concerns.
>>> The latest Featured Stock Update with an annotated graph appeared on 12/8/2009. click here.
|
|
C
A
S
I |
News |
Chart |
SEC
View all notes Alert
me of new notes
Company
Profile
|
CTRP
- NASDAQ
Ctrip.com Intl Ltd Adr
LEISURE - Resorts & Casinos
|
$73.10
|
-1.78
|
919,553
84% DAV
1,091,400
|
12/1/2009
(Date
Featured) |
$75.38
(Price
Featured) |
PP = $73.91 |
Y |
| MB = $77.61 |
Most Recent Note - 12/9/2009 6:04:56 PM
Y - Loss today on light volume, closing slightly below its pivot point. Encountered some distributional pressure last week when briefly trading above its "max buy" price of $77.60. Featured on 12/01/09 in yellow in the mid-day report (read here). It triggered a technical buy signal as it rose with more than +50% above average volume from a brief consolidation resembling a "high-tight-flag" pattern which it formed after repairing a late-October breach of its 50 DMA line. Fundamentally, its sales revenues and earnings increases have shown acceleration in the 3 most recent quarterly comparisons and rose above the +25% guideline. Based on weak technical action it was dropped from the Featured Stocks list on 6/10/08, when it closed at $49.84, yet it has rebounded very impressively from subsequent lows in the $16 area.
>>> The latest Featured Stock Update with an annotated graph appeared on 12/1/2009. click here.
|
|
C
A
S
I |
News |
Chart |
SEC
View all notes Alert
me of new notes
Company
Profile
|
HEAT
-
|
$15.08
|
+0.27
|
1,170,926
145% DAV
808,100
|
11/17/2009
(Date
Featured) |
$12.00
(Price
Featured) |
PP = $12.61 |
G |
| MB = $13.24 |
Most Recent Note - 12/9/2009 6:07:02 PM
G - Higher volume and lack of meaningful progress in the past week is a sign of distributional pressure, where plenty of selling is offsetting recent buying demand. The investment system rules say a stock should be held a minimum of 8 weeks after rising more than +20% in the first 2-3 weeks from being bought. HEAT found support near its pivot point during its recent consolidation, giving investors an opportunity to accumulate shares without chasing it and buying it "extended" from its latest base. First featured in yellow in the 11/17/09 mid-day report (read here) when technically rising from a "double bottom" base, reaching a new all-time high.
>>> The latest Featured Stock Update with an annotated graph appeared on 12/2/2009. click here.
|
|
C
A
S
I |
News |
Chart |
SEC
View all notes Alert
me of new notes
Company
Profile
|
LFT
-
|
$35.70
|
-0.64
|
339,431
75% DAV
453,100
|
11/17/2009
(Date
Featured) |
$31.77
(Price
Featured) |
PP = $33.04 |
G |
| MB = $34.69 |
Most Recent Note - 12/9/2009 6:09:41 PM
G - Today was its 3rd consecutive loss on light volume while still quietly perched near all-time highs. It remains a bit extended after recently rising from a choppy 14-week base. Prior chart highs in the $31 area are an initial support level to watch. A proposed offering of additional shares on 11/16/09 seems well received by the market. Its fundamentals remain strong.
>>> The latest Featured Stock Update with an annotated graph appeared on 12/4/2009. click here.
|
|
C
A
S
I |
News |
Chart |
SEC
View all notes Alert
me of new notes
Company
Profile
|
|
|
|
THESE ARE NOT BUY RECOMMENDATIONS!
Comments contained in the body of this report are technical
opinions only. The material herein has been obtained
from sources believed to be reliable and accurate, however,
its accuracy and completeness cannot be guaranteed.
This site is not an investment advisor, hence it does
not endorse or recommend any securities or other investments.
Any recommendation contained in this report may not
be suitable for all investors and it is not to be deemed
an offer or solicitation on our part with respect to
the purchase or sale of any securities. All trademarks,
service marks and trade names appearing in this report
are the property of their respective owners, and are
likewise used for identification purposes only.
This report is a service available
only to active Paid Premium Members.
You may opt-out of receiving report notifications
at any time. Questions or comments may be submitted
by writing to Premium Membership Services 665 S.E. 10 Street, Suite 201 Deerfield Beach, FL 33441-5634 or by calling 1-800-965-8307
or 954-785-1121.
|
|
|


