You are not logged in.
This means you
CAN ONLY VIEW reports that were published prior to Monday, April 14, 2025.
You
MUST UPGRADE YOUR MEMBERSHIP if you want to see any current reports.
AFTER MARKET UPDATE - FRIDAY, DECEMBER 7TH, 2012
Previous After Market Report Next After Market Report >>>
|
|
|
|
DOW |
+81.09 |
13,155.13 |
+0.62% |
|
Volume |
606,319,330 |
-2% |
|
Volume |
1,567,218,220 |
-5% |
|
NASDAQ |
-11.23 |
2,978.04 |
-0.38% |
|
Advancers |
1,649 |
52% |
|
Advancers |
1,142 |
44% |
|
S&P 500 |
+4.13 |
1,418.07 |
+0.29% |
|
Decliners |
1,358 |
43% |
|
Decliners |
1,300 |
51% |
|
Russell 2000 |
+0.48 |
822.27 |
+0.06% |
|
52 Wk Highs |
73 |
|
|
52 Wk Highs |
50 |
|
|
S&P 600 |
+0.13 |
462.14 |
+0.03% |
|
52 Wk Lows |
21 |
|
|
52 Wk Lows |
29 |
|
|
 |
Dow and S&P 500 Rise Above 50-Day Averages Major Average Lines
Kenneth J. Gruneisen - Passed the CAN SLIM® Master's Exam
On the week, the Dow Jones Industrial Average was up +1% the S&P 500 Index ended unchanged, and the Nasdaq Composite Index lost -1%. The indices were mixed on Friday's session. The volume totals were reported lighter than the prior session on the Nasdaq exchange and on the NYSE, revealing a lack of conviction from the institutional crowd. Advancing shares led decliners by an 8-7 margin on the NYSE, meanwhile decliners led advancers by a similar margin on the Nasdaq exchange. The total number of stocks hitting new 52-week highs outnumbered new 52-week lows on the NYSE and also on the Nasdaq exchange. There were 24 high-ranked companies from the CANSLIM.net Leaders List making new 52-week highs and appearing on the CANSLIM.net BreakOuts Page, one better than the prior session total of 23 stocks. Any sustainable rally requires a healthy crop of companies hitting new 52-week highs, so it is important for leadership to remain present. There were gains for 4 of the 10 high-ranked companies currently included on the Featured Stocks Page.
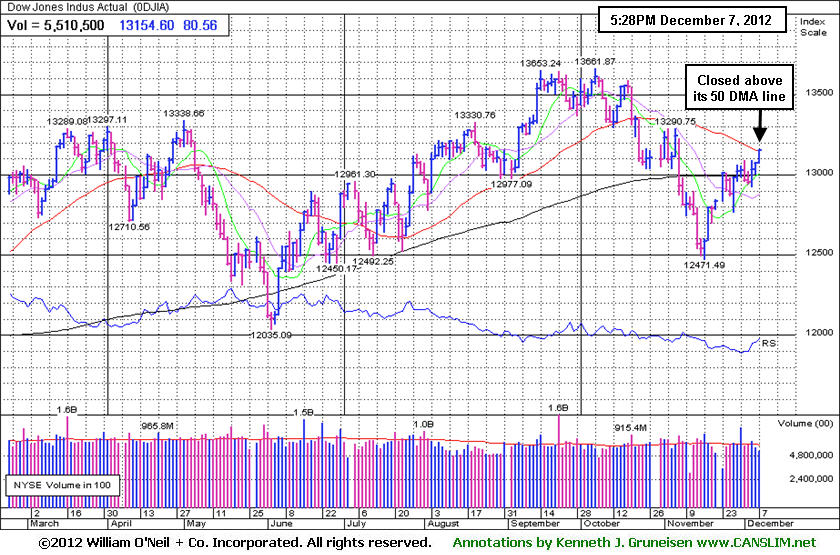
The Dow Jones Industrial Average and the S&P 500 Index rallied enough on Friday to finish the week above their respective 50-day moving average (DMA) lines. Meanwhile, the Nasdaq Composite Index has encountered resistance at its 50 DMA line.
A monthly employment update was offset by a weak consumer report. The U.S. unexpectedly picked up the pace of hiring in November as non-farm payrolls rose 146,000 and the unemployment rate dropped to its lowest level since December 2008. However, the University of Michigan preliminary consumer sentiment index fell to the weakest level in four months in December. Meanwhile, the stalemate in Washington continues after House Speaker Boehner said no progress has been made to avert the fiscal cliff.
Losses in telecommunication and technology shares weighed on markets as Apple Inc (AAPL -2.56%) continued to sputter, weighing negatively on the tech-heavy Nasdaq Composite Index. However, gains in materials helped limit losses, led by Freeport-McMoRan Copper & Gold Inc (FCX +2.89%). Financials also gained ground including JP Morgan Chase & Co (JPM +2.63%).
The market direction (M criteria) is currently a "confirmed uptrend" and new buying efforts may be justified only in worthy high-ranked leaders. See the noteworthy companies included on the Featured Stocks Page.
Watch for an announcement via email concerning the next WEBCAST. The webcast will also be available via an updated link highlighted at the top of the Premium Member Homepage.
PICTURED: The Dow Jones Industrial Average rallied to a finish above its 50-day moving average (DMA) line.
|
 Kenneth J. Gruneisen started out as a licensed stockbroker in August 1987, a couple of months prior to the historic stock market crash that took the Dow Jones Industrial Average down -22.6% in a single day. He has published daily fact-based fundamental and technical analysis on high-ranked stocks online for two decades. Through FACTBASEDINVESTING.COM, Kenneth provides educational articles, news, market commentary, and other information regarding proven investment systems that work in good times and bad.
Comments contained in the body of this report are technical opinions only and are not necessarily those of Gruneisen Growth Corp. The material herein has been obtained from sources believed to be reliable and accurate, however, its accuracy and completeness cannot be guaranteed. Our firm, employees, and customers may effect transactions, including transactions contrary to any recommendation herein, or have positions in the securities mentioned herein or options with respect thereto. Any recommendation contained in this report may not be suitable for all investors and it is not to be deemed an offer or solicitation on our part with respect to the purchase or sale of any securities. |
|
 |
Defensive, Financial, and Energy-Related Groups Led Gainers
Kenneth J. Gruneisen - Passed the CAN SLIM® Master's Exam
Defensive groups led Friday's gainers as the Healthcare Index ($HMO +1.60%) and Gold & Silver Index ($XAU +0.91%) traded higher. Financial shares were a positive influence on the major averages as the Broker/Dealer Index ($XBD +0.51%) and the Bank Index ($BKX +1.11%) tallied gains. Energy-related shares warmed up as the Integrated Oil Index ($XOI +0.84%) and the Oil Services Index ($OSX +0.50%) rose. The Semiconductor Index ($SOX +0.22%) and Biotechnology Index ($BTK +0.22%) had a slightly positive bias while the Retail Index ($RLX -0.03%), Networking Index ($NWX -0.09%), and Internet Index ($IIX +0.01%) finished virtually unchanged.
Charts courtesy www.stockcharts.com
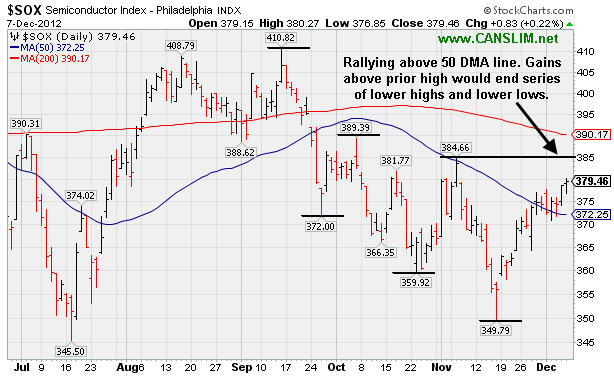
PICTURED: The Semiconductor Index ($SOX +0.22%) is rallying above its 50-day moving average (DMA) line, Gains above its prior highs would end a multi-month series of lower highs and lower lows.
| Oil Services |
$OSX |
221.66 |
+1.10 |
+0.50% |
+2.49% |
| Healthcare |
$HMO |
2,531.34 |
+39.96 |
+1.60% |
+10.95% |
| Integrated Oil |
$XOI |
1,225.67 |
+10.16 |
+0.84% |
-0.28% |
| Semiconductor |
$SOX |
379.46 |
+0.83 |
+0.22% |
+4.12% |
| Networking |
$NWX |
213.10 |
-0.20 |
-0.09% |
-0.96% |
| Internet |
$IIX |
321.73 |
+0.05 |
+0.01% |
+14.19% |
| Broker/Dealer |
$XBD |
87.81 |
+0.45 |
+0.51% |
+5.45% |
| Retail |
$RLX |
666.60 |
-0.18 |
-0.03% |
+27.41% |
| Gold & Silver |
$XAU |
162.08 |
+1.46 |
+0.91% |
-10.27% |
| Bank |
$BKX |
49.33 |
+0.54 |
+1.11% |
+25.27% |
| Biotech |
$BTK |
1,526.71 |
+3.39 |
+0.22% |
+39.88% |
|
|
|
 |
Perched Near New Pivot Point
Kenneth J. Gruneisen - Passed the CAN SLIM® Master's Exam
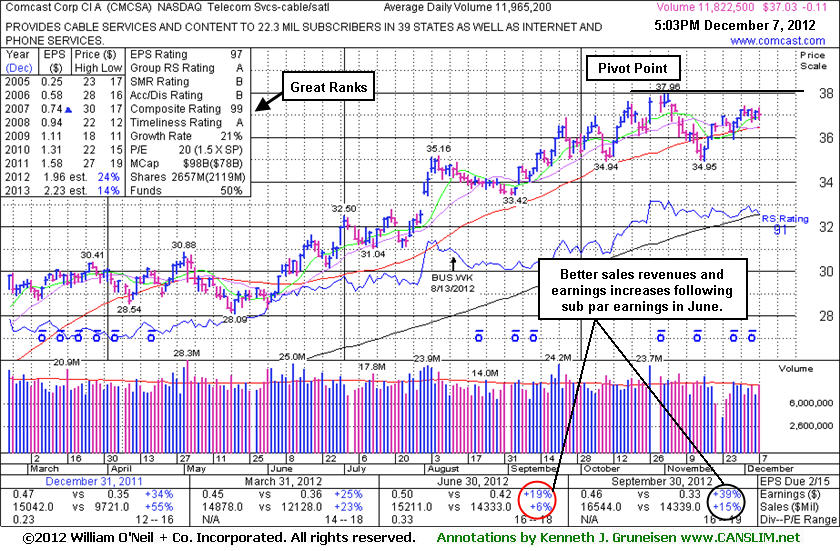
Comcast Corp Cl A (CMCSA -$0.11 or -0.30% to $37.03) is perched within close striking distance of its 52-week high with very little resistance remaining due to overhead supply. Subsequent volume-driven gains above the pivot point may trigger a new (or add-on) technical buy signal. Disciplined investors would have the patience to watch for a fresh breakout before considering any new buying efforts. Recently its color code was changed to yellow with new pivot point cited based on its 11/02/12 high plus 10 cents while currently building on a short flat base. It was last shown in this FSU section on 11/19/12 with an annotated graph under the headline, "September Quarter Showed Stronger Earnings and Sales Increases". It reported earnings +39% on +15% sales revenues for the Sep '12 quarter, above the fact-based investment system's +25% minimum guideline for the C criteria, a reassuring follow-up to the previously noted sub par quarter.
It has earned high ranks. Its annual earnings (A criteria) history has been strong and leadership from other firms in the Telecom Services - Cable/Satellite industry group is a reassuring sign concerning the L criteria. The number of top-rated funds owning its shares rose from 1,916 in Jun '11 to 2,208 in Sep '12, a reassuring sign concerning the I criteria. Its huge supply of 2.097 billion shares in the float could make it less likely to be a great sprinter, meanwhile, the S criteria calls for investors to usually look at small-cap or mid-cap companies.
|
|
|
Color Codes Explained :
Y - Better candidates highlighted by our
staff of experts.
G - Previously featured
in past reports as yellow but may no longer be buyable under the
guidelines.
***Last / Change / Volume data in this table is the closing quote data***
Symbol/Exchange
Company Name
Industry Group |
PRICE |
CHANGE
(%Change) |
Day High |
Volume
(% DAV)
(% 50 day avg vol) |
52 Wk Hi
% From Hi |
Featured
Date |
Price
Featured |
Pivot Featured |
|
Max Buy |
CFNL
-
NASDAQ
Cardinal Financial Corp
BANKING - Regional - Southeast Banks
|
$15.72
|
+0.16
1.03% |
$15.79
|
109,851
56.39% of 50 DAV
50 DAV is 194,800
|
$16.21
-3.02%
|
12/3/2012
|
$15.20
|
PP = $16.31
|
|
MB = $17.13
|
Most Recent Note - 12/6/2012 3:49:22 PM
Y - Color code was changed to yellow with a new pivot point cited based on its 11/06/12 high while still building on a short base-on-base pattern. Recent low and its 50 DMA line define near-term chart support where violations may trigger technical sell signals. Volume-driven gains above its pivot point may trigger a new (or add-on) technical buy signal.
>>> The latest Featured Stock Update with an annotated graph appeared on 11/20/2012. Click here.
View all notes |
Alert me of new notes |
CANSLIM.net Company Profile |
SEC |
Zacks Reports |
StockTalk |
News |
Chart |
Request a new note
C
A N
S L
I M


|
CMCSA
-
NASDAQ
Comcast Corp Cl A
MEDIA - CATV Systems
|
$37.03
|
-0.11
-0.30% |
$37.33
|
11,822,563
98.81% of 50 DAV
50 DAV is 11,965,200
|
$37.96
-2.45%
|
12/3/2012
|
$37.08
|
PP = $38.06
|
|
MB = $39.96
|
 Most Recent Note - 12/7/2012 5:37:35 PM
Y - Perched -2.5% off its 52-week high. Subsequent volume-driven gains above the pivot point may trigger a new (or add-on) technical buy signal. See the latest FSU analysis for more details and a new annotated graph.
>>> The latest Featured Stock Update with an annotated graph appeared on 12/7/2012. Click here.
View all notes |
Alert me of new notes |
CANSLIM.net Company Profile |
SEC |
Zacks Reports |
StockTalk |
News |
Chart |
Request a new note
C
A N
S L
I M
|
LKQ
-
NASDAQ
L K Q Corp
WHOLESALE - Auto Parts
|
$21.54
|
+0.07
0.33% |
$21.62
|
1,511,000
70.35% of 50 DAV
50 DAV is 2,147,700
|
$22.29
-3.34%
|
8/9/2012
|
$18.97
|
PP = $18.72
|
|
MB = $19.66
|
Most Recent Note - 12/4/2012 1:50:29 PM
G - Churning above average volume in recent weeks without making meaningful price progress. Encountering resistance after a worrisome "negative reversal" and finish near the session low on 11/26/12 followed by additional losses on above average volume. Results below the +25% minimum earnings guideline (C criteria) for Sep '12 recently raised fundamental concerns.
>>> The latest Featured Stock Update with an annotated graph appeared on 11/30/2012. Click here.
View all notes |
Alert me of new notes |
CANSLIM.net Company Profile |
SEC |
Zacks Reports |
StockTalk |
News |
Chart |
Request a new note
C
A N
S L
I M
|
MIDD
-
NASDAQ
Middleby Corp
MANUFACTURING - Diversified Machinery
|
$126.50
|
-2.14
-1.66% |
$129.46
|
84,206
115.19% of 50 DAV
50 DAV is 73,100
|
$129.99
-2.68%
|
10/8/2012
|
$118.46
|
PP = $122.67
|
|
MB = $128.80
|
Most Recent Note - 12/6/2012 4:46:13 PM
Y - Wedged to new highs with recent gains lacking great volume conviction. Earnings +23% on +18% sales for the Sep '12 quarter, below the +25% minimum earnings guideline (C criteria), raised concerns. See the latest FSU analysis for more details and a new annotated graph.
>>> The latest Featured Stock Update with an annotated graph appeared on 12/6/2012. Click here.
View all notes |
Alert me of new notes |
CANSLIM.net Company Profile |
SEC |
Zacks Reports |
StockTalk |
News |
Chart |
Request a new note
C
A N
S L
I M
|
RAX
-
NYSE
Rackspace Hosting Inc
INTERNET - Internet Software and; Services
|
$67.33
|
-0.12
-0.18% |
$67.85
|
1,168,228
74.88% of 50 DAV
50 DAV is 1,560,100
|
$70.00
-3.81%
|
11/26/2012
|
$66.26
|
PP = $67.18
|
|
MB = $70.54
|
Most Recent Note - 12/3/2012 6:36:05 PM
Y - Encountered mild distributional pressure today. Confirming gains above its pivot point with at least +40% above average volume would be a welcome reassurance. Disciplined investors may be wise to use a tactic called "pyramiding" to allow the market action to dictate their weighting in new buys while always limiting losses by selling if any stock ever falls more than -7% from their purchase price.
>>> The latest Featured Stock Update with an annotated graph appeared on 11/27/2012. Click here.
View all notes |
Alert me of new notes |
CANSLIM.net Company Profile |
SEC |
Zacks Reports |
StockTalk |
News |
Chart |
Request a new note
C
A N
S L
I M
|
Symbol/Exchange
Company Name
Industry Group |
PRICE |
CHANGE
(%Change) |
Day High |
Volume
(% DAV)
(% 50 day avg vol) |
52 Wk Hi
% From Hi |
Featured
Date |
Price
Featured |
Pivot Featured |
|
Max Buy |
RGR
-
NYSE
Sturm Ruger & Co Inc
CONSUMER DURABLES - Sporting Goods
|
$51.44
|
-2.00
-3.74% |
$54.19
|
751,754
159.98% of 50 DAV
50 DAV is 469,900
|
$60.11
-14.42%
|
11/20/2012
|
$52.23
|
PP = $52.65
|
|
MB = $55.28
|
Most Recent Note - 12/5/2012 12:17:21 PM
G - Trading lower as stock goes ex-dividend today for its $4.50/sh special dividend. Previously noted - "It is extended from its previously noted base and may form a high handle on its larger 7-month cup shaped base, however the minimum length for a proper handle is 1 week for it to be recognized as a valid cup-with-handle base. Prior highs near $52 define initial chart support to watch where violations may trigger technical sell signals."
>>> The latest Featured Stock Update with an annotated graph appeared on 11/21/2012. Click here.
View all notes |
Alert me of new notes |
CANSLIM.net Company Profile |
SEC |
Zacks Reports |
StockTalk |
News |
Chart |
Request a new note
C
A N
S L
I M
|
RNF
-
NYSE
Rentech Nitrogen Ptnr Lp
CHEMICALS - Agricultural Chemicals
|
$39.19
|
+0.59
1.53% |
$39.21
|
74,174
19.94% of 50 DAV
50 DAV is 371,900
|
$41.15
-4.76%
|
11/1/2012
|
$39.11
|
PP = $40.15
|
|
MB = $42.16
|
Most Recent Note - 12/4/2012 1:46:03 PM
Y - It is perched within close striking distance of its 52-week high. Recent gains with below average volume indicate lackluster buying demand from the institutional crowd. Disciplined investors may watch for volume-driven gains for a new high close to trigger a technical buy signal.
>>> The latest Featured Stock Update with an annotated graph appeared on 11/26/2012. Click here.
View all notes |
Alert me of new notes |
CANSLIM.net Company Profile |
SEC |
Zacks Reports |
StockTalk |
News |
Chart |
Request a new note
C
A N
S L
I M
|
ULTA
-
NASDAQ
Ulta Salon Cosm & Frag
SPECIALTY RETAIL - Specialty Retail, Other
|
$100.44
|
-1.09
-1.07% |
$101.59
|
729,994
97.40% of 50 DAV
50 DAV is 749,500
|
$103.52
-2.98%
|
12/4/2012
|
$100.29
|
PP = $103.62
|
|
MB = $108.80
|
Most Recent Note - 12/4/2012 5:26:19 PM
Y - Perched within close striking distance of its 52-week high following a considerable gap up gain on 11/30/12 with heavy volume. Color code was changed to yellow with new pivot point based on its 9/07/12 high plus 10 cents. Disciplined investors will watch for volume-driven gains above the pivot point to trigger a new technical buy signal. See latest FSU analysis for more details and a new annotated graph.
>>> The latest Featured Stock Update with an annotated graph appeared on 12/4/2012. Click here.
View all notes |
Alert me of new notes |
CANSLIM.net Company Profile |
SEC |
Zacks Reports |
StockTalk |
News |
Chart |
Request a new note
C
A N
S L
I M
|
VSI
-
NYSE
Vitamin Shoppe Inc
SPECIALTY RETAIL - Specialty Retail, Other
|
$57.29
|
-0.21
-0.37% |
$57.78
|
164,114
67.23% of 50 DAV
50 DAV is 244,100
|
$61.89
-7.43%
|
12/3/2012
|
$59.06
|
PP = $61.99
|
|
MB = $65.09
|
Most Recent Note - 12/4/2012 11:46:25 AM
G -Violated its 50 DMA line today, encountering distributional pressure, and its color code is changed to green. The $61 area has been a stubborn resistance level in recent months. See the latest FSU analysis for more details and a new annotated graph.
>>> The latest Featured Stock Update with an annotated graph appeared on 12/3/2012. Click here.
View all notes |
Alert me of new notes |
CANSLIM.net Company Profile |
SEC |
Zacks Reports |
StockTalk |
News |
Chart |
Request a new note
C
A N
S L
I M
|
WPI
-
NYSE
Watson Pharmaceuticals
DRUGS - Drugs - Generic
|
$88.62
|
+0.65
0.74% |
$88.93
|
664,461
85.00% of 50 DAV
50 DAV is 781,700
|
$90.00
-1.53%
|
8/24/2012
|
$82.90
|
PP = $81.10
|
|
MB = $85.16
|
Most Recent Note - 12/4/2012 1:48:03 PM
G - Consolidating within close striking distance of its 52-week high today with very little resistance remaining due to overhead supply. Quarterly comparisons for sales revenues and earnings increases have shown sequential deceleration in its growth rate raising some fundamental concerns, as recently noted.
>>> The latest Featured Stock Update with an annotated graph appeared on 11/23/2012. Click here.
View all notes |
Alert me of new notes |
CANSLIM.net Company Profile |
SEC |
Zacks Reports |
StockTalk |
News |
Chart |
Request a new note
C
A N
S L
I M
|
Symbol/Exchange
Company Name
Industry Group |
PRICE |
CHANGE
(%Change) |
Day High |
Volume
(% DAV)
(% 50 day avg vol) |
52 Wk Hi
% From Hi |
Featured
Date |
Price
Featured |
Pivot Featured |
|
Max Buy |
|
|
|
THESE ARE NOT BUY RECOMMENDATIONS!
Comments contained in the body of this report are technical
opinions only. The material herein has been obtained
from sources believed to be reliable and accurate, however,
its accuracy and completeness cannot be guaranteed.
This site is not an investment advisor, hence it does
not endorse or recommend any securities or other investments.
Any recommendation contained in this report may not
be suitable for all investors and it is not to be deemed
an offer or solicitation on our part with respect to
the purchase or sale of any securities. All trademarks,
service marks and trade names appearing in this report
are the property of their respective owners, and are
likewise used for identification purposes only.
This report is a service available
only to active Paid Premium Members.
You may opt-out of receiving report notifications
at any time. Questions or comments may be submitted
by writing to Premium Membership Services 665 S.E. 10 Street, Suite 201 Deerfield Beach, FL 33441-5634 or by calling 1-800-965-8307
or 954-785-1121.
|
|
|

