Help Lines 954-785-1121


You are not logged in. Upgrade Here
 <<<Previous Mid Day Report     Next Mid Day Report >>> 
 <<<Previous After Market Report Next After Market Report >>> 
You are not logged in.
This means you CAN ONLY VIEW reports that were published prior to Monday, February 26, 2024.
You MUST UPGRADE YOUR MEMBERSHIP if you want to see any current reports.

AFTER MARKET UPDATE - FRIDAY, DECEMBER 6TH, 2019
Previous After Market Report Next After Market Report >>>
Indices NYSE Nasdaq
DOW  +337.27 28,015.06 +1.22% Volume 850,417,340 +8% Volume 2,006,283,491 -3%
NASDAQ +85.83 8,656.53 +1.00% Advancers 2,135 74% Advancers 2,210 71%
S&P 500 +28.48 3,145.91 +0.91% Decliners 743 26% Decliners 888 29%
Russell 2000 +19.00 1,633.84 +1.18% 52 Wk Highs 155   52 Wk Highs 188  
S&P 600 +14.12 1,002.13 +1.43% 52 Wk Lows 14   52 Wk Lows 42  

Major Indice Rallied as Leadership Improved

The Dow climbed 337 points, paring its weekly fall to 0.1%. The S&P 500 reversed its weekly losses with Friday’s jump of 0.9%, ending 0.2% higher for the week. The Nasdaq Composite gained 1%, cutting its weekly decline to just 0.1%. Advancers led decliners by a almost a 3-1 margin on the NYSE and more than a 2-1 margin on the Nasdaq exchange. The volume totals were mixed, higher than the prior session on the NYSE and lighter on the Nasdaq exchange. Leadership improved as there were 68 high-ranked companies from the Leaders List that hit a new 52-week high and were listed on the BreakOuts Page, versus the total of 25 on the prior session. New 52-week highs totals expanded and solidly outnumbered new 52-week lows totals on the NYSE and on the Nasdaq exchange. The major indices (M criteria) are in a "confirmed uptrend" after enduring distributional pressure in recent weeks. The Featured Stocks Page provides the most timely analysis on high-ranked leaders.

Charts used courtesy of www.stockcharts.com

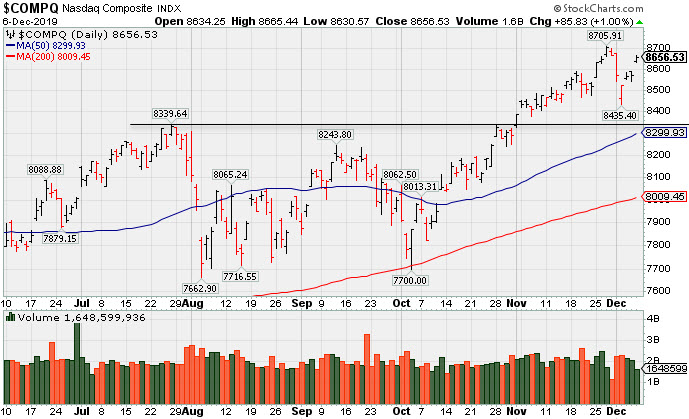
PICTURED: The Nasdaq Composite Index is consolidating above prior highs and its 50-day moving average (DMA) line which define near-term support. 

Stocks finished firmly higher on Friday, as investors digested a robust November jobs report. On the data front, the Labor Department’s monthly jobs report showed 266,000 jobs were added in November, well above economists’ forecasts of 180,000, while the prior month’s figure was upwardly revised to 156,000 from 128,000. The unemployment rate unexpectedly ticked down to 3.5% in the November. Separately, a preliminary update on December consumer sentiment from the University of Michigan reached a seven-month high, with the figure increasing to 99.2 from the prior month’s reading of 96.8. 

Amid the “risk-on” mood, perceived safe haven assets declined. COMEX gold lost 1.2%, while Treasuries weakened along the curve. The yield on the 10-year note rose four basis points to 1.84%. On the trade front, China announced it would exclude tariffs on some soybean and pork purchases, signaling progress towards a preliminary trade agreement.

Ten of 11 S&P 500 sectors finished higher, with Utilities the lone decliner. The Energy group paced the gains with WTI crude up 1.0% to $59.02/barrel. Shares of Google’s parent Alphabet (GOOGL +0.94%) and Apple (AAPL+1.93%) both reached record levels. In earnings, Ulta Beauty (ULTA +11.09%) rallied after beating profit estimates. Discount retailer Big Lots (BIG +31.58%) gapped up after a solid earnings report and saying it expects to return to earnings growth in 2020.

Kenneth J. Gruneisen started out as a licensed stockbroker in August 1987, a couple of months prior to the historic stock market crash that took the Dow Jones Industrial Average down -22.6% in a single day. He has published daily fact-based fundamental and technical analysis on high-ranked stocks online for two decades. Through FACTBASEDINVESTING.COM, Kenneth provides educational articles, news, market commentary, and other information regarding proven investment systems that work in good times and bad.

Comments contained in the body of this report are technical opinions only and are not necessarily those of Gruneisen Growth Corp. The material herein has been obtained from sources believed to be reliable and accurate, however, its accuracy and completeness cannot be guaranteed. Our firm, employees, and customers may effect transactions, including transactions contrary to any recommendation herein, or have positions in the securities mentioned herein or options with respect thereto. Any recommendation contained in this report may not be suitable for all investors and it is not to be deemed an offer or solicitation on our part with respect to the purchase or sale of any securities.


Energy-Linked Groups Led Financial, Retail, and Tech Higher

The Bank Index ($BKX +1.52%) and the Broker/Dealer Index ($XBD +0.94%) both outpaced the Retail Index ($RLX +0.75%). The tech sector was led by the Semiconductor Index ($SOX +1.56%) while the Biotech Index ($BTK +0.46%) posted a smalller gain and the Networking Index ($NWX +0.03%) finished flat. Commodity-linked groups were mixed as the Oil Services Index ($OSX +4.68%) was a standout gainer and the Integrated Oil Index ($XOI +2.04%) also rose, meanwhile, the Gold & Silver Index ($XAU -2.53%) was a standout decliner
Charts courtesy of www.stockcharts.com

PICTURED: The Oil Services Index ($OSX +4.68%) posted a big gain. It has been consolidating above its 50-day moving average (DMA) line.

Industry Index Symbol Close Change % Change YTD % Change
Oil Services $OSX  71.41 +3.20 +4.69% -11.40%
Integrated Oil $XOI  1,218.08 +24.34 +2.04% +5.09%
Semiconductor $SOX  1,724.21 +26.55 +1.56% +49.26%
Networking $NWX  563.01 +0.16 +0.03% +15.21%
Broker/Dealer $XBD  288.91 +2.69 +0.94% +21.73%
Retail $RLX  2,362.07 +17.65 +0.75% +21.04%
Gold & Silver $XAU  95.90 -2.48 -2.52% +35.72%
Bank $BKX  110.95 +1.67 +1.53% +29.33%
Biotech $BTK  5,076.49 +23.07 +0.46% +20.27%


Featured Stocks

See the Featured Stocks with most recent note below. Feel free to contact us if you have a need for any additional information.

Color Codes Explained :
Y - Better candidates highlighted by our staff of experts.
G - Previously featured in past reports as yellow but may no longer be buyable under the guidelines.

***Last / Change / Volume data in this table is the closing quote data***
Symbol/Exchange
Company Name
Industry Group
PRICE CHANGE
(%Change)
Day High Volume
(% DAV)
(% 50 day avg vol)
52 Wk Hi
% From Hi
Featured
Date
Price
Featured
Pivot Featured
Max Buy
StockCharts.com Latest Chart for MLR MLR - NYSE
Miller Industries Inc
AUTOMOTIVE - Auto Parts  
$35.82 +0.08
0.22%

$36.42

65,844
149.65% of 50 DAV
50 DAV is 44,000
$37.70
-4.99%
9/24/2019 $34.00 PP = $35.36
MB = $37.13
Most Recent Note - 12/4/2019 5:45:57 PM
Y - Pulled back today for a 4th consecutive loss with light volume, remaining near its 52-week high. Prior highs in the $35 area define initial support above its 50 DMA line ($34.39). Showed resilience after recently reporting earnings which were below the fundamental guidelines of the fact-based investment system. See the latest FSU analysis for more details and a new annotated graph.
>>> FEATURED STOCK ARTICLE : Miller Still Quietly Hovering Above Prior Highs - 12/4/2019
 |  View all notes | Set NEW NOTE alert | Company Profile | SEC News | Chart | Request a new note C A  S  I 
StockCharts.com Latest Chart for CCBG CCBG - NASDAQ
Capital City Bk Gp
BANKING - Regional - Mid-Atlantic Banks  
$28.88 +0.44
1.55%

$29.17

39,006
102.65% of 50 DAV
50 DAV is 38,000
$30.85
-6.39%
9/13/2019 $27.03 PP = $27.05
MB = $28.40
Most Recent Note - 12/4/2019 5:49:11 PM
G - Posted a gain today with light volume after it tested its 50 DMA line ($28.31) and prior highs which define important support to watch. More damaging losses would raise concerns and trigger a technical sell signal.
>>> FEATURED STOCK ARTICLE : Consolidating After Volume-Driven Gains for New Highs - 11/19/2019
 |  View all notes | Set NEW NOTE alert | Company Profile | SEC News | Chart | Request a new note C A  S  I 
StockCharts.com Latest Chart for FTNT FTNT - NASDAQ
Fortinet Inc
Computer Sftwr-Security  
$103.59 -1.32
-1.26%

$105.66

1,032,569
75.15% of 50 DAV
50 DAV is 1,374,000
$106.00
-2.27%
11/11/2019 $97.14 PP = $97.06
MB = $101.91
Most Recent Note - 12/2/2019 12:33:21 PM
G - Stubbornly holding its ground after getting extended from the prior base. Prior high in the $97 area defines initial support to watch on pullbacks.
>>> FEATURED STOCK ARTICLE : Extended From Prior Base Perched Near Record HIgh - 12/2/2019
 |  View all notes | Set NEW NOTE alert | Company Profile | SEC News | Chart | Request a new note C A  S  I 
StockCharts.com Latest Chart for SPSC SPSC - NASDAQ
S P S Commerce Inc
COMPUTER SOFTWARE and SERVICES - Application Software  
$55.62 -0.33
-0.59%

$56.57

201,503
98.78% of 50 DAV
50 DAV is 204,000
$59.14
-5.95%
11/29/2019 $56.59 PP = $59.24
MB = $62.20
Most Recent Note - 12/4/2019 5:56:20 PM
Y - Finished lower with today's 5th consecutive loss after stalling near its all-time high. Subsequent gains above its pivot point backed by at least +40% above average volume are needed to trigger a new technical buy signal. Fundamentals remain strong.
>>> FEATURED STOCK ARTICLE : Rebound Leaves Supply Chain Management Software Firm Near High - 11/29/2019
 |  View all notes | Set NEW NOTE alert | Company Profile | SEC News | Chart | Request a new note C A  S  I 
StockCharts.com Latest Chart for AUDC AUDC - NASDAQ
Audiocodes Ltd
ELECTRONICS - Scientific and Technical Instrum  
$23.76 -0.08
-0.34%

$24.25

208,831
76.78% of 50 DAV
50 DAV is 272,000
$25.04
-5.11%
9/13/2019 $19.68 PP = $19.84
MB = $20.83
Most Recent Note - 12/4/2019 12:42:22 PM
G - Inching into new high territory with today's 3rd consecutive gain adding to a spurt of gains marked by near average volume. Prior highs in the $22 area define initial support above its 50 DMA line ($20.65). Fundamentals remain strong.
>>> FEATURED STOCK ARTICLE : Volume Totals Cooling After Gains for New Highs - 11/22/2019
 |  View all notes | Set NEW NOTE alert | Company Profile | SEC News | Chart | Request a new note C A  S  I 
Symbol/Exchange
Company Name
Industry Group
PRICE CHANGE
(%Change)
Day High Volume
(% DAV)
(% 50 day avg vol)
52 Wk Hi
% From Hi
Featured
Date
Price
Featured
Pivot Featured
Max Buy
StockCharts.com Latest Chart for CHDN CHDN - NASDAQ
Churchill Downs Inc
LEISURE - Gaming Activities  
$131.41 +1.68
1.29%

$132.13

252,236
85.79% of 50 DAV
50 DAV is 294,000
$135.32
-2.89%
10/8/2019 $129.77 PP = $132.83
MB = $139.47
Most Recent Note - 12/2/2019 12:31:23 PM
G - Perched within close striking distance of its 52-week high, but extended from any sound base. Its 50 DMA line ($128) defines near-term support above the prior low ($121.81 on 11/07/19) The Jun and Sep '19 quarterly earnings versus the year ago periods were both below the +25% minimum guideline (C criteria) and raised fundamental concerns.
>>> FEATURED STOCK ARTICLE : Resilience Shown Despite Another Sub Par Earnings Report - 11/18/2019
 |  View all notes | Set NEW NOTE alert | Company Profile | SEC News | Chart | Request a new note C A  S  I 
StockCharts.com Latest Chart for LULU LULU - NASDAQ
Lululemon Athletica
MANUFACTURING - Textile Manufacturing  
$229.38 -1.41
-0.61%

$233.12

1,904,001
122.52% of 50 DAV
50 DAV is 1,554,000
$230.82
-0.62%
9/6/2019 $201.25 PP = $194.35
MB = $204.07
Most Recent Note - 12/4/2019 5:53:02 PM
G - Extended from any sound base and stubbornly holding its ground near its all-time high. Its 50 DMA line ($206) defines important near-term support.

>>> FEATURED STOCK ARTICLE : New High Close Stretches Already Extended Leader - 11/26/2019
 |  View all notes | Set NEW NOTE alert | Company Profile | SEC News | Chart | Request a new note C A  S  I 
StockCharts.com Latest Chart for CPRT CPRT - NASDAQ
Copart Inc
SPECIALTY RETAIL - Auto Dealerships  
$88.58 +0.34
0.39%

$89.51

1,186,912
71.46% of 50 DAV
50 DAV is 1,661,000
$92.41
-4.14%
9/5/2019 $79.13 PP = $79.84
MB = $83.83
Most Recent Note - 12/2/2019 12:32:26 PM
G - Consolidating after getting extended from any sound base. The 50 DMA line ($83.22) defines near-term support above the prior low ($80.71 on 11/06/19). Fundamentals remain strong.
>>> FEATURED STOCK ARTICLE : Gapped Up Following Another Strong Earnings Report - 11/21/2019
 |  View all notes | Set NEW NOTE alert | Company Profile | SEC News | Chart | Request a new note C A  S  I 
StockCharts.com Latest Chart for NMIH NMIH - NASDAQ
N M I Holdings Inc Cl A
Finance-MrtgandRel Svc  
$33.44 +0.50
1.52%

$33.74

462,388
106.54% of 50 DAV
50 DAV is 434,000
$34.50
-3.07%
11/8/2019 $32.89 PP = $31.44
MB = $33.01
Most Recent Note - 12/4/2019 5:51:40 PM
G - Consolidating above prior highs in the $30-31 area which define initial support along with its 50 DMA line ($30.04).
>>> FEATURED STOCK ARTICLE : Holding Ground Stubbornly Near All-Time High - 11/27/2019
 |  View all notes | Set NEW NOTE alert | Company Profile | SEC News | Chart | Request a new note C A  S  I 
StockCharts.com Latest Chart for SPLK SPLK - NASDAQ
Splunk Inc
Computer Sftwr-Database  
$147.89 +1.75
1.20%

$148.68

983,197
53.20% of 50 DAV
50 DAV is 1,848,000
$152.68
-3.14%
11/25/2019 $147.79 PP = $142.16
MB = $149.27
Most Recent Note - 12/4/2019 5:54:07 PM
Y - Color code is changed to yellow after quietly pulling back below its "max buy" level. Prior highs in the $142-143 area define initial support to watch on pullbacks.
>>> FEATURED STOCK ARTICLE : Spurt of Volume-Driven Gains Reaches New All-Time High - 11/25/2019
 |  View all notes | Set NEW NOTE alert | Company Profile | SEC News | Chart | Request a new note C A  S  I 
Symbol/Exchange
Company Name
Industry Group
PRICE CHANGE
(%Change)
Day High Volume
(% DAV)
(% 50 day avg vol)
52 Wk Hi
% From Hi
Featured
Date
Price
Featured
Pivot Featured
Max Buy
StockCharts.com Latest Chart for PAYC PAYC - NYSE
Paycom Software Inc
COMPUTER SOFTWARE and SERVICES - Application Software  
$268.79 +0.26
0.10%

$270.84

500,438
87.18% of 50 DAV
50 DAV is 574,000
$279.95
-3.99%
11/20/2019 $252.97 PP = $259.81
MB = $272.80
Most Recent Note - 12/2/2019 12:12:49 PM
G - Pulling back after an impressive streak of 14 consecutive gains left it extended from the prior base. Prior high ($259) defines initial support to watch on pullbacks. Fundamentals remain strong.
>>> FEATURED STOCK ARTICLE : Powerful Gain for New High Backed by Heavy Volume - 11/20/2019
 |  View all notes | Set NEW NOTE alert | Company Profile | SEC News | Chart | Request a new note C A  S  I 
StockCharts.com Latest Chart for BLD BLD - NYSE
Topbuild Corp
Bldg-Constr Prds/Misc  
$109.37 -1.01
-0.92%

$111.46

238,430
88.97% of 50 DAV
50 DAV is 268,000
$113.74
-3.84%
5/17/2019 $82.19 PP = $87.31
MB = $91.68
Most Recent Note - 12/3/2019 5:08:14 PM
G - Consolidating after getting extended from any sound base. Bullish action has continued after it reported earnings +24% on +5% sales revenues for the Sep '19 quarter versus the year ago period, just below the +25% minimum guideline (C criteria). Its 50 DMA line ($102.71) acted as support during its ongoing ascent. See the latest FSU analysis for more details and a new annotated graph.
>>> FEATURED STOCK ARTICLE : Consolidating After Getting Extended From Any Sound Base - 12/3/2019
 |  View all notes | Set NEW NOTE alert | Company Profile | SEC News | Chart | Request a new note C A  S  I 
StockCharts.com Latest Chart for GLOB GLOB - NYSE
Globant SA
Computer-Tech Services  
$103.34 +1.89
1.86%

$103.66

281,958
105.21% of 50 DAV
50 DAV is 268,000
$112.33
-8.00%
11/14/2019 $106.87 PP = $112.43
MB = $118.05
Most Recent Note - 12/5/2019 5:11:28 PM
G - Posted a 2nd consecutive gain with light volume. Found support after again slumping near its 50 DMA line ($97.43) with volume-driven losses. Prior lows and its 200 DMA line define the next important support to watch. Fundamentals remain strong. See the latest FSU analysis for more details and a new annotated graph.
>>> FEATURED STOCK ARTICLE : Found Support at 50-Day Average During Choppy Consolidation - 12/5/2019
 |  View all notes | Set NEW NOTE alert | Company Profile | SEC News | Chart | Request a new note C A  S  I 

THESE ARE NOT BUY RECOMMENDATIONS!  Comments contained in the body of this report are technical opinions only. The material herein has been obtained from sources believed to be reliable and accurate, however, its accuracy and completeness cannot be guaranteed. This site is not an investment advisor, hence it does not endorse or recommend any securities or other investments. Any recommendation contained in this report may not be suitable for all investors and it is not to be deemed an offer or solicitation on our part with respect to the purchase or sale of any securities. All trademarks, service marks and trade names appearing in this report are the property of their respective owners, and are likewise used for identification purposes only.

This report is a service available only to active Paid Premium Members. You may opt-out of receiving report notifications at any time.  Questions or comments may be submitted by writing to Premium Membership Services 665 S.E. 10 Street, Suite 201 Deerfield Beach, FL 33441-5634 or by calling 1-800-965-8307 or 954-785-1121.

Kenneth J. Gruneisen founded Gruneisen Growth Corp. (2003), which prior to May 11, 2015, operated CANSLIM.net and CANSLIM.com both under license from Data Analysis Inc. / Investor's Business Daily. Kenneth has passed the CAN SLIM® Master's Exam. Gruneisen Growth Corp. now continues over two decades of fact based market analysis via FactBasedInvesting.com.

Copyright © 1996-2024 Gruneisen Growth Corp. All rights reserved. Protected by the copyright laws of the United States and Canada and by international treaties

Privacy Policy | Terms of Use | Contact Us