You are not logged in.
This means you
CAN ONLY VIEW reports that were published prior to Monday, April 14, 2025.
You
MUST UPGRADE YOUR MEMBERSHIP if you want to see any current reports.
AFTER MARKET UPDATE - THURSDAY, DECEMBER 6TH, 2012
Previous After Market Report Next After Market Report >>>
|
|
|
|
DOW |
+39.55 |
13,074.04 |
+0.30% |
|
Volume |
617,147,850 |
-19% |
|
Volume |
1,656,758,310 |
-5% |
|
NASDAQ |
+15.57 |
2,989.27 |
+0.52% |
|
Advancers |
1,586 |
50% |
|
Advancers |
1,223 |
47% |
|
S&P 500 |
+4.66 |
1,413.94 |
+0.33% |
|
Decliners |
1,434 |
45% |
|
Decliners |
1,234 |
48% |
|
Russell 2000 |
+1.19 |
821.79 |
+0.15% |
|
52 Wk Highs |
59 |
|
|
52 Wk Highs |
40 |
|
|
S&P 600 |
+0.47 |
462.01 |
+0.10% |
|
52 Wk Lows |
21 |
|
|
52 Wk Lows |
35 |
|
|
 |
Major Averages Edged Higher With Lighter Volume
Kenneth J. Gruneisen - Passed the CAN SLIM® Master's Exam
The major averages finished with modest gains on Thursday. The volume totals were reported lighter than the prior session on the Nasdaq exchange and on the NYSE, revealing a lack of buying conviction from the institutional crowd. Advancing shares led decliners by a narrow margin on the NYSE, meanwhile decliners and advancers were evenly mixed on the Nasdaq exchange. The total number of stocks hitting new 52-week highs outnumbered new 52-week lows on the NYSE and also on the Nasdaq exchange. There were 23 high-ranked companies from the CANSLIM.net Leaders List making new 52-week highs and appearing on the CANSLIM.net BreakOuts Page, down from the prior session total of 34 stocks. Any sustainable rally requires a healthy crop of companies hitting new 52-week highs, so it is important for leadership to remain present. There were gains for 5 of the 10 high-ranked companies currently included on the Featured Stocks Page.
The stalemate in Washington is keeping investors cautious. The budget negotiations remain deadlocked as President Obama holds firm on his stance of higher taxes for wealthy Americans. A downward revision to the ECB's economic forecasts for the euro zone added to uncertainty as the bank expects the region to continue to contract next year. Investors were also hesitant ahead of Friday's non-farm payrolls report which is expected to show 86,000 jobs were added in November. Ahead of the employment update, jobless claims bested consensus expectations as 25,000 fewer Americans filed for unemployment benefits last week.
Earnings results were on the back burner. H&R Block Inc (HRB +5.12%) gained after topping revenue estimates and posting a smaller than anticipated loss. Lululemon Athletica Inc (LULU +7.26%) was also higher after the besting profit expectations. Overall, most sectors were higher.
In fixed-income, the 10-year Treasury note was flat to yield 1.58%.
The market direction (M criteria) is currently a "confirmed uptrend" and new buying efforts may be justified only in worthy high-ranked leaders. See the noteworthy companies included on the Featured Stocks Page.
Watch for an announcement via email concerning the next WEBCAST. The webcast will also be available via an updated link highlighted at the top of the Premium Member Homepage.
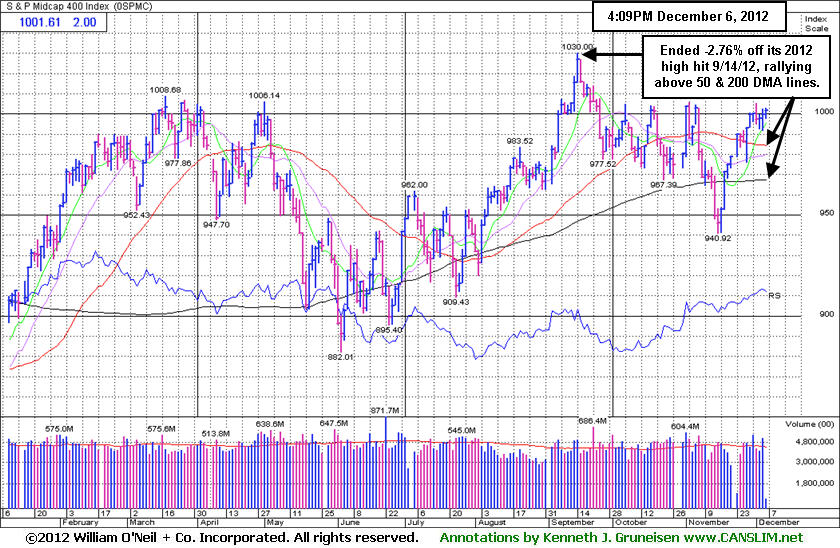
PICTURED: The S&P 400 Mid-Cap Index ended -2.76% off its 2012 high hit 9/14/12, rallying above its 50-day moving average (DMA) line after a brief dip below its 200 DMA line.
|
 Kenneth J. Gruneisen started out as a licensed stockbroker in August 1987, a couple of months prior to the historic stock market crash that took the Dow Jones Industrial Average down -22.6% in a single day. He has published daily fact-based fundamental and technical analysis on high-ranked stocks online for two decades. Through FACTBASEDINVESTING.COM, Kenneth provides educational articles, news, market commentary, and other information regarding proven investment systems that work in good times and bad.
Comments contained in the body of this report are technical opinions only and are not necessarily those of Gruneisen Growth Corp. The material herein has been obtained from sources believed to be reliable and accurate, however, its accuracy and completeness cannot be guaranteed. Our firm, employees, and customers may effect transactions, including transactions contrary to any recommendation herein, or have positions in the securities mentioned herein or options with respect thereto. Any recommendation contained in this report may not be suitable for all investors and it is not to be deemed an offer or solicitation on our part with respect to the purchase or sale of any securities. |
|
 |
Semiconductor and Internet Indexes Led Group Gainers
Kenneth J. Gruneisen - Passed the CAN SLIM® Master's Exam
Gains from the Semiconductor Index ($SOX +1.11%) and the Internet Index ($IIX +1.16%) led the tech sector higher while the Biotechnology Index ($BTK -0.18%) and Networking Index ($NWX -0.03%) sputtered. The Retail Index ($RLX +0.27%) also was a positive influence with a small gain, meanwhile the Healthcare Index ($HMO +0.05%) and Gold & Silver Index ($XAU +0.14%) posted tiny gains. Financial shares were mixed as the Bank Index ($BKX +0.31%) edged higher and the Broker/Dealer Index ($XBD -0.21%) ended with a small loss. Energy-related shares were also mixed and little changed as the Integrated Oil Index ($XOI +0.29%) inched higher but the Oil Services Index ($OSX -0.19%) ended with a small loss.
Charts courtesy www.stockcharts.com
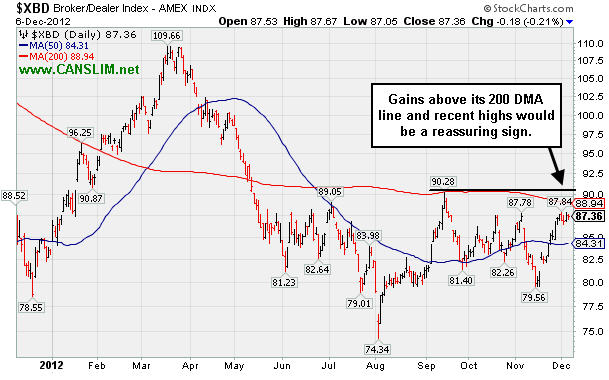
PICTURED: The Broker/Dealer Index ($XBD -0.21%) is consolidating below its 200-day moving average (DMA) line. Subsequent gains above that important long-term average and above its recent chart highs would be an encouraging sign since financial stocks have a history of being reliable leading indicators for the broader market.
| Oil Services |
$OSX |
220.56 |
-0.41 |
-0.19% |
+1.98% |
| Healthcare |
$HMO |
2,491.38 |
+1.22 |
+0.05% |
+9.19% |
| Integrated Oil |
$XOI |
1,215.51 |
+3.48 |
+0.29% |
-1.11% |
| Semiconductor |
$SOX |
378.63 |
+4.17 |
+1.11% |
+3.89% |
| Networking |
$NWX |
213.30 |
-0.07 |
-0.03% |
-0.86% |
| Internet |
$IIX |
321.68 |
+3.69 |
+1.16% |
+14.18% |
| Broker/Dealer |
$XBD |
87.36 |
-0.18 |
-0.21% |
+4.91% |
| Retail |
$RLX |
666.78 |
+1.78 |
+0.27% |
+27.44% |
| Gold & Silver |
$XAU |
160.62 |
+0.23 |
+0.14% |
-11.08% |
| Bank |
$BKX |
48.79 |
+0.15 |
+0.31% |
+23.90% |
| Biotech |
$BTK |
1,523.32 |
-2.69 |
-0.18% |
+39.57% |
|
|
|
 |
Wedging Higher But Flaws Give Cause For Concern
Kenneth J. Gruneisen - Passed the CAN SLIM® Master's Exam
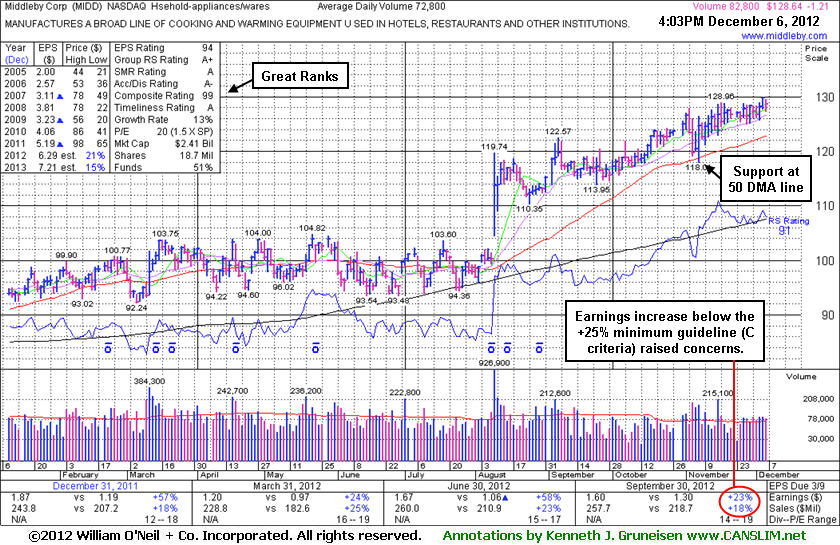
Middleby Corp (MIDD -$1.21 or -0.93% to $128.64) has recently been wedging higher without great volume conviction behind small gains into new all-time high territory. Disciplined investors may watch closely for sell signals if holding it and giving it a chance to produce more climactic gains. Its 50-day moving average (DMA) line defines near-term chart support to watch where any violation would trigger a technical sell signal. It reported earnings +23% on +18% sales for the Sep '12 quarter, below the +25% minimum earnings guideline (C criteria), raising fundamental concerns. Its last appearance in this FSU section was on 11/16/12 with an annotated graph under the headline, "Appliance Maker Strong Despite Latest Quarter Below Minimum Guideline". Prior reports also cautioned that its annual earnings (A criteria) had a downturn in FY '09, yet they have otherwise been good and steady.
The number of top-rated funds owning its shares rose from 351 in Dec '11 to 392 in Sep '12, a reassuring sign concerning the I criteria. Today its current Up/Down Volume Ratio of 1.5 is an unbiased indication its shares have been under accumulation over the past 50 days. Its small supply (S criteria) of only 17.1 million shares can contribute to greater price volatility in the event of institutional buying or selling.
Investors who are disciplined, selective, and patient would likely watch for a fresh breakout in another high-ranked stock without any fundamental flaws, rather than looking for excuses to buy one with flaws.
|
|
|
Color Codes Explained :
Y - Better candidates highlighted by our
staff of experts.
G - Previously featured
in past reports as yellow but may no longer be buyable under the
guidelines.
***Last / Change / Volume data in this table is the closing quote data***
Symbol/Exchange
Company Name
Industry Group |
PRICE |
CHANGE
(%Change) |
Day High |
Volume
(% DAV)
(% 50 day avg vol) |
52 Wk Hi
% From Hi |
Featured
Date |
Price
Featured |
Pivot Featured |
|
Max Buy |
CFNL
-
NASDAQ
Cardinal Financial Corp
BANKING - Regional - Southeast Banks
|
$15.56
|
-0.17
-1.08% |
$15.75
|
150,461
77.32% of 50 DAV
50 DAV is 194,600
|
$16.21
-4.01%
|
12/3/2012
|
$15.20
|
PP = $16.31
|
|
MB = $17.13
|
 Most Recent Note - 12/6/2012 3:49:22 PM
Y - Color code was changed to yellow with a new pivot point cited based on its 11/06/12 high while still building on a short base-on-base pattern. Recent low and its 50 DMA line define near-term chart support where violations may trigger technical sell signals. Volume-driven gains above its pivot point may trigger a new (or add-on) technical buy signal.
>>> The latest Featured Stock Update with an annotated graph appeared on 11/20/2012. Click here.
View all notes |
Alert me of new notes |
CANSLIM.net Company Profile |
SEC |
Zacks Reports |
StockTalk |
News |
Chart |
Request a new note
C
A N
S L
I M


|
CMCSA
-
NASDAQ
Comcast Corp Cl A
MEDIA - CATV Systems
|
$37.14
|
+0.26
0.71% |
$37.23
|
8,041,267
66.98% of 50 DAV
50 DAV is 12,005,100
|
$37.96
-2.16%
|
12/3/2012
|
$37.08
|
PP = $38.06
|
|
MB = $39.96
|
Most Recent Note - 12/6/2012 3:51:34 PM
Y - Perched within close striking distance of its 52-week high. Subsequent volume-driven gains above the pivot point may trigger a new (or add-on) technical buy signal. Color code was changed to yellow with new pivot point cited based on its 11/02/12 high plus 10 cents while currently building on a short flat base.
>>> The latest Featured Stock Update with an annotated graph appeared on 11/19/2012. Click here.
View all notes |
Alert me of new notes |
CANSLIM.net Company Profile |
SEC |
Zacks Reports |
StockTalk |
News |
Chart |
Request a new note
C
A N
S L
I M
|
LKQ
-
NASDAQ
L K Q Corp
WHOLESALE - Auto Parts
|
$21.47
|
-0.33
-1.51% |
$21.85
|
1,296,391
60.39% of 50 DAV
50 DAV is 2,146,700
|
$22.29
-3.66%
|
8/9/2012
|
$18.97
|
PP = $18.72
|
|
MB = $19.66
|
Most Recent Note - 12/4/2012 1:50:29 PM
G - Churning above average volume in recent weeks without making meaningful price progress. Encountering resistance after a worrisome "negative reversal" and finish near the session low on 11/26/12 followed by additional losses on above average volume. Results below the +25% minimum earnings guideline (C criteria) for Sep '12 recently raised fundamental concerns.
>>> The latest Featured Stock Update with an annotated graph appeared on 11/30/2012. Click here.
View all notes |
Alert me of new notes |
CANSLIM.net Company Profile |
SEC |
Zacks Reports |
StockTalk |
News |
Chart |
Request a new note
C
A N
S L
I M
|
MIDD
-
NASDAQ
Middleby Corp
MANUFACTURING - Diversified Machinery
|
$128.64
|
-1.21
-0.93% |
$129.58
|
83,791
115.10% of 50 DAV
50 DAV is 72,800
|
$129.99
-1.04%
|
10/8/2012
|
$118.46
|
PP = $122.67
|
|
MB = $128.80
|
Most Recent Note - 12/6/2012 4:46:13 PM
Y - Wedged to new highs with recent gains lacking great volume conviction. Earnings +23% on +18% sales for the Sep '12 quarter, below the +25% minimum earnings guideline (C criteria), raised concerns. See the latest FSU analysis for more details and a new annotated graph.
>>> The latest Featured Stock Update with an annotated graph appeared on 12/6/2012. Click here.
View all notes |
Alert me of new notes |
CANSLIM.net Company Profile |
SEC |
Zacks Reports |
StockTalk |
News |
Chart |
Request a new note
C
A N
S L
I M
|
RAX
-
NYSE
Rackspace Hosting Inc
INTERNET - Internet Software and; Services
|
$67.45
|
+0.64
0.96% |
$67.50
|
1,271,135
81.50% of 50 DAV
50 DAV is 1,559,600
|
$70.00
-3.64%
|
11/26/2012
|
$66.26
|
PP = $67.18
|
|
MB = $70.54
|
Most Recent Note - 12/3/2012 6:36:05 PM
Y - Encountered mild distributional pressure today. Confirming gains above its pivot point with at least +40% above average volume would be a welcome reassurance. Disciplined investors may be wise to use a tactic called "pyramiding" to allow the market action to dictate their weighting in new buys while always limiting losses by selling if any stock ever falls more than -7% from their purchase price.
>>> The latest Featured Stock Update with an annotated graph appeared on 11/27/2012. Click here.
View all notes |
Alert me of new notes |
CANSLIM.net Company Profile |
SEC |
Zacks Reports |
StockTalk |
News |
Chart |
Request a new note
C
A N
S L
I M
|
Symbol/Exchange
Company Name
Industry Group |
PRICE |
CHANGE
(%Change) |
Day High |
Volume
(% DAV)
(% 50 day avg vol) |
52 Wk Hi
% From Hi |
Featured
Date |
Price
Featured |
Pivot Featured |
|
Max Buy |
RGR
-
NYSE
Sturm Ruger & Co Inc
CONSUMER DURABLES - Sporting Goods
|
$53.44
|
+0.92
1.75% |
$53.53
|
564,185
103.96% of 50 DAV
50 DAV is 542,700
|
$60.11
-11.10%
|
11/20/2012
|
$52.23
|
PP = $52.65
|
|
MB = $55.28
|
Most Recent Note - 12/5/2012 12:17:21 PM
G - Trading lower as stock goes ex-dividend today for its $4.50/sh special dividend. Previously noted - "It is extended from its previously noted base and may form a high handle on its larger 7-month cup shaped base, however the minimum length for a proper handle is 1 week for it to be recognized as a valid cup-with-handle base. Prior highs near $52 define initial chart support to watch where violations may trigger technical sell signals."
>>> The latest Featured Stock Update with an annotated graph appeared on 11/21/2012. Click here.
View all notes |
Alert me of new notes |
CANSLIM.net Company Profile |
SEC |
Zacks Reports |
StockTalk |
News |
Chart |
Request a new note
C
A N
S L
I M
|
RNF
-
NYSE
Rentech Nitrogen Ptnr Lp
CHEMICALS - Agricultural Chemicals
|
$38.60
|
+0.10
0.26% |
$39.20
|
177,145
46.72% of 50 DAV
50 DAV is 379,200
|
$41.15
-6.20%
|
11/1/2012
|
$39.11
|
PP = $40.15
|
|
MB = $42.16
|
Most Recent Note - 12/4/2012 1:46:03 PM
Y - It is perched within close striking distance of its 52-week high. Recent gains with below average volume indicate lackluster buying demand from the institutional crowd. Disciplined investors may watch for volume-driven gains for a new high close to trigger a technical buy signal.
>>> The latest Featured Stock Update with an annotated graph appeared on 11/26/2012. Click here.
View all notes |
Alert me of new notes |
CANSLIM.net Company Profile |
SEC |
Zacks Reports |
StockTalk |
News |
Chart |
Request a new note
C
A N
S L
I M
|
ULTA
-
NASDAQ
Ulta Salon Cosm & Frag
SPECIALTY RETAIL - Specialty Retail, Other
|
$101.53
|
+1.34
1.34% |
$101.61
|
738,566
99.10% of 50 DAV
50 DAV is 745,300
|
$103.52
-1.92%
|
12/4/2012
|
$100.29
|
PP = $103.62
|
|
MB = $108.80
|
Most Recent Note - 12/4/2012 5:26:19 PM
Y - Perched within close striking distance of its 52-week high following a considerable gap up gain on 11/30/12 with heavy volume. Color code was changed to yellow with new pivot point based on its 9/07/12 high plus 10 cents. Disciplined investors will watch for volume-driven gains above the pivot point to trigger a new technical buy signal. See latest FSU analysis for more details and a new annotated graph.
>>> The latest Featured Stock Update with an annotated graph appeared on 12/4/2012. Click here.
View all notes |
Alert me of new notes |
CANSLIM.net Company Profile |
SEC |
Zacks Reports |
StockTalk |
News |
Chart |
Request a new note
C
A N
S L
I M
|
VSI
-
NYSE
Vitamin Shoppe Inc
SPECIALTY RETAIL - Specialty Retail, Other
|
$57.50
|
-0.38
-0.66% |
$58.46
|
131,400
53.41% of 50 DAV
50 DAV is 246,000
|
$61.89
-7.09%
|
12/3/2012
|
$59.06
|
PP = $61.99
|
|
MB = $65.09
|
Most Recent Note - 12/4/2012 11:46:25 AM
G -Violated its 50 DMA line today, encountering distributional pressure, and its color code is changed to green. The $61 area has been a stubborn resistance level in recent months. See the latest FSU analysis for more details and a new annotated graph.
>>> The latest Featured Stock Update with an annotated graph appeared on 12/3/2012. Click here.
View all notes |
Alert me of new notes |
CANSLIM.net Company Profile |
SEC |
Zacks Reports |
StockTalk |
News |
Chart |
Request a new note
C
A N
S L
I M
|
WPI
-
NYSE
Watson Pharmaceuticals
DRUGS - Drugs - Generic
|
$87.97
|
-0.10
-0.11% |
$88.45
|
744,614
94.88% of 50 DAV
50 DAV is 784,800
|
$90.00
-2.26%
|
8/24/2012
|
$82.90
|
PP = $81.10
|
|
MB = $85.16
|
Most Recent Note - 12/4/2012 1:48:03 PM
G - Consolidating within close striking distance of its 52-week high today with very little resistance remaining due to overhead supply. Quarterly comparisons for sales revenues and earnings increases have shown sequential deceleration in its growth rate raising some fundamental concerns, as recently noted.
>>> The latest Featured Stock Update with an annotated graph appeared on 11/23/2012. Click here.
View all notes |
Alert me of new notes |
CANSLIM.net Company Profile |
SEC |
Zacks Reports |
StockTalk |
News |
Chart |
Request a new note
C
A N
S L
I M
|
Symbol/Exchange
Company Name
Industry Group |
PRICE |
CHANGE
(%Change) |
Day High |
Volume
(% DAV)
(% 50 day avg vol) |
52 Wk Hi
% From Hi |
Featured
Date |
Price
Featured |
Pivot Featured |
|
Max Buy |
|
|
|
THESE ARE NOT BUY RECOMMENDATIONS!
Comments contained in the body of this report are technical
opinions only. The material herein has been obtained
from sources believed to be reliable and accurate, however,
its accuracy and completeness cannot be guaranteed.
This site is not an investment advisor, hence it does
not endorse or recommend any securities or other investments.
Any recommendation contained in this report may not
be suitable for all investors and it is not to be deemed
an offer or solicitation on our part with respect to
the purchase or sale of any securities. All trademarks,
service marks and trade names appearing in this report
are the property of their respective owners, and are
likewise used for identification purposes only.
This report is a service available
only to active Paid Premium Members.
You may opt-out of receiving report notifications
at any time. Questions or comments may be submitted
by writing to Premium Membership Services 665 S.E. 10 Street, Suite 201 Deerfield Beach, FL 33441-5634 or by calling 1-800-965-8307
or 954-785-1121.
|
|
|

