You are not logged in.
This means you
CAN ONLY VIEW reports that were published prior to Monday, April 14, 2025.
You
MUST UPGRADE YOUR MEMBERSHIP if you want to see any current reports.
AFTER MARKET UPDATE - THURSDAY, DECEMBER 5TH, 2013
Previous After Market Report Next After Market Report >>>
|
|
|
|
DOW |
-68.26 |
15,821.51 |
-0.43% |
|
Volume |
699,953,000 |
-7% |
|
Volume |
1,815,743,070 |
-1% |
|
NASDAQ |
-4.84 |
4,033.16 |
-0.12% |
|
Advancers |
1,032 |
33% |
|
Advancers |
1,168 |
44% |
|
S&P 500 |
-7.78 |
1,785.03 |
-0.43% |
|
Decliners |
1,984 |
64% |
|
Decliners |
1,389 |
52% |
|
Russell 2000 |
+1.09 |
1,122.47 |
+0.10% |
|
52 Wk Highs |
54 |
|
|
52 Wk Highs |
91 |
|
|
S&P 600 |
+1.41 |
644.64 |
+0.22% |
|
52 Wk Lows |
136 |
|
|
52 Wk Lows |
37 |
|
|
 |
Major Averages Extended Losses Into the Close
Kenneth J. Gruneisen - Passed the CAN SLIM® Master's Exam
The major averages extended their losses into the closing bell on Thursday. The volume totals were reported lighter on the Nasdaq exchange and on the NYSE. Breadth was negative as decliners led advancers again by almost a 2-1 margin on the NYSE and by a narrower 7-6 margin on the Nasdaq exchange. There were 22 high-ranked companies from the CANSLIM.net Leaders List that made new 52-week highs and appeared on the CANSLIM.net BreakOuts Page, up one notch from a total of 21 stocks on the prior session. Any sustained rally must have leadership, so recently waning new highs totals are a concern coupled with the noted signs of distribution. The list of stocks hitting new 52-week highs still outnumbered new lows on the Nasdaq exchange, but new lows outnumbered new highs on the NYSE. There were gains for only 7 of the 19 high-ranked companies currently included on the Featured Stocks Page.
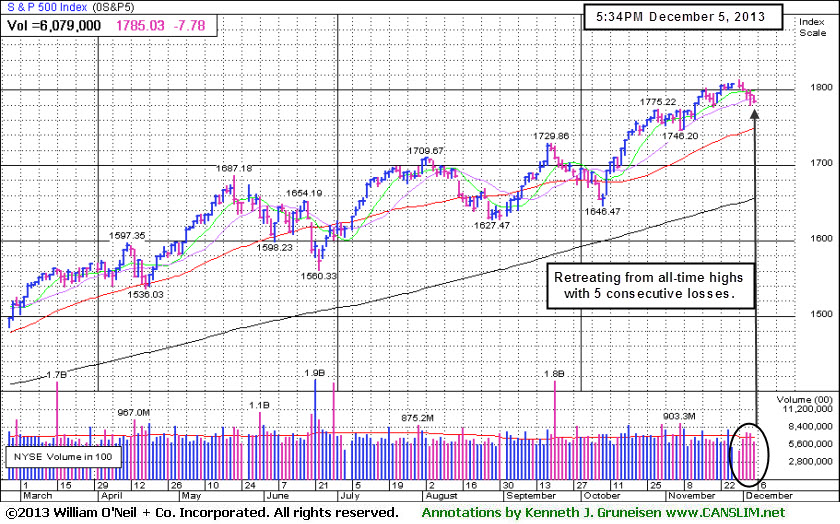
The Dow Jones Industrial Average fell 68 points to 15,821, the S&P 500 gave up 7 points to 1,785 and the NASDAQ shed 4 points with the index closing at 4,033. Stocks were under pressure throughout the session. Significantly better-than-expected reports on third-quarter GDP and weekly jobless claims heightened fears over the timeline for Fed tapering.
Most sectors on the S&P ended lower. Financials showed weakness with Bank of America Corp (BAC -1.28%) down slightly. On the earnings front, Aeropostale Inc (ARO -2.88%) fell after the company posted a wider-than-projected loss in the quarter. Also among retailers, Guess? Inc (GES -2.10%) fell following their disappointing profit tally. In other news, Apple Inc (AAPL +0.5%) edged higher on reports that the company was close to a deal with China Mobile.
Turning to fixed income markets, Treasuries were lower along the curve. The benchmark 10-year note was down 9/32 to yield 2.87% and the 30-year bond was off 3/16 of a point to yield 3.91%.
The Market (M criteria) remains in a confirmed rally, however showing signs of distribution and waning leadership, yet the Dow and S&P 500 Index both remain perched near new all-time highs. As always, any new buying efforts should be selective. The CANSLIM.net Featured Stocks Page shows the most action-worthy candidates and their latest notes and a new Headline Link directs members to the latest detailed analysis with data-packed graphs annotated by a Certified expert along with links to additional resources. The Premium Member Homepage - includes "dynamic archives" to all prior pay reports published. Watch for an announcement via email concerning the next WEBCAST.
PICTURED: The S&P 500 Index has suffered 5 consecutive losses while pulling back from all-time highs.
|
 Kenneth J. Gruneisen started out as a licensed stockbroker in August 1987, a couple of months prior to the historic stock market crash that took the Dow Jones Industrial Average down -22.6% in a single day. He has published daily fact-based fundamental and technical analysis on high-ranked stocks online for two decades. Through FACTBASEDINVESTING.COM, Kenneth provides educational articles, news, market commentary, and other information regarding proven investment systems that work in good times and bad.
Comments contained in the body of this report are technical opinions only and are not necessarily those of Gruneisen Growth Corp. The material herein has been obtained from sources believed to be reliable and accurate, however, its accuracy and completeness cannot be guaranteed. Our firm, employees, and customers may effect transactions, including transactions contrary to any recommendation herein, or have positions in the securities mentioned herein or options with respect thereto. Any recommendation contained in this report may not be suitable for all investors and it is not to be deemed an offer or solicitation on our part with respect to the purchase or sale of any securities. |
|
 |
Bank, Networking, and Semiconductor Indexes Posted Gains
Kenneth J. Gruneisen - Passed the CAN SLIM® Master's Exam
Financial shares were mixed as the Bank Index ($BKX +0.37%) posted a modest gain while the Broker/Dealer Index ($XBD -0.59%) fell. The Networking Index ($NWX +0.85%) led the tech sector while the Semiconductor Index ($SOX +0.23%) posted a smaller gain and the Biotechnology Index ($BTK -0.06%) finished flat. The Retail Index ($RLX -0.17%) ended with a small loss. Energy-related shares had a slightly negative bias as the Integrated Oil Index ($XOI -0.58%) and Oil Services Index ($OSX -0.37%) edged lower. The Gold & Silver Index ($XAU -2.46%) lagged with a large loss.
Charts courtesy www.stockcharts.com
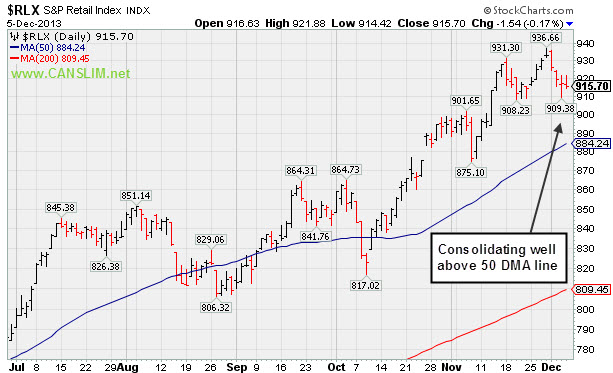
PICTURED: The Retail Index ($RLX -0.17%) is consolidating well above its 50-day moving average (DMA) line.
| Oil Services |
$OSX |
277.77 |
-1.04 |
-0.37% |
+26.17% |
| Integrated Oil |
$XOI |
1,458.75 |
-8.55 |
-0.58% |
+17.47% |
| Semiconductor |
$SOX |
509.95 |
+1.18 |
+0.23% |
+32.78% |
| Networking |
$NWX |
308.41 |
+2.60 |
+0.85% |
+36.13% |
| Broker/Dealer |
$XBD |
151.77 |
-0.90 |
-0.59% |
+60.89% |
| Retail |
$RLX |
915.70 |
-1.54 |
-0.17% |
+40.22% |
| Gold & Silver |
$XAU |
80.97 |
-2.04 |
-2.46% |
-51.11% |
| Bank |
$BKX |
66.47 |
-0.66 |
+0.98% |
+29.62% |
| Biotech |
$BTK |
2,267.34 |
-1.25 |
-0.06% |
+46.56% |
|
|
|
 |
Possible Head-and-Shoulders Top After Distributional Action
Kenneth J. Gruneisen - Passed the CAN SLIM® Master's Exam
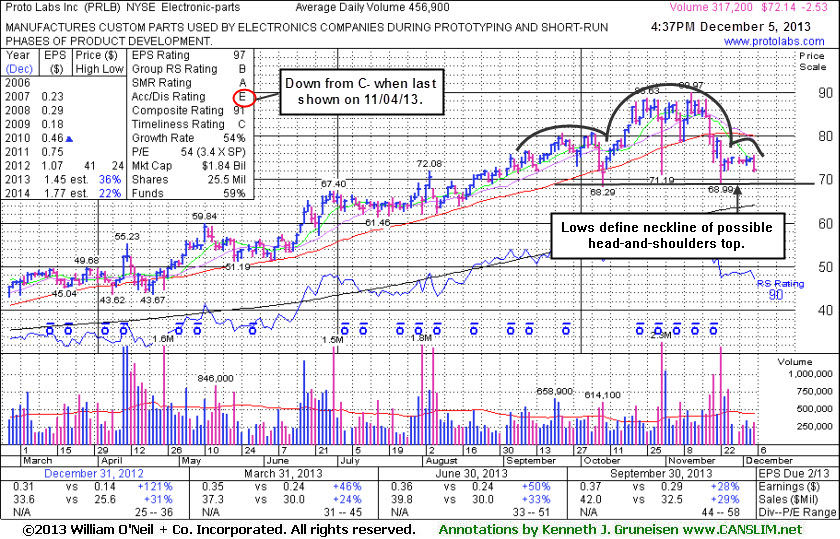
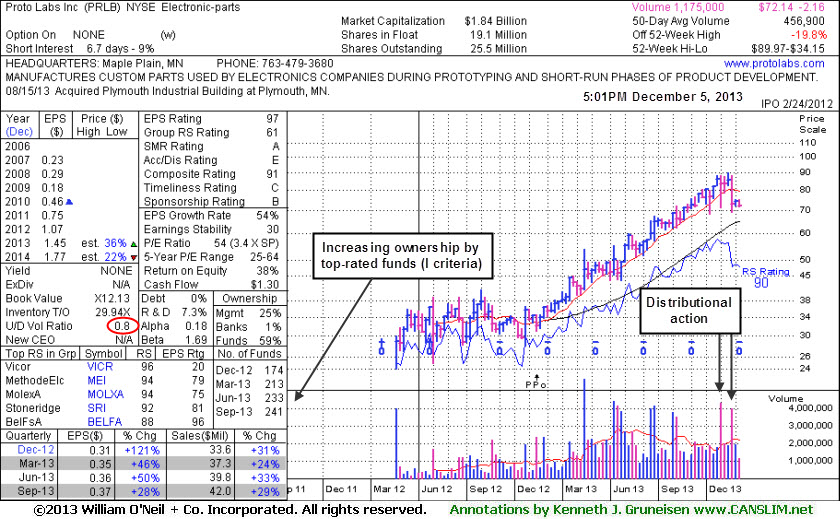
Proto Labs Inc (PRLB -$2.53 or -3.39% to $72.14) has been failing to attract buying demand after slumping well below its 50-day moving average (DMA) line which is now downward sloping and may act as resistance. In recent months it did not form any sound base pattern. It will be dropped from the Featured Stocks list tonight. The annotated daily graph shows a possible "head-and-shoulders" topping pattern forming. Any subsequent violation of support at the prior lows defining the neckline would trigger a worrisome technical sell signal.
Its Accumulation/Distribution rating has slumped from C- to the worst possible E rating since the high-ranked Electronic - Parts firm was last shown in this FSU section on 11/04/13 with annotated graphs under the headline, "Undercut 50-Day Moving Average Yet Found Prompt Support". Its current Up/Down Volume Ratio of 0.8 is an unbiased indication its shares have been under distributional pressure over the past 50 days. PRLB traded up as much as +80% since first featured at $49.97 highlighted in the 4/10/13 mid-day report (read here). The weak action of late has been a sign of profit taking and its outlook only gets worse the longer it lingers below its 50 DMA line, while a rebound above that short-term average is necessary for its outlook to improve.
It reported earnings +28% on +29% sales revenues for the Sep '13 quarter, above the +25% minimum earnings guideline. That continued its strong growth trend satisfying the C criteria and helped it maintain a very high 97 Earnings Per Share rank. Its small supply of only 19.1 million shares (S criteria) in the publicly traded float is ideal, yet it can contribute to greater price volatility in the event of institutional buying or selling. The number of top-rated funds owning its shares rose from 131 in Jun '12 to 241 in Sep '13, a reassuring trend concerning the I criteria.
|
|
|
Color Codes Explained :
Y - Better candidates highlighted by our
staff of experts.
G - Previously featured
in past reports as yellow but may no longer be buyable under the
guidelines.
***Last / Change / Volume data in this table is the closing quote data***
Symbol/Exchange
Company Name
Industry Group |
PRICE |
CHANGE
(%Change) |
Day High |
Volume
(% DAV)
(% 50 day avg vol) |
52 Wk Hi
% From Hi |
Featured
Date |
Price
Featured |
Pivot Featured |
|
Max Buy |
BITA
-
NYSE
Bitauto Hldgs Ltd Ads
INTERNET - Internet Information Providers
|
$30.77
|
-1.19
-3.72% |
$31.96
|
744,863
64.96% of 50 DAV
50 DAV is 1,146,700
|
$35.04
-12.19%
|
9/24/2013
|
$16.40
|
PP = $17.31
|
|
MB = $18.18
|
 Most Recent Note - 12/5/2013 4:02:25 PM
G - Volume totals have been cooling while consolidating and now trading -12% off its 52-week high, still extended from any sound base. Its prior high in the $28 area define initial support to watch on pullbacks.
>>> FEATURED STOCK ARTICLE : Consolidating After Getting Extended From Prior Base - 11/11/2013
View all notes |
Set NEW NOTE alert |
CANSLIM.net Company Profile |
SEC
News |
Chart |
Request a new note
C
A N
S L
I M


|
CELG
-
NASDAQ
Celgene Corp
DRUGS - Drug Manufacturers - Major
|
$164.51
|
+4.44
2.77% |
$166.00
|
3,280,760
115.73% of 50 DAV
50 DAV is 2,834,900
|
$165.74
-0.74%
|
9/12/2013
|
$149.50
|
PP = $150.02
|
|
MB = $157.52
|
Most Recent Note - 12/4/2013 7:01:02 PM
G - Hovering near its 52-week and all-time highs with volume totals cooling. See the latest FSU analysis for more details and a new annotated daily and weekly graphs.
>>> FEATURED STOCK ARTICLE : Cooling Volume Totals While Hovering Near Highs - 12/4/2013
View all notes |
Set NEW NOTE alert |
CANSLIM.net Company Profile |
SEC
News |
Chart |
Request a new note
C
A N
S L
I M
|
EGOV
-
NASDAQ
N I C Inc
INTERNET - Internet Software and Services
|
$23.89
|
+0.46
1.96% |
$24.11
|
178,137
60.63% of 50 DAV
50 DAV is 293,800
|
$25.99
-8.08%
|
10/18/2013
|
$25.17
|
PP = $23.66
|
|
MB = $24.84
|
Most Recent Note - 12/2/2013 6:04:50 PM
G - Down considerably today with near average but higher volume indicative of mild distributional pressure. Disciplined investors always limit losses by selling any stock that falls more than -7% from their purchase price.
>>> FEATURED STOCK ARTICLE : Finding Support Near 50-Day Average During Distributional Pressure - 11/25/2013
View all notes |
Set NEW NOTE alert |
CANSLIM.net Company Profile |
SEC
News |
Chart |
Request a new note
C
A N
S L
I M
|
FLT
-
NYSE
Fleetcor Technologies
DIVERSIFIED SERVICES - Business/Management Services
|
$122.19
|
+0.20
0.16% |
$123.32
|
561,949
68.19% of 50 DAV
50 DAV is 824,100
|
$123.96
-1.43%
|
8/19/2013
|
$99.01
|
PP = $100.97
|
|
MB = $106.02
|
Most Recent Note - 12/3/2013 1:04:59 PM
G - Still hovering at its all-time high, extended from any sound base. A steep upward trendline connecting its Oct-Nov lows defines initial support to watch well above its 50 DMA line ($113.34 now).
>>> FEATURED STOCK ARTICLE : Perched Near All-Time High Tallying Quiet Gains - 11/13/2013
View all notes |
Set NEW NOTE alert |
CANSLIM.net Company Profile |
SEC
News |
Chart |
Request a new note
C
A N
S L
I M
|
GNRC
-
NYSE
Generac Hldgs Inc
CONSUMER DURABLES - Electronic Equipment
|
$52.54
|
-0.26
-0.49% |
$53.22
|
576,659
68.96% of 50 DAV
50 DAV is 836,200
|
$53.74
-2.22%
|
11/26/2013
|
$53.02
|
PP = $52.42
|
|
MB = $55.04
|
Most Recent Note - 11/29/2013 2:46:49 PM
Y - Perched at its 52-week high today. Prior highs in the $52 area define initial support to watch after its breakout from a short flat base with +59% above average volume triggered a new (or-add on) technical buy signal. See the latest FSU analysis for more details and new annotated daily and weekly graphs.
>>> FEATURED STOCK ARTICLE : Following Latest Breakout Prior Highs Define Support - 11/29/2013
View all notes |
Set NEW NOTE alert |
CANSLIM.net Company Profile |
SEC
News |
Chart |
Request a new note
C
A N
S L
I M
|
Symbol/Exchange
Company Name
Industry Group |
PRICE |
CHANGE
(%Change) |
Day High |
Volume
(% DAV)
(% 50 day avg vol) |
52 Wk Hi
% From Hi |
Featured
Date |
Price
Featured |
Pivot Featured |
|
Max Buy |
HLF
-
NYSE
Herbalife Ltd
DRUGS - Nutrition and Weight Management
|
$76.43
|
+0.50
0.66% |
$77.39
|
3,232,765
129.74% of 50 DAV
50 DAV is 2,491,700
|
$76.83
-0.52%
|
11/22/2013
|
$72.21
|
PP = $75.04
|
|
MB = $78.79
|
Most Recent Note - 12/3/2013 1:12:35 PM
Y - Volume is running at an above average pace today while hitting a new 52-week high and trading above its pivot point. Volume must be at least +40% above average when rallying above the pivot point to trigger a proper technical buy signal.
>>> FEATURED STOCK ARTICLE : Perched Near Highs Following Rebound - 11/22/2013
View all notes |
Set NEW NOTE alert |
CANSLIM.net Company Profile |
SEC
News |
Chart |
Request a new note
C
A N
S L
I M
|
JAZZ
-
NASDAQ
Jazz Pharmaceuticals Plc
DRUGS - Biotechnology
|
$114.34
|
-0.04
-0.03% |
$115.18
|
471,664
61.81% of 50 DAV
50 DAV is 763,100
|
$118.80
-3.75%
|
9/30/2013
|
$93.20
|
PP = $89.10
|
|
MB = $93.56
|
Most Recent Note - 12/3/2013 1:14:25 PM
G - Volume totals have been cooling while hovering near its 52-week high, stubbornly holding its ground while extended from any sound base. Prior notes reminded members - "Disciplined investors avoid chasing stocks more than +5% above prior highs and always limit losses by selling any stock that falls more than -7% from their purchase price."
>>> FEATURED STOCK ARTICLE : Hovering Near All-Time Highs Following Volume-Driven Gains - 11/7/2013
View all notes |
Set NEW NOTE alert |
CANSLIM.net Company Profile |
SEC
News |
Chart |
Request a new note
C
A N
S L
I M
|
KORS
-
NYSE
Michael Kors Hldgs Ltd
RETAIL - Apparel Stores
|
$80.76
|
+0.00
0.00% |
$81.12
|
1,741,344
38.84% of 50 DAV
50 DAV is 4,482,900
|
$83.13
-2.86%
|
8/6/2013
|
$69.66
|
PP = $66.28
|
|
MB = $69.59
|
Most Recent Note - 12/4/2013 7:10:41 PM
G - Managed a positive reversal today. Volume totals have still been cooling while hovering in a tight range near all-time highs, stubbornly holding its ground. Prior highs in the $78 area define near-term support above its 50 DMA line.
>>> FEATURED STOCK ARTICLE : Hitting New Highs After Choppy Consolidation - 11/6/2013
View all notes |
Set NEW NOTE alert |
CANSLIM.net Company Profile |
SEC
News |
Chart |
Request a new note
C
A N
S L
I M
|
LOPE
-
NASDAQ
Grand Canyon Education
DIVERSIFIED SERVICES - Education and; Training Services
|
$44.22
|
+0.22
0.50% |
$44.51
|
332,413
80.78% of 50 DAV
50 DAV is 411,500
|
$50.48
-12.40%
|
6/19/2013
|
$31.47
|
PP = $34.17
|
|
MB = $35.88
|
Most Recent Note - 12/3/2013 1:07:13 PM
G - Volume totals have been cooling while consolidating above its 50 DMA line defining near-term support. Repeatedly noted - "Fundamental concerns remain while technical action has been reassuring."
>>> FEATURED STOCK ARTICLE : Fundamental Concerns Noted While Consolidating Above 50-Day Moving Average - 11/26/2013
View all notes |
Set NEW NOTE alert |
CANSLIM.net Company Profile |
SEC
News |
Chart |
Request a new note
C
A N
S L
I M
|
NOAH
-
NYSE
Noah Holdings Ltd Ads
FINANCIAL SERVICES - Asset Management
|
$20.14
|
-0.06
-0.30% |
$20.38
|
364,664
44.11% of 50 DAV
50 DAV is 826,800
|
$25.51
-21.05%
|
10/15/2013
|
$19.10
|
PP = $18.33
|
|
MB = $19.25
|
Most Recent Note - 12/3/2013 1:01:27 PM
G - Still consolidating above its 50 DMA line which acted as support throughout its choppy ascent. Previously noted with caution - "A violation may trigger a technical sell signal. Caution is called for after a worrisome 'negative reversal' occurred at its 52-week high, and it is extended from its latest base."
>>> FEATURED STOCK ARTICLE : 50-Day Average And Prior Highs Define Important Support - 11/20/2013
View all notes |
Set NEW NOTE alert |
CANSLIM.net Company Profile |
SEC
News |
Chart |
Request a new note
C
A N
S L
I M
|
Symbol/Exchange
Company Name
Industry Group |
PRICE |
CHANGE
(%Change) |
Day High |
Volume
(% DAV)
(% 50 day avg vol) |
52 Wk Hi
% From Hi |
Featured
Date |
Price
Featured |
Pivot Featured |
|
Max Buy |
PCLN
-
NASDAQ
Priceline.Com Inc
INTERNET - Internet Software and Services
|
$1,174.39
|
-7.28
-0.62% |
$1,180.94
|
383,705
59.99% of 50 DAV
50 DAV is 639,600
|
$1,198.75
-2.03%
|
9/13/2013
|
$966.82
|
PP = $995.08
|
|
MB = $1,044.83
|
Most Recent Note - 12/4/2013 7:14:03 PM
G - Hovering at its 52-week high with volume totals cooling. It may go on to produce more climactic gains but is currently extended from any sound base pattern. Reported earnings +40% on +33% sales revenues for the Sep '13 quarter versus the year-ago period, improving after a slightly sub par Jun '13 report.
>>> FEATURED STOCK ARTICLE : Extended From Any Sound Base Pattern - 12/3/2013
View all notes |
Set NEW NOTE alert |
CANSLIM.net Company Profile |
SEC
News |
Chart |
Request a new note
C
A N
S L
I M
|
PRLB
-
NYSE
Proto Labs Inc
MANUFACTURING - Small Tools and Accessories
|
$72.14
|
-2.53
-3.39% |
$75.49
|
323,532
70.81% of 50 DAV
50 DAV is 456,900
|
$89.97
-19.82%
|
7/29/2013
|
$64.86
|
PP = $67.50
|
|
MB = $70.88
|
Most Recent Note - 12/5/2013 5:57:37 PM
Slumped further below its 50 DMA line and it will be dropped from the Featured Stocks list tonight. Prior lows in the $68 area define the neckline of a possible head-and-shoulders topping pattern, and any subsequent violation would trigger a worrisome technical sell signal. See the latest FSU analysis for more details and new annotated daily and weekly graphs.
>>> FEATURED STOCK ARTICLE : Possible Head-and-Shoulders Top After Distributional Action - 12/5/2013
View all notes |
Set NEW NOTE alert |
CANSLIM.net Company Profile |
SEC
News |
Chart |
Request a new note
C
A N
S L
I M
|
SFUN
-
NYSE
Soufun Hldgs Ltd Ads A
INTERNET - Internet Information Providers
|
$72.67
|
-1.09
-1.48% |
$73.90
|
1,859,994
123.19% of 50 DAV
50 DAV is 1,509,900
|
$77.45
-6.17%
|
10/17/2013
|
$58.02
|
PP = $53.87
|
|
MB = $56.56
|
Most Recent Note - 12/2/2013 12:52:08 PM
G - Poised for a best-ever close and challenging its all-time high with today's considerable gain. It has not formed a sound base pattern. Disciplined investors avoid chasing extended stocks. Prior highs in the $59 area define initial support to watch on pullbacks.
>>> FEATURED STOCK ARTICLE : Perched Near All-Time High After Testing Support - 11/8/2013
View all notes |
Set NEW NOTE alert |
CANSLIM.net Company Profile |
SEC
News |
Chart |
Request a new note
C
A N
S L
I M
|
SSNC
-
NASDAQ
S S & C Technologies
COMPUTER SOFTWARE and SERVICES - Application Software
|
$42.60
|
+0.50
1.19% |
$43.27
|
241,461
76.90% of 50 DAV
50 DAV is 314,000
|
$43.80
-2.74%
|
10/22/2013
|
$39.17
|
PP = $40.04
|
|
MB = $42.04
|
Most Recent Note - 12/3/2013 1:15:54 PM
G - Slumping back near its "max buy" level with today's pullback on below average volume. Prior highs near $41 define initial support to watch above its 50 DMA line on pullbacks.
>>> FEATURED STOCK ARTICLE : Volume Totals Cooling Following Recent Volume-Driven Breakout - 11/12/2013
View all notes |
Set NEW NOTE alert |
CANSLIM.net Company Profile |
SEC
News |
Chart |
Request a new note
C
A N
S L
I M
|
SSYS
-
NASDAQ
Stratasys Ltd
COMPUTER HARDWARE - Computer Peripherals
|
$120.59
|
-2.23
-1.82% |
$123.44
|
718,617
61.12% of 50 DAV
50 DAV is 1,175,800
|
$134.00
-10.01%
|
10/11/2013
|
$102.94
|
PP = $105.38
|
|
MB = $110.65
|
Most Recent Note - 11/29/2013 2:52:53 PM
G - Consolidating above support at its 50 DMA line and prior highs with volume totals cooling. More damaging losses would raise greater concerns and trigger worrisome technical sell signals. Reported earnings +13% on +153% sales revenues, below the +25% minimum earnings guideline (C criteria) raising fundamental concerns.
>>> FEATURED STOCK ARTICLE : Rallying For New Highs Despite Fundamental Flaw Raising Concern - 11/18/2013
View all notes |
Set NEW NOTE alert |
CANSLIM.net Company Profile |
SEC
News |
Chart |
Request a new note
C
A N
S L
I M
|
Symbol/Exchange
Company Name
Industry Group |
PRICE |
CHANGE
(%Change) |
Day High |
Volume
(% DAV)
(% 50 day avg vol) |
52 Wk Hi
% From Hi |
Featured
Date |
Price
Featured |
Pivot Featured |
|
Max Buy |
STMP
-
NASDAQ
Stamps.Com Inc
INTERNET - Internet Software and Services
|
$44.19
|
-0.79
-1.76% |
$45.31
|
104,350
88.96% of 50 DAV
50 DAV is 117,300
|
$49.40
-10.55%
|
9/24/2013
|
$45.54
|
PP = $46.57
|
|
MB = $48.90
|
Most Recent Note - 12/4/2013 12:37:36 PM
G - Up today, but remaining below its 50 DMA line. Recently testing an upward trendline where any damaging violation may raise more serious concerns. Earnings were +24% on +7% sales revenues for the Sep '13 quarter, just below the +25% minimum earnings guideline (C criteria). See the latest FSU analysis for more details and annotated daily and weekly graphs.
>>> FEATURED STOCK ARTICLE : Upward Trendline and 50-Day Average Define Important Near-Term Support - 12/2/2013
View all notes |
Set NEW NOTE alert |
CANSLIM.net Company Profile |
SEC
News |
Chart |
Request a new note
C
A N
S L
I M
|
ULTI
-
NASDAQ
Ultimate Software Group
INTERNET - Internet Software and Services
|
$153.30
|
-0.34
-0.22% |
$154.49
|
49,888
34.89% of 50 DAV
50 DAV is 143,000
|
$162.88
-5.88%
|
10/16/2013
|
$142.95
|
PP = $151.18
|
|
MB = $158.74
|
Most Recent Note - 12/4/2013 7:09:17 PM
Y - Prior highs and its 50 DMA line define near-term support near the $151 area. Finished near the session high after quietly testing its 50 DMA line today. Volume totals have been cooling while holding its ground near its 52-week high yet below its "max buy" level.
>>> FEATURED STOCK ARTICLE : Consolidating Above 50 DMA Line and Prior Highs Defining Support - 11/21/2013
View all notes |
Set NEW NOTE alert |
CANSLIM.net Company Profile |
SEC
News |
Chart |
Request a new note
C
A N
S L
I M
|
VRX
-
NYSE
Valeant Pharmaceuticals
DRUGS - Drug Manufacturers - Other
|
$106.40
|
-1.50
-1.39% |
$108.56
|
1,196,298
107.85% of 50 DAV
50 DAV is 1,109,200
|
$115.40
-7.79%
|
9/11/2013
|
$100.26
|
PP = $105.50
|
|
MB = $110.78
|
Most Recent Note - 12/4/2013 7:06:40 PM
Y - Still consolidating in a very tight range near its 50 DMA line. Recent lows in the $102 area define near-term support where a violation may trigger a technical sell signal. Resilient after it reported earnings +24% on +74% sales revenues for the Sep '13 quarter, a notch below the +25% minimum guideline (C criteria).
>>> FEATURED STOCK ARTICLE : Recent Lows Define Support to Watch Below 50 Day Average - 11/15/2013
View all notes |
Set NEW NOTE alert |
CANSLIM.net Company Profile |
SEC
News |
Chart |
Request a new note
C
A N
S L
I M
|
YNDX
-
NASDAQ
Yandex N V Class A
INTERNET - Internet Information Providers
|
$40.97
|
+0.88
2.18% |
$41.30
|
2,372,162
92.25% of 50 DAV
50 DAV is 2,571,400
|
$42.00
-2.45%
|
11/27/2013
|
$39.61
|
PP = $42.10
|
|
MB = $44.21
|
Most Recent Note - 12/3/2013 12:54:47 PM
Y - Challenged its 52-week high earlier today with above average volume behind its gain approaching the new pivot point cited based on its 10/22/13 high plus 10 cents. Subsequent volume-driven gains above the pivot point may trigger a new (or add-on) technical buy signal. Prior lows ($35.59 on 11/08/13 and $34.31 on 10/08/13) defines the next important chart support levels to watch. See the latest FSU analysis for more details and annotated daily and weekly graphs.
>>> FEATURED STOCK ARTICLE : Forming New Base Pattern With Little Resistance Remaining - 11/27/2013
View all notes |
Set NEW NOTE alert |
CANSLIM.net Company Profile |
SEC
News |
Chart |
Request a new note
C
A N
S L
I M
|
|
|
|
THESE ARE NOT BUY RECOMMENDATIONS!
Comments contained in the body of this report are technical
opinions only. The material herein has been obtained
from sources believed to be reliable and accurate, however,
its accuracy and completeness cannot be guaranteed.
This site is not an investment advisor, hence it does
not endorse or recommend any securities or other investments.
Any recommendation contained in this report may not
be suitable for all investors and it is not to be deemed
an offer or solicitation on our part with respect to
the purchase or sale of any securities. All trademarks,
service marks and trade names appearing in this report
are the property of their respective owners, and are
likewise used for identification purposes only.
This report is a service available
only to active Paid Premium Members.
You may opt-out of receiving report notifications
at any time. Questions or comments may be submitted
by writing to Premium Membership Services 665 S.E. 10 Street, Suite 201 Deerfield Beach, FL 33441-5634 or by calling 1-800-965-8307
or 954-785-1121.
|
|
|

