You are not logged in.
This means you
CAN ONLY VIEW reports that were published prior to Monday, April 14, 2025.
You
MUST UPGRADE YOUR MEMBERSHIP if you want to see any current reports.
AFTER MARKET UPDATE - THURSDAY, DECEMBER 4TH, 2014
Previous After Market Report Next After Market Report >>>
|
|
|
|
DOW |
-12.52 |
17,900.10 |
-0.07% |
|
Volume |
782,138,890 |
+3% |
|
Volume |
1,586,548,880 |
+1% |
|
NASDAQ |
-5.03 |
4,769.44 |
-0.11% |
|
Advancers |
1,122 |
35% |
|
Advancers |
1,101 |
38% |
|
S&P 500 |
-2.41 |
2,071.92 |
-0.12% |
|
Decliners |
1,974 |
62% |
|
Decliners |
1,706 |
59% |
|
Russell 2000 |
-6.00 |
1,173.01 |
-0.51% |
|
52 Wk Highs |
167 |
|
|
52 Wk Highs |
118 |
|
|
S&P 600 |
-3.02 |
678.39 |
-0.44% |
|
52 Wk Lows |
121 |
|
|
52 Wk Lows |
94 |
|
|
 |
Major Averages Fell With Slightly Higher Volume Totals
Kenneth J. Gruneisen - Passed the CAN SLIM® Master's Exam
Stocks declined on Thursday, but erased losses from intra-day lows. The S&P 500 was off 2 points to 2,071. The NASDAQ fell 5 points to 4,769. There were slightly higher volume totals on the NYSE and on the Nasdaq exchange. Breadth was negative as decliners led advancers by nearly a 2-1 margin on the NYSE and 3-2 on the Nasdaq exchange. There were 74 high-ranked companies from the CANSLIM.net Leaders List that made new 52-week highs and appeared on the CANSLIM.net BreakOuts Page, near the prior session total of 73 stocks. The new 52-week highs totals outnumbered new 52-week lows on both the NYSE and on the Nasdaq exchange. There were 5 gainers among the 11 high-ranked companies currently on the Featured Stocks Page. A "confirmed uptrend" for the market (M criteria) has been repeatedly noted in this daily Market Commentary since large gains were noted on 10/21/14 backed by higher volume totals as leadership (stocks hitting new 52-week highs) expanded.
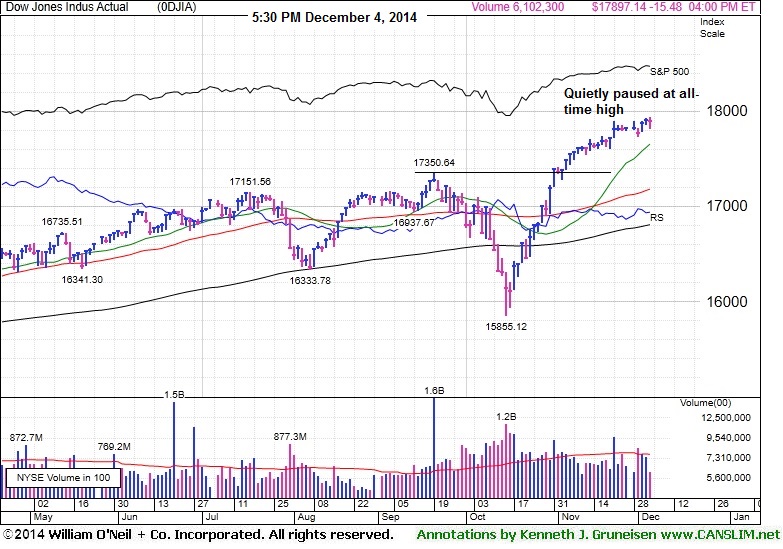
PICTURED: The Dow Jones Industrial Average is quietly perched at its all-time high.
The major averages fell, after the ECB maintained key interest rates, as expected, but lowered GDP and inflation forecasts for 2015. Separately, reports surfaced that the ECB will be preparing a broad-based QE package for their January meeting.
Ahead of tomorrow's jobs report, jobless claims fell 17,000 to 297,000, returning below the important 300,000 level. Tomorrow, expectations are for 230,000 new jobs and unemployment to remain at 5.8%.
Seven of the 10 sectors in the S&P 500 finished lower. Energy was off the most after reports of Saudi price cuts as Exxon (XOM -0.61%) edged lower. Airlines rose on lower fuel costs, but rail companies fell from lower fuel surcharges. United Continental (UAL +4.15%) rallied for an all-time high, meanwhile Norfolk Southern (NSC -4.10%) fell. In M&A Hawaiian Electric (HE +14.3%) was up after accepting a takeout offer.
Treasuries gained with the 10-year note up 12/32 to yield 2.24%. The 30-year bond climbed almost a full point, 30/32, to yield 2.94%.
In commodities WTI crude lost -1% to $66.73/barrel on the NYMEX..
Disciplined investors know that new buying efforts may be made under the fact-based investment system only in stocks meeting all key criteria. The Featured Stocks Page shows the most action-worthy candidates and their latest notes and a Headline Link directs members to the latest detailed analysis with data-packed graphs annotated by a Certified expert along with links to additional resources. The Premium Member Homepage includes "dynamic archives" to all prior pay reports published.
|
 Kenneth J. Gruneisen started out as a licensed stockbroker in August 1987, a couple of months prior to the historic stock market crash that took the Dow Jones Industrial Average down -22.6% in a single day. He has published daily fact-based fundamental and technical analysis on high-ranked stocks online for two decades. Through FACTBASEDINVESTING.COM, Kenneth provides educational articles, news, market commentary, and other information regarding proven investment systems that work in good times and bad.
Comments contained in the body of this report are technical opinions only and are not necessarily those of Gruneisen Growth Corp. The material herein has been obtained from sources believed to be reliable and accurate, however, its accuracy and completeness cannot be guaranteed. Our firm, employees, and customers may effect transactions, including transactions contrary to any recommendation herein, or have positions in the securities mentioned herein or options with respect thereto. Any recommendation contained in this report may not be suitable for all investors and it is not to be deemed an offer or solicitation on our part with respect to the purchase or sale of any securities. |
|
 |
Tech and Commodity Linked Groups Ended Lower
Kenneth J. Gruneisen - Passed the CAN SLIM® Master's Exam
The Retail Index ($RLX +0.12%) inched higher and the financial group ended slightly higher as the Bank Index ($BKX +0.14%) and Broker/Dealer Index ($XBD +0.30%) both posted small gains on Thursday. The Networking Index ($NWX -0.70%) and the Biotechnology Index ($BTK -0.65%) both ended modestly lower and created a drag for the tech sector while the Semiconductor Index ($SOX +0.13%) managed to eke out a small gain. The Integrated Oil Index ($XOI -0.33%) and the Oil Services Index ($OSX -0.31%) both edged lower. The Gold & Silver Index ($XAU -2.20%) was a standout decliner.
Charts courtesy www.stockcharts.com
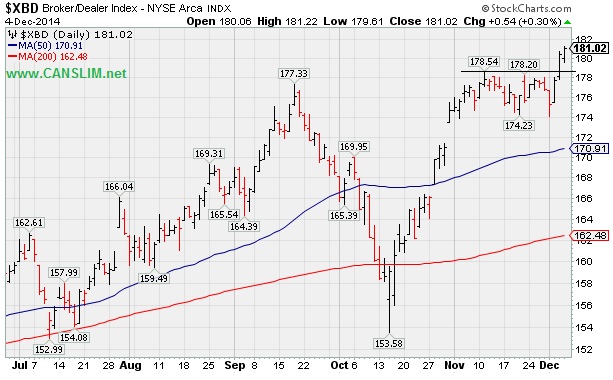
PICTURED: The Broker/Dealer Index ($XBD +0.30%) hit a new 2014 with a 3rd consecutive gain.
| Oil Services |
$OSX |
215.14 |
-0.67 |
-0.31% |
-23.45% |
| Integrated Oil |
$XOI |
1,383.92 |
-4.57 |
-0.33% |
-7.93% |
| Semiconductor |
$SOX |
696.16 |
+0.88 |
+0.13% |
+30.12% |
| Networking |
$NWX |
348.88 |
-2.44 |
-0.70% |
+7.70% |
| Broker/Dealer |
$XBD |
181.02 |
+0.54 |
+0.30% |
+12.74% |
| Retail |
$RLX |
1,000.37 |
+1.23 |
+0.12% |
+6.44% |
| Gold & Silver |
$XAU |
71.46 |
-1.61 |
-2.20% |
-15.08% |
| Bank |
$BKX |
73.20 |
+0.10 |
+0.14% |
+5.69% |
| Biotech |
$BTK |
3,427.66 |
-22.39 |
-0.65% |
+47.08% |
|
|
|
 |
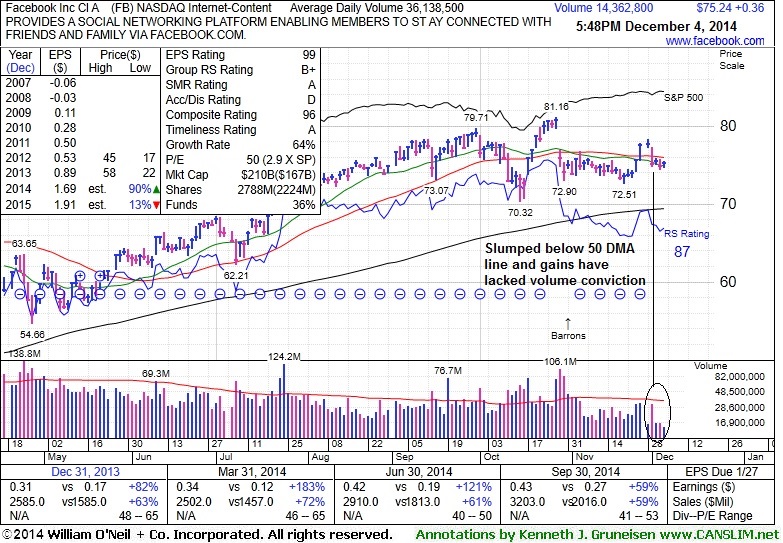
Gains Above 50-Day Moving Average Needed for Outlook to Improve
Kenneth J. Gruneisen - Passed the CAN SLIM® Master's Exam
Facebook Inc (FB +$0.36 or +0.48% to $75.24) has recently been slumping back below its 50-day moving average (DMA) line, hurting its technical stance and near-term outlook. Recent gains have lacked volume conviction. A rebound above the 50 DMA line is needed for its outlook to improve. The high-ranked Internet - Content firm was last shown in this FSU section on 11/14/14 with annotated graphs under the headline, "Following Violation 50-Day Average Acted as Resistance". A violation on 3 times average volume on 10/29/14 raised concerns and triggered a technical sell signal. Disciplined investors avoid chasing stocks more than +5% above their pivot point and always limit losses by selling any stock that falls more than -7% from their purchase price.
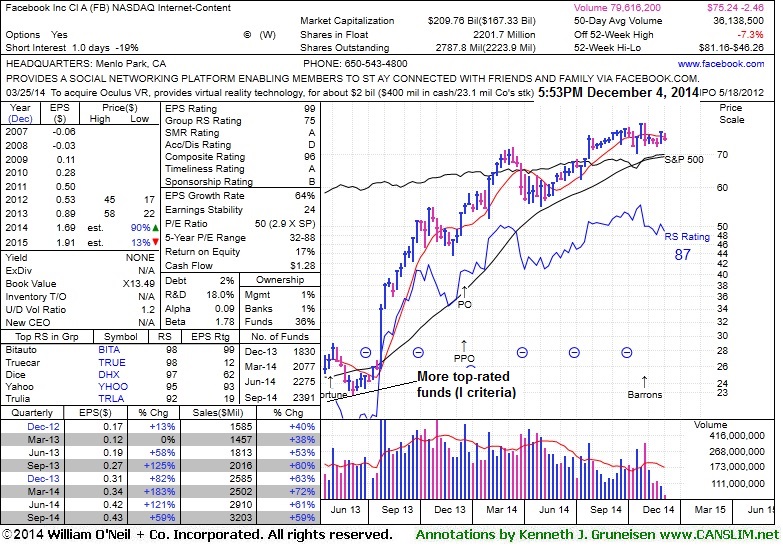
The company reported earnings +59% on +59% sales revenues for the Sep '14 quarter but warned of rising costs. That marked its 6th consecutive quarterly comparison with earnings increasing well above the +25% minimum (C criteria). Its current Up/Down Volume Ratio of 1.2 is still an unbiased indication its shares have been under some accumulation over the past 50 days. The high-ranked Internet - Content group leader has seen the number of top-rated funds owning its shares rise from 1,116 in Dec '12 to 2,391 in Sep '14, a reassuring sign concerning the I criteria. Members were previously warned - "Keep in mind that its large supply of 2.54 billion shares in the public float makes it an unlikely sprinter, especially as it is already well known by the institutional crowd and the general public."
|
|
|
Color Codes Explained :
Y - Better candidates highlighted by our
staff of experts.
G - Previously featured
in past reports as yellow but may no longer be buyable under the
guidelines.
***Last / Change / Volume data in this table is the closing quote data***
Symbol/Exchange
Company Name
Industry Group |
PRICE |
CHANGE
(%Change) |
Day High |
Volume
(% DAV)
(% 50 day avg vol) |
52 Wk Hi
% From Hi |
Featured
Date |
Price
Featured |
Pivot Featured |
|
Max Buy |
ACT
-
NYSE
Actavis plc
Medical-Generic Drugs
|
$267.50
|
+1.66
0.62% |
$267.97
|
2,373,109
75.79% of 50 DAV
50 DAV is 3,131,000
|
$272.75
-1.92%
|
6/20/2014
|
$216.53
|
PP = $230.87
|
|
MB = $242.41
|
Most Recent Note - 12/1/2014 6:34:20 PM
G - Quietly consolidating after spiking to new 52-week highs with volume-driven gains following news it plans to acquire Allergan (AGN) for $66 Billion. Did not form a sound base, and it is extended from prior highs in the $249 area defining near-term support.
>>> FEATURED STOCK ARTICLE : Perched at Highs Following Spike on Acquisition Plans - 11/24/2014
View all notes |
Set NEW NOTE alert |
CANSLIM.net Company Profile |
SEC
News |
Chart |
Request a new note
C
A N
S L
I M


|
AFSI
-
NASDAQ
Amtrust Financial Svcs
INSURANCE - Property and; Casualty Insurance
|
$52.55
|
-0.96
-1.79% |
$55.30
|
987,252
96.60% of 50 DAV
50 DAV is 1,022,000
|
$53.85
-2.41%
|
10/17/2014
|
$45.24
|
PP = $46.02
|
|
MB = $48.32
|
Most Recent Note - 12/3/2014 3:42:10 PM
G - Touching a new 52-week high with today's gain on light volume, rising from a brief consolidation, not a sound base. Prior highs near $46 coincide with its 50 DMA line defining important near-term support.
>>> FEATURED STOCK ARTICLE : No Sound Base Formed, Yet Little Resistance Remains - 11/21/2014
View all notes |
Set NEW NOTE alert |
CANSLIM.net Company Profile |
SEC
News |
Chart |
Request a new note
C
A N
S L
I M
|
ALXN
-
NASDAQ
Alexion Pharmaceuticals
DRUGS - Drug Manufacturers - Other
|
$197.66
|
-1.22
-0.61% |
$199.97
|
512,866
44.17% of 50 DAV
50 DAV is 1,161,000
|
$203.30
-2.77%
|
10/23/2014
|
$184.01
|
PP = $185.53
|
|
MB = $194.81
|
Most Recent Note - 12/2/2014 5:37:48 PM
G - Rallied to new highs today with a volume-driven gain from a brief consolidation, not a sufficient length base. Recent lows near $185 define initial support to watch above its 50 DMA line.
>>> FEATURED STOCK ARTICLE : Quietly Consolidating Near All-Time High - 11/28/2014
View all notes |
Set NEW NOTE alert |
CANSLIM.net Company Profile |
SEC
News |
Chart |
Request a new note
C
A N
S L
I M
|
BIDU
-
NASDAQ
Baidu Inc Ads
INTERNET - Internet Information Providers
|
$230.81
|
-0.48
-0.21% |
$234.70
|
2,483,722
67.20% of 50 DAV
50 DAV is 3,696,000
|
$251.99
-8.41%
|
10/30/2014
|
$234.08
|
PP = $231.51
|
|
MB = $243.09
|
Most Recent Note - 12/3/2014 5:21:04 PM
Y - Consolidating near prior highs and its 50 DMA line defining important near-term support to watch. See the latest FSU analysis for more details and new annotated graphs.
>>> FEATURED STOCK ARTICLE : Consolidating Near Prior Highs and Above 50-Day Average - 12/3/2014
View all notes |
Set NEW NOTE alert |
CANSLIM.net Company Profile |
SEC
News |
Chart |
Request a new note
C
A N
S L
I M
|
EPAM
-
NYSE
Epam Systems Inc
COMPUTER SOFTWARE and SERVICES - Information Technology Service
|
$49.99
|
+0.27
0.54% |
$50.08
|
193,385
47.87% of 50 DAV
50 DAV is 404,000
|
$52.29
-4.40%
|
10/23/2014
|
$45.21
|
PP = $46.09
|
|
MB = $48.39
|
Most Recent Note - 12/1/2014 6:41:26 PM
G - Pulled back today on higher (but below average) volume. Prior highs in the $44 area define support along with its 50 DMA line ($45.50).
>>> FEATURED STOCK ARTICLE : Quiet Gain For New High Close - 11/26/2014
View all notes |
Set NEW NOTE alert |
CANSLIM.net Company Profile |
SEC
News |
Chart |
Request a new note
C
A N
S L
I M
|
Symbol/Exchange
Company Name
Industry Group |
PRICE |
CHANGE
(%Change) |
Day High |
Volume
(% DAV)
(% 50 day avg vol) |
52 Wk Hi
% From Hi |
Featured
Date |
Price
Featured |
Pivot Featured |
|
Max Buy |
FB
-
NASDAQ
Facebook Inc Cl A
INTERNET
|
$75.24
|
+0.36
0.48% |
$75.55
|
14,364,678
39.75% of 50 DAV
50 DAV is 36,138,000
|
$81.16
-7.29%
|
9/9/2014
|
$76.67
|
PP = $76.84
|
|
MB = $80.68
|
 Most Recent Note - 12/4/2014 6:13:51 PM
G - Recent gains lacked volume conviction. Needs gains above the 50 DMA line for its outlook to improve. See the latest FSU analysis for more details new annotated graphs.
>>> FEATURED STOCK ARTICLE : Gains Above 50-Day Moving Average Needed for Outlook to Improve - 12/4/2014
View all notes |
Set NEW NOTE alert |
CANSLIM.net Company Profile |
SEC
News |
Chart |
Request a new note
C
A N
S L
I M
|
FLT
-
NYSE
Fleetcor Technologies
DIVERSIFIED SERVICES - Business/Management Services
|
$149.68
|
+0.41
0.27% |
$151.16
|
434,593
58.02% of 50 DAV
50 DAV is 749,000
|
$160.40
-6.68%
|
10/31/2014
|
$148.50
|
PP = $146.29
|
|
MB = $153.60
|
Most Recent Note - 12/1/2014 12:11:22 PM
Y - Color code is changed to yellow while undercutting prior highs in the $146-149 area raising concerns with a big loss today on higher volume, testing support at its 50 DMA line. More damaging losses may trigger a worrisome technical sell signal.
>>> FEATURED STOCK ARTICLE : Consolidation Continues Above Prior Highs - 11/18/2014
View all notes |
Set NEW NOTE alert |
CANSLIM.net Company Profile |
SEC
News |
Chart |
Request a new note
C
A N
S L
I M
|
ILMN
-
NASDAQ
Illumina Inc
DRUGS - Biotechnology
|
$190.83
|
-0.42
-0.22% |
$195.07
|
1,161,939
95.32% of 50 DAV
50 DAV is 1,219,000
|
$197.37
-3.31%
|
10/22/2014
|
$188.77
|
PP = $182.27
|
|
MB = $191.38
|
Most Recent Note - 12/1/2014 6:44:33 PM
Y - Volume totals have been cooling while consolidating well above prior highs near $182 and above its 50 DMA line. Damaging losses below those levels would raise concerns and trigger technical sell signals.
>>> FEATURED STOCK ARTICLE : Quietly Consolidating Back Below "Max Buy" Level - 11/25/2014
View all notes |
Set NEW NOTE alert |
CANSLIM.net Company Profile |
SEC
News |
Chart |
Request a new note
C
A N
S L
I M
|
NBCB
-
NASDAQ
First N B C Bank Hldg
Banks-Southeast
|
$34.38
|
-0.27
-0.78% |
$34.86
|
85,376
10.51% of 50 DAV
50 DAV is 812,000
|
$38.18
-9.95%
|
10/31/2014
|
$36.31
|
PP = $35.93
|
|
MB = $37.73
|
Most Recent Note - 12/2/2014 12:44:50 PM
Y - Volume-driven loss on the prior session raised concerns. Undercut prior highs near $34 and its 50 DMA line briefly today then found prompt support and managed an encouraging "positive reversal". More damaging losses would raise serious concerns and trigger a worrisome technical sell signal.
>>> FEATURED STOCK ARTICLE : Fifth Consecutive Loss While Retreating From Highs - 11/19/2014
View all notes |
Set NEW NOTE alert |
CANSLIM.net Company Profile |
SEC
News |
Chart |
Request a new note
C
A N
S L
I M
|
PANW
-
NYSE
Palo Alto Networks
Computer Sftwr-Security
|
$118.29
|
-0.29
-0.24% |
$120.38
|
910,292
45.56% of 50 DAV
50 DAV is 1,998,000
|
$123.22
-4.00%
|
7/30/2014
|
$84.21
|
PP = $85.88
|
|
MB = $90.17
|
Most Recent Note - 12/1/2014 6:36:10 PM
G - Pulled back from all-time highs with higher volume today. It did not form a sound base, and the 50 DMA line defines near-term support to watch. Reported earnings +88% on +50% sales revenues for the Oct '14 quarter. See the latest FSU analysis for more details and new annotated graphs.
>>> FEATURED STOCK ARTICLE : Under Accumulation But Extended From Sound Base - 12/1/2014
View all notes |
Set NEW NOTE alert |
CANSLIM.net Company Profile |
SEC
News |
Chart |
Request a new note
C
A N
S L
I M
|
Symbol/Exchange
Company Name
Industry Group |
PRICE |
CHANGE
(%Change) |
Day High |
Volume
(% DAV)
(% 50 day avg vol) |
52 Wk Hi
% From Hi |
Featured
Date |
Price
Featured |
Pivot Featured |
|
Max Buy |
STRT
-
NASDAQ
Strattec Security Corp
AUTOMOTIVE - Auto Parts
|
$101.56
|
+0.05
0.05% |
$103.90
|
33,505
134.02% of 50 DAV
50 DAV is 25,000
|
$110.96
-8.47%
|
11/20/2014
|
$105.76
|
PP = $109.54
|
|
MB = $115.02
|
Most Recent Note - 12/2/2014 5:39:11 PM
Y - Fell for a 5th consecutive loss on even higher volume today, a sign of distributional pressure. After forming an advanced "3-weeks tight" base it has not produced the volume-driven gains for new highs needed to trigger a new (or add-on) technical buy signal. Prior highs coincide with its 50 DMA line defining important near-term support to watch on pullbacks.
>>> FEATURED STOCK ARTICLE : Formed New Advanced "3-Weeks Tight" Base - 11/20/2014
View all notes |
Set NEW NOTE alert |
CANSLIM.net Company Profile |
SEC
News |
Chart |
Request a new note
C
A N
S L
I M
|
|
|
|
THESE ARE NOT BUY RECOMMENDATIONS!
Comments contained in the body of this report are technical
opinions only. The material herein has been obtained
from sources believed to be reliable and accurate, however,
its accuracy and completeness cannot be guaranteed.
This site is not an investment advisor, hence it does
not endorse or recommend any securities or other investments.
Any recommendation contained in this report may not
be suitable for all investors and it is not to be deemed
an offer or solicitation on our part with respect to
the purchase or sale of any securities. All trademarks,
service marks and trade names appearing in this report
are the property of their respective owners, and are
likewise used for identification purposes only.
This report is a service available
only to active Paid Premium Members.
You may opt-out of receiving report notifications
at any time. Questions or comments may be submitted
by writing to Premium Membership Services 665 S.E. 10 Street, Suite 201 Deerfield Beach, FL 33441-5634 or by calling 1-800-965-8307
or 954-785-1121.
|
|
|

