You are not logged in.
This means you
CAN ONLY VIEW reports that were published prior to Sunday, April 20, 2025.
You
MUST UPGRADE YOUR MEMBERSHIP if you want to see any current reports.
AFTER MARKET UPDATE - TUESDAY, DECEMBER 4TH, 2012
Previous After Market Report Next After Market Report >>>
|
|
|
|
DOW |
-13.82 |
12,951.78 |
-0.11% |
|
Volume |
674,586,160 |
+2% |
|
Volume |
1,703,498,950 |
+5% |
|
NASDAQ |
-5.51 |
2,996.69 |
-0.18% |
|
Advancers |
1,444 |
46% |
|
Advancers |
1,169 |
45% |
|
S&P 500 |
-2.41 |
1,407.05 |
-0.17% |
|
Decliners |
1,544 |
49% |
|
Decliners |
1,295 |
50% |
|
Russell 2000 |
+1.32 |
822.12 |
+0.16% |
|
52 Wk Highs |
62 |
|
|
52 Wk Highs |
32 |
|
|
S&P 600 |
+1.02 |
462.84 |
+0.22% |
|
52 Wk Lows |
15 |
|
|
52 Wk Lows |
40 |
|
|
 |
Major Averages Edged Lower With Slightly Negative Breadth
Kenneth J. Gruneisen - Passed the CAN SLIM® Master's Exam
The major averages finished with small losses on Tuesday, yet the small cap indexes posted small gains. Volume totals were slightly higher than the prior session on the Nasdaq exchange and on the NYSE. Decliners narrowly led advancers on the NYSE and on the Nasdaq exchange. The total number of stocks hitting new 52-week highs outnumbered new 52-week lows on the NYSE, however new lows outnumbered new highs on the Nasdaq exchange. There were 29 high-ranked companies from the CANSLIM.net Leaders List making new 52-week highs and appearing on the CANSLIM.net BreakOuts Page, down from the prior session total of 53 stocks. Any sustainable rally requires a healthy crop of companies hitting new 52-week highs, so it is important for leadership to remain present. There were gains for 5 of the 11 high-ranked companies currently included on the Featured Stocks Page.
The markets are searching for direction amid ongoing budget negotiations in Washington after the White House rejected the Republican proposal for solving the fiscal cliff. In an interview today, President Obama said he is willing to compromise, but held firm on higher taxes for wealthy Americans. Euro zone news is also in focus as finance ministers discuss moves to stem its debt crisis. In addition, regional leaders voiced their confidence for Greece's bond buyback which may help pave the way for continued aid payouts.
Earnings results were also in the spotlight. Darden Restaurants Inc (DRI -9.58%) traded down after posting disappointing earnings. Toll Brothers Inc (TOL -1.76%) ended lower after initially trading up following its better-than-expected profit tally, thanks to an increase in revenue and a tax benefit. Big Lots Inc (BIG +11.52%) failed to top earnings estimates, but its shares rallied after boosting its full-year guidance. On the downside, AutoZone Inc (AZO -2.97%) shares sputtered as same-store sales growth weakened. Among other company news, Oracle (ORCL +0.22%) edged higher after announcing that it will accelerate dividend payments for the next three quarters ahead of next year's potential tax increase. Telecom was the laggard on the session as Verizon Communications Inc (VZ -0.98%) declined. Industrials and health care were best performing sectors. Railroad Norfolk Southern Corp (NSC +1.31%) chugged higher. Edward Lifesciences Corp (EW +5.76%) climbed after increasing its earnings forecast for next year. Netflix Inc (NFLX +14.02%) climbed after The Walt Disney Co (DIS +0.02%) agreed to give the company exclusive TV rights for its movies.
Treasuries were higher with the 10-year note up 1/8 of a point to yield 1.60%.
The market direction (M criteria) is currently a "confirmed uptrend" and new buying efforts may be justified only in worthy high-ranked leaders. See the noteworthy companies included on the Featured Stocks Page.
Watch for an announcement via email concerning the next WEBCAST. The webcast will also be available via an updated link highlighted at the top of the Premium Member Homepage.
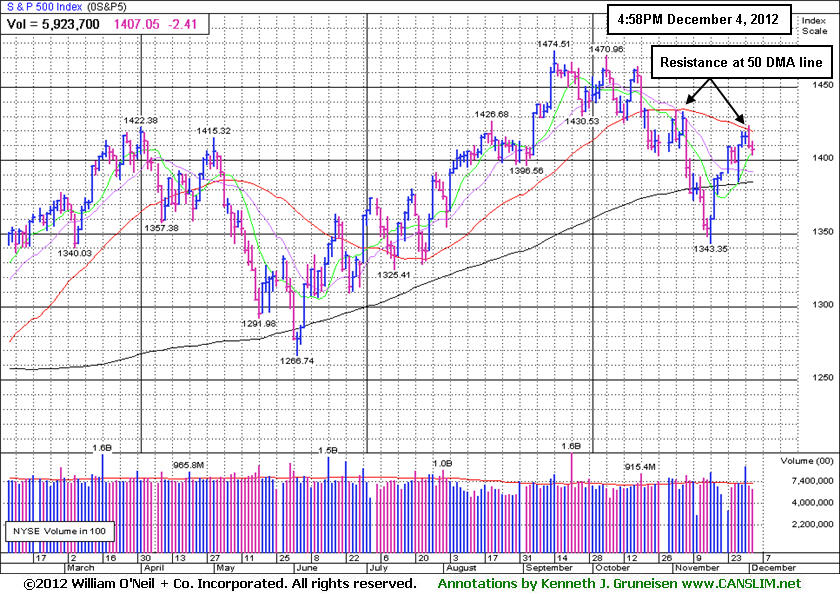
PICTURED: The S&P 500 Index has recently encountered resistance at its downward sloping 50-day moving average (DMA) line. A rally above that important short-term average would help its technical stance improve meaningfully. Meanwhile, it would be reassuring for it to avoid another trip below its 200 DMA line.
|
 Kenneth J. Gruneisen started out as a licensed stockbroker in August 1987, a couple of months prior to the historic stock market crash that took the Dow Jones Industrial Average down -22.6% in a single day. He has published daily fact-based fundamental and technical analysis on high-ranked stocks online for two decades. Through FACTBASEDINVESTING.COM, Kenneth provides educational articles, news, market commentary, and other information regarding proven investment systems that work in good times and bad.
Comments contained in the body of this report are technical opinions only and are not necessarily those of Gruneisen Growth Corp. The material herein has been obtained from sources believed to be reliable and accurate, however, its accuracy and completeness cannot be guaranteed. Our firm, employees, and customers may effect transactions, including transactions contrary to any recommendation herein, or have positions in the securities mentioned herein or options with respect thereto. Any recommendation contained in this report may not be suitable for all investors and it is not to be deemed an offer or solicitation on our part with respect to the purchase or sale of any securities. |
|
 |
Retail Group Pulls Back After Encouraging Rally to 2012 Highs
Kenneth J. Gruneisen - Passed the CAN SLIM® Master's Exam
A slightly negative bias for financial shares dragged the Bank Index ($BKX -0.66%) and Broker/Dealer Index ($XBD -0.25%) lower, and weakness from the Retail Index ($RLX -0.60%) also limited the major averages ability to make any progress on Tuesday. The energy group was mixed as the Oil Services Index ($OSX +1.00%) rose and the Integrated Oil Index ($XOI -0.34%) edged lower. The Healthcare Index ($HMO -0.03%), Biotechnology Index ($BTK +0.04%), and the Gold & Silver Index ($XAU +0.07%) ended virtually unchanged. The Networking Index ($NWX +1.53%) led the tech sector while the Semiconductor Index ($SOX +0.67%) posted a smaller gain and the Internet Index ($IIX +0.14%) edged higher.
Charts courtesy www.stockcharts.com
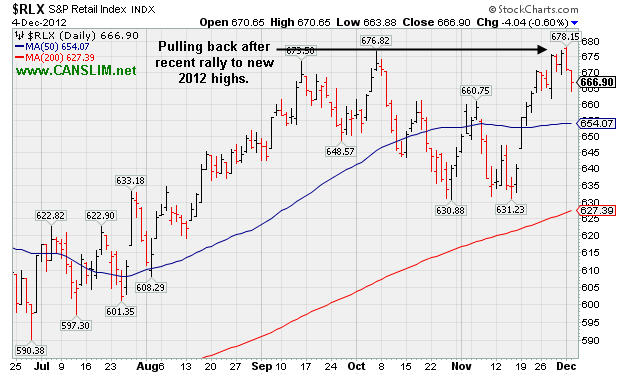
PICTURED: The Retail Index ($RLX -0.60%) is pulling back after recently managing to rally to new 2012 highs. Since consumer spending accounts for roughly 2/3 of the US economy, the recent resilience and strength in the retail group is an encouraging sign.
| Oil Services |
$OSX |
219.99 |
+2.18 |
+1.00% |
+1.72% |
| Healthcare |
$HMO |
2,486.45 |
-0.63 |
-0.03% |
+8.98% |
| Integrated Oil |
$XOI |
1,205.13 |
-4.07 |
-0.34% |
-1.95% |
| Semiconductor |
$SOX |
375.03 |
+2.49 |
+0.67% |
+2.91% |
| Networking |
$NWX |
213.45 |
+3.22 |
+1.53% |
-0.80% |
| Internet |
$IIX |
319.96 |
+0.44 |
+0.14% |
+13.57% |
| Broker/Dealer |
$XBD |
86.78 |
-0.22 |
-0.25% |
+4.21% |
| Retail |
$RLX |
666.90 |
-4.04 |
-0.60% |
+27.47% |
| Gold & Silver |
$XAU |
166.97 |
+0.12 |
+0.07% |
-7.57% |
| Bank |
$BKX |
47.84 |
-0.32 |
-0.66% |
+21.48% |
| Biotech |
$BTK |
1,528.87 |
+0.55 |
+0.04% |
+40.08% |
|
|
|
 |
Recent Resilience and Strength Creates New Set-Up
Kenneth J. Gruneisen - Passed the CAN SLIM® Master's Exam
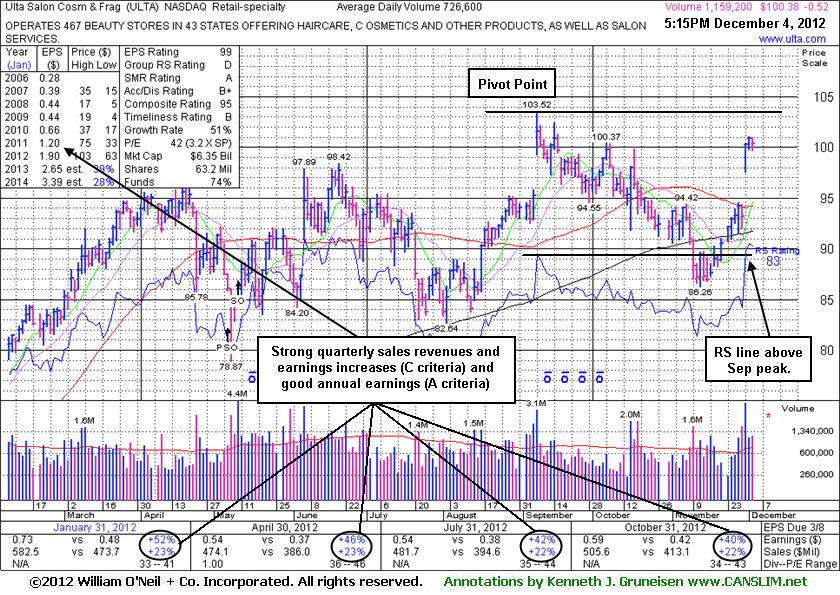
Ulta Salon Cosmetics & Fragrance, Inc. (ULTA -$0.52 or -0.52% to $100.38) was highlighted in yellow with new pivot point based on its 9/07/12 high plus 10 cents in the earlier mid-day report (read here). Disciplined investors will watch for volume-driven gains above the pivot point to trigger a new technical buy signal, as it could spend a lot more time basing. Meanwhile, other stocks that have broken out but are not too extended from sound bases could be better choices to consider.
ULTA reported earnings +40% on +22% sales for the Oct '12 quarter. Its strong quarterly earnings increases above the +25% guideline in the 10 latest comparisons satisfies the C criteria, and its solid annual earnings (A criteria) history is also very reassuring. The number of top-rated funds with an ownership interest has grown from 515 funds in Dec '11 to 606 funds as of Sep '12, which is a very encouraging sign of increasing institutional interest (the I criteria).
It sputtered after last shown in this FSU section on 11/05/12 with an annotated graph under the headline, "Relative Strength Rating Has Slipped Under Minimum Guideline". Based on weak action it was dropped from the Featured Stocks list on 11/08/12, yet it has rebounded impressively after the recent consolidation undercut its 200 DMA line. Now it faces very little resistance due to overhead supply in the $100-103 range.
It gapped up above its 50-day moving average (DMA) line on 11/30/12, and the rebound above that important short-term average quickly helped its technical stance improve. Meanwhile, its Relative Strength Rating has improved to 83, above the 80+ minimum guideline for buy candidates under the fact-based investment system. Its RS line (the jagged blue line) has also cleared its September high, which is an encouraging sign, but it still was plotted higher earlier this year while we previously observed - "Big market winners the fact-based investment system has identified in the past more often saw their Relative Strength lines lead the way into new high territory first, before the stock's price technically broke into new high territory. In this case, it is fair to say that the stock's RS line did not confirm the move into new high territory. For now, that gives investors a reason to be cautious until more convincing signs of fresh institutional accumulation emerge. Disciplined investors always limit losses if ever any stock falls -7% or more from their purchase price."
|
|
|
Color Codes Explained :
Y - Better candidates highlighted by our
staff of experts.
G - Previously featured
in past reports as yellow but may no longer be buyable under the
guidelines.
***Last / Change / Volume data in this table is the closing quote data***
Symbol/Exchange
Company Name
Industry Group |
PRICE |
CHANGE
(%Change) |
Day High |
Volume
(% DAV)
(% 50 day avg vol) |
52 Wk Hi
% From Hi |
Featured
Date |
Price
Featured |
Pivot Featured |
|
Max Buy |
CFNL
-
NASDAQ
Cardinal Financial Corp
BANKING - Regional - Southeast Banks
|
$15.70
|
+0.24
1.55% |
$15.75
|
159,949
83.66% of 50 DAV
50 DAV is 191,200
|
$16.21
-3.15%
|
12/3/2012
|
$15.20
|
PP = $16.31
|
|
MB = $17.13
|
Most Recent Note - 12/3/2012 11:57:33 AM
Y - Color code is changed to yellow with a new pivot point cited based on its 11/06/12 high while still building on a short base-on-base pattern. Recently consolidating above prior highs and its 50 DMA line defining near-term chart support where violations may trigger technical sell signals. Volume-driven gains above its pivot point may trigger a new (or add-on) technical buy signal.
>>> The latest Featured Stock Update with an annotated graph appeared on 11/20/2012. Click here.
View all notes |
Alert me of new notes |
CANSLIM.net Company Profile |
SEC |
Zacks Reports |
StockTalk |
News |
Chart |
Request a new note
C
A N
S L
I M


|
CMCSA
-
NASDAQ
Comcast Corp Cl A
MEDIA - CATV Systems
|
$37.20
|
+0.12
0.32% |
$37.25
|
10,301,355
83.41% of 50 DAV
50 DAV is 12,349,800
|
$37.96
-2.00%
|
12/3/2012
|
$37.08
|
PP = $38.06
|
|
MB = $39.96
|
Most Recent Note - 12/3/2012 4:59:48 PM
Y - Color code is changed to yellow with new pivot point cited based on its 11/02/12 high plus 10 cents while currently building on a short flat base. Subsequent volume-driven gains above the pivot point may trigger a new (or add-on) technical buy signal.
>>> The latest Featured Stock Update with an annotated graph appeared on 11/19/2012. Click here.
View all notes |
Alert me of new notes |
CANSLIM.net Company Profile |
SEC |
Zacks Reports |
StockTalk |
News |
Chart |
Request a new note
C
A N
S L
I M
|
GPX
-
NYSE
G P Strategies Corp
DIVERSIFIED SERVICES - Education and Training Services
|
$19.60
|
-0.26
-1.31% |
$19.87
|
61,540
103.26% of 50 DAV
50 DAV is 59,600
|
$21.44
-8.58%
|
10/8/2012
|
$20.00
|
PP = $20.77
|
|
MB = $21.81
|
Most Recent Note - 12/3/2012 5:02:32 PM
G - It negated the recent technical breakout and encountered distributional pressure yet finished near the session high after undercutting its 50 DMA line today. Earnings +0% on +12% sales revenues for the Sep '12 quarter, below the +25% minimum earnings guideline (C criteria) raised fundamental concerns.
>>> The latest Featured Stock Update with an annotated graph appeared on 11/15/2012. Click here.
View all notes |
Alert me of new notes |
CANSLIM.net Company Profile |
SEC |
Zacks Reports |
StockTalk |
News |
Chart |
Request a new note
C
A N
S L
I M
|
LKQ
-
NASDAQ
L K Q Corp
WHOLESALE - Auto Parts
|
$21.57
|
-0.21
-0.96% |
$21.86
|
1,369,825
62.68% of 50 DAV
50 DAV is 2,185,400
|
$22.29
-3.21%
|
8/9/2012
|
$18.97
|
PP = $18.72
|
|
MB = $19.66
|
 Most Recent Note - 12/4/2012 1:50:29 PM
G - Churning above average volume in recent weeks without making meaningful price progress. Encountering resistance after a worrisome "negative reversal" and finish near the session low on 11/26/12 followed by additional losses on above average volume. Results below the +25% minimum earnings guideline (C criteria) for Sep '12 recently raised fundamental concerns.
>>> The latest Featured Stock Update with an annotated graph appeared on 11/30/2012. Click here.
View all notes |
Alert me of new notes |
CANSLIM.net Company Profile |
SEC |
Zacks Reports |
StockTalk |
News |
Chart |
Request a new note
C
A N
S L
I M
|
MIDD
-
NASDAQ
Middleby Corp
MANUFACTURING - Diversified Machinery
|
$128.22
|
+1.49
1.18% |
$128.92
|
89,511
124.67% of 50 DAV
50 DAV is 71,800
|
$128.96
-0.58%
|
10/8/2012
|
$118.46
|
PP = $122.67
|
|
MB = $128.80
|
Most Recent Note - 12/3/2012 6:18:44 PM
Y - Still consolidating in a tight trading range near its all-time high. Recently reported earnings +23% on +18% sales for the Sep '12 quarter, below the +25% minimum earnings guideline (C criteria), raising fundamental concerns.
>>> The latest Featured Stock Update with an annotated graph appeared on 11/16/2012. Click here.
View all notes |
Alert me of new notes |
CANSLIM.net Company Profile |
SEC |
Zacks Reports |
StockTalk |
News |
Chart |
Request a new note
C
A N
S L
I M
|
Symbol/Exchange
Company Name
Industry Group |
PRICE |
CHANGE
(%Change) |
Day High |
Volume
(% DAV)
(% 50 day avg vol) |
52 Wk Hi
% From Hi |
Featured
Date |
Price
Featured |
Pivot Featured |
|
Max Buy |
RAX
-
NYSE
Rackspace Hosting Inc
INTERNET - Internet Software and; Services
|
$66.59
|
-0.77
-1.14% |
$67.30
|
1,272,955
78.65% of 50 DAV
50 DAV is 1,618,600
|
$70.00
-4.87%
|
11/26/2012
|
$66.26
|
PP = $67.18
|
|
MB = $70.54
|
Most Recent Note - 12/3/2012 6:36:05 PM
Y - Encountered mild distributional pressure today. Confirming gains above its pivot point with at least +40% above average volume would be a welcome reassurance. Disciplined investors may be wise to use a tactic called "pyramiding" to allow the market action to dictate their weighting in new buys while always limiting losses by selling if any stock ever falls more than -7% from their purchase price.
>>> The latest Featured Stock Update with an annotated graph appeared on 11/27/2012. Click here.
View all notes |
Alert me of new notes |
CANSLIM.net Company Profile |
SEC |
Zacks Reports |
StockTalk |
News |
Chart |
Request a new note
C
A N
S L
I M
|
RGR
-
NYSE
Sturm Ruger & Co Inc
CONSUMER DURABLES - Sporting Goods
|
$58.93
|
+0.35
0.60% |
$59.87
|
882,928
185.92% of 50 DAV
50 DAV is 474,900
|
$60.11
-1.96%
|
11/20/2012
|
$52.23
|
PP = $52.65
|
|
MB = $55.28
|
Most Recent Note - 12/3/2012 12:25:59 PM
G - Pulling back from its 52-week high hit last week with volume running at an above average pace behind today's 2nd consecutive loss after a streak of 8 consecutive volume-driven gains. It is extended from its previously noted base and may form a high handle on its larger 7-month cup shaped base, however the minimum length for a proper handle is 1 week for it to be recognized as a valid cup-with-handle base. Prior highs near $52 define initial chart support to watch where violations may trigger technical sell signals.
>>> The latest Featured Stock Update with an annotated graph appeared on 11/21/2012. Click here.
View all notes |
Alert me of new notes |
CANSLIM.net Company Profile |
SEC |
Zacks Reports |
StockTalk |
News |
Chart |
Request a new note
C
A N
S L
I M
|
RNF
-
NYSE
Rentech Nitrogen Ptnr Lp
CHEMICALS - Agricultural Chemicals
|
$38.88
|
-0.67
-1.69% |
$39.60
|
207,600
53.74% of 50 DAV
50 DAV is 386,300
|
$41.15
-5.52%
|
11/1/2012
|
$39.11
|
PP = $40.15
|
|
MB = $42.16
|
Most Recent Note - 12/4/2012 1:46:03 PM
Y - It is perched within close striking distance of its 52-week high. Recent gains with below average volume indicate lackluster buying demand from the institutional crowd. Disciplined investors may watch for volume-driven gains for a new high close to trigger a technical buy signal.
>>> The latest Featured Stock Update with an annotated graph appeared on 11/26/2012. Click here.
View all notes |
Alert me of new notes |
CANSLIM.net Company Profile |
SEC |
Zacks Reports |
StockTalk |
News |
Chart |
Request a new note
C
A N
S L
I M
|
ULTA
-
NASDAQ
Ulta Salon Cosm & Frag
SPECIALTY RETAIL - Specialty Retail, Other
|
$100.38
|
-0.52
-0.52% |
$100.95
|
1,159,299
159.55% of 50 DAV
50 DAV is 726,600
|
$103.52
-3.03%
|
12/4/2012
|
$100.29
|
PP = $103.62
|
|
MB = $108.80
|
Most Recent Note - 12/4/2012 5:26:19 PM
Y - Perched within close striking distance of its 52-week high following a considerable gap up gain on 11/30/12 with heavy volume. Color code was changed to yellow with new pivot point based on its 9/07/12 high plus 10 cents. Disciplined investors will watch for volume-driven gains above the pivot point to trigger a new technical buy signal. See latest FSU analysis for more details and a new annotated graph.
>>> The latest Featured Stock Update with an annotated graph appeared on 12/4/2012. Click here.
View all notes |
Alert me of new notes |
CANSLIM.net Company Profile |
SEC |
Zacks Reports |
StockTalk |
News |
Chart |
Request a new note
C
A N
S L
I M
|
VSI
-
NYSE
Vitamin Shoppe Inc
SPECIALTY RETAIL - Specialty Retail, Other
|
$57.56
|
-1.50
-2.54% |
$59.05
|
395,462
158.95% of 50 DAV
50 DAV is 248,800
|
$61.89
-7.00%
|
12/3/2012
|
$59.06
|
PP = $61.99
|
|
MB = $65.09
|
Most Recent Note - 12/4/2012 11:46:25 AM
G -Violated its 50 DMA line today, encountering distributional pressure, and its color code is changed to green. The $61 area has been a stubborn resistance level in recent months. See the latest FSU analysis for more details and a new annotated graph.
>>> The latest Featured Stock Update with an annotated graph appeared on 12/3/2012. Click here.
View all notes |
Alert me of new notes |
CANSLIM.net Company Profile |
SEC |
Zacks Reports |
StockTalk |
News |
Chart |
Request a new note
C
A N
S L
I M
|
Symbol/Exchange
Company Name
Industry Group |
PRICE |
CHANGE
(%Change) |
Day High |
Volume
(% DAV)
(% 50 day avg vol) |
52 Wk Hi
% From Hi |
Featured
Date |
Price
Featured |
Pivot Featured |
|
Max Buy |
WPI
-
NYSE
Watson Pharmaceuticals
DRUGS - Drugs - Generic
|
$88.30
|
+0.28
0.32% |
$88.82
|
691,740
87.88% of 50 DAV
50 DAV is 787,100
|
$90.00
-1.89%
|
8/24/2012
|
$82.90
|
PP = $81.10
|
|
MB = $85.16
|
Most Recent Note - 12/4/2012 1:48:03 PM
G - Consolidating within close striking distance of its 52-week high today with very little resistance remaining due to overhead supply. Quarterly comparisons for sales revenues and earnings increases have shown sequential deceleration in its growth rate raising some fundamental concerns, as recently noted.
>>> The latest Featured Stock Update with an annotated graph appeared on 11/23/2012. Click here.
View all notes |
Alert me of new notes |
CANSLIM.net Company Profile |
SEC |
Zacks Reports |
StockTalk |
News |
Chart |
Request a new note
C
A N
S L
I M
|
|
|
|
THESE ARE NOT BUY RECOMMENDATIONS!
Comments contained in the body of this report are technical
opinions only. The material herein has been obtained
from sources believed to be reliable and accurate, however,
its accuracy and completeness cannot be guaranteed.
This site is not an investment advisor, hence it does
not endorse or recommend any securities or other investments.
Any recommendation contained in this report may not
be suitable for all investors and it is not to be deemed
an offer or solicitation on our part with respect to
the purchase or sale of any securities. All trademarks,
service marks and trade names appearing in this report
are the property of their respective owners, and are
likewise used for identification purposes only.
This report is a service available
only to active Paid Premium Members.
You may opt-out of receiving report notifications
at any time. Questions or comments may be submitted
by writing to Premium Membership Services 665 S.E. 10 Street, Suite 201 Deerfield Beach, FL 33441-5634 or by calling 1-800-965-8307
or 954-785-1121.
|
|
|

