You are not logged in.
This means you
CAN ONLY VIEW reports that were published prior to Monday, April 14, 2025.
You
MUST UPGRADE YOUR MEMBERSHIP if you want to see any current reports.
AFTER MARKET UPDATE - TUESDAY, DECEMBER 3RD, 2013
Previous After Market Report Next After Market Report >>>
|
|
|
|
DOW |
-94.15 |
15,914.62 |
-0.59% |
|
Volume |
769,956,720 |
+15% |
|
Volume |
1,755,898,520 |
+8% |
|
NASDAQ |
-8.06 |
4,037.20 |
-0.20% |
|
Advancers |
1,162 |
37% |
|
Advancers |
968 |
36% |
|
S&P 500 |
-5.75 |
1,795.15 |
-0.32% |
|
Decliners |
1,860 |
60% |
|
Decliners |
1,593 |
60% |
|
Russell 2000 |
-5.34 |
1,123.78 |
-0.47% |
|
52 Wk Highs |
50 |
|
|
52 Wk Highs |
92 |
|
|
S&P 600 |
-2.74 |
645.53 |
-0.42% |
|
52 Wk Lows |
87 |
|
|
52 Wk Lows |
28 |
|
|
 |
Leadership Wanes as Major Averages Endure Distributional Pressure
Kenneth J. Gruneisen - Passed the CAN SLIM® Master's Exam
The major averages continued their slow start in December with losses on Tuesday. The volume totals were reported higher on the NYSE and on the Nasdaq exchange, indicating more distributional action or selling pressure coming from the institutional crowd. Breadth was negative as decliners led advancers by a 3-2 margin on the NYSE and on the Nasdaq exchange. Leadership contracted as there were only 24 high-ranked companies from the CANSLIM.net Leaders List that made new 52-week highs and appeared on the CANSLIM.net BreakOuts Page, down from a total of 67 stocks on the prior session. Any sustained rally must have leadership, so waning new highs totals are a concern coupled with the noted signs of distribution. The list of stocks hitting new 52-week highs still outnumbered new lows on the Nasdaq exchange, but new lows outnumbered new high on the NYSE. There were gains for only 6 of the 19 high-ranked companies currently included on the Featured Stocks Page.
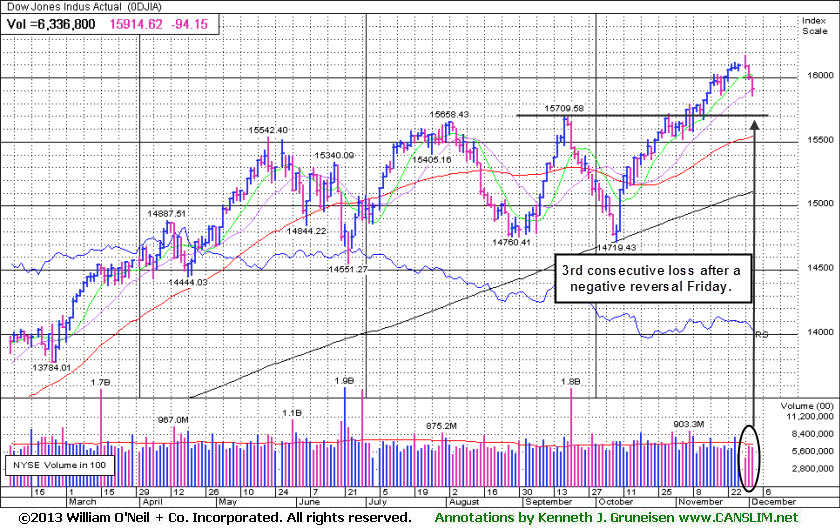
The Dow fell 94 points to 15,914. The S&P 500 lost 5 points to at 1,795. The NASDAQ declined 8 points to 4,037. Stocks pulled back as investors continued taking profits before Friday's non-farm payrolls report.
Sectors finished mixed. Materials and financials paced the decline as Dow Chemical Co (DOW -3.15%) and Bank of America Corp (BAC -1.21%) fell. Consumer discretionary was also a notable laggard following a mixed start to the holiday shopping season. Amazon.com Inc (AMZN -1.95%) fell. Automakers were also under pressure even as most November sales figures topped expectations. Ford Motor Co (F -2.9%) and the new General Motors Company (GM -2.48%) fell. Gains in the utilities sector helped limit losses. ONEOK Inc (OKE +3.91%) rallied after delivering an encouraging 20314 earnings forecast at an analyst day. Technology gained ground. Shares of Apple Inc (AAPL +2.74%) rose after a report that the company purchased social media analytics firm Topsy.
Treasury prices increased for the first time in four sessions. The 10-year note gained 4/32 to yield 2.78% and the 30-year bond rose 8/32 to yield 3.84%.
The Market (M criteria) remains in a confirmed rally, however showing signs of distribution and waning leadership, yet the Dow and S&P 500 Index both remain perched near new all-time highs. As always, any new buying efforts should be selective. The CANSLIM.net Featured Stocks Page shows the most action-worthy candidates and their latest notes and a new Headline Link directs members to the latest detailed analysis with data-packed graphs annotated by a Certified expert along with links to additional resources. The Premium Member Homepage - includes "dynamic archives" to all prior pay reports published. Watch for an announcement via email concerning the next WEBCAST.
PICTURED: The Dow Jones Industrial Average is pulling back after a quiet "negative reversal" on light volume Friday at its all-time high. Its September highs define initial support on pullbacks.
|
 Kenneth J. Gruneisen started out as a licensed stockbroker in August 1987, a couple of months prior to the historic stock market crash that took the Dow Jones Industrial Average down -22.6% in a single day. He has published daily fact-based fundamental and technical analysis on high-ranked stocks online for two decades. Through FACTBASEDINVESTING.COM, Kenneth provides educational articles, news, market commentary, and other information regarding proven investment systems that work in good times and bad.
Comments contained in the body of this report are technical opinions only and are not necessarily those of Gruneisen Growth Corp. The material herein has been obtained from sources believed to be reliable and accurate, however, its accuracy and completeness cannot be guaranteed. Our firm, employees, and customers may effect transactions, including transactions contrary to any recommendation herein, or have positions in the securities mentioned herein or options with respect thereto. Any recommendation contained in this report may not be suitable for all investors and it is not to be deemed an offer or solicitation on our part with respect to the purchase or sale of any securities. |
|
 |
Financial and Retail Indices Fell
Kenneth J. Gruneisen - Passed the CAN SLIM® Master's Exam
Financial shares' weakness had a negative influence on the major averages as the Bank Index ($BKX -1.14%) and the Broker/Dealer Index ($XBD -1.04%) fell on Tuesday. The Retail Index ($RLX -0.75%) suffered a small loss and the Biotechnology Index ($BTK -1.39%) dragged the tech sector lower whjile the Semiconductor Index ($SOX +0.35%) and the Networking Index ($NWX +0.36%) finished with small gains. Commodity-linked groups were mixed as the Gold & Silver Index ($XAU -1.22%) fell, the Integrated Oil Index ($XOI +0.01%) finished flat, and the Oil Services Index ($OSX +0.62%) posted a modest gain.
Charts courtesy www.stockcharts.com
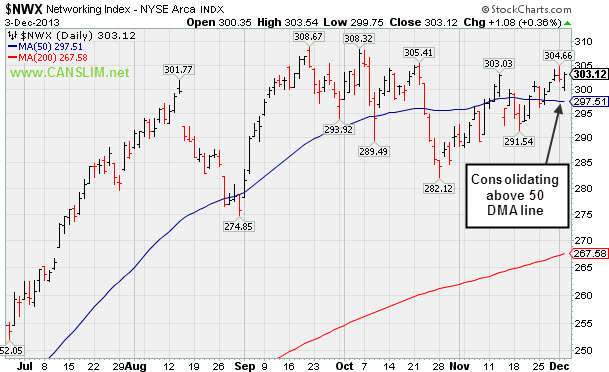
PICTURED: The Networking Index ($NWX +0.36%) is consolidating above its 50-day moving average (DMA) line.
| Oil Services |
$OSX |
279.28 |
+1.71 |
+0.62% |
+26.85% |
| Integrated Oil |
$XOI |
1,474.67 |
+0.12 |
+0.01% |
+18.75% |
| Semiconductor |
$SOX |
511.20 |
+1.80 |
+0.35% |
+33.10% |
| Networking |
$NWX |
303.12 |
+1.08 |
+0.36% |
+33.80% |
| Broker/Dealer |
$XBD |
152.67 |
-1.61 |
-1.04% |
+61.85% |
| Retail |
$RLX |
919.45 |
-6.96 |
-0.75% |
+40.79% |
| Gold & Silver |
$XAU |
80.88 |
-1.00 |
-1.22% |
-51.16% |
| Bank |
$BKX |
66.88 |
-0.77 |
-1.14% |
+30.42% |
| Biotech |
$BTK |
2,278.58 |
-32.14 |
-1.39% |
+47.29% |
|
|
|
 |
Extended From Any Sound Base Pattern
Kenneth J. Gruneisen - Passed the CAN SLIM® Master's Exam
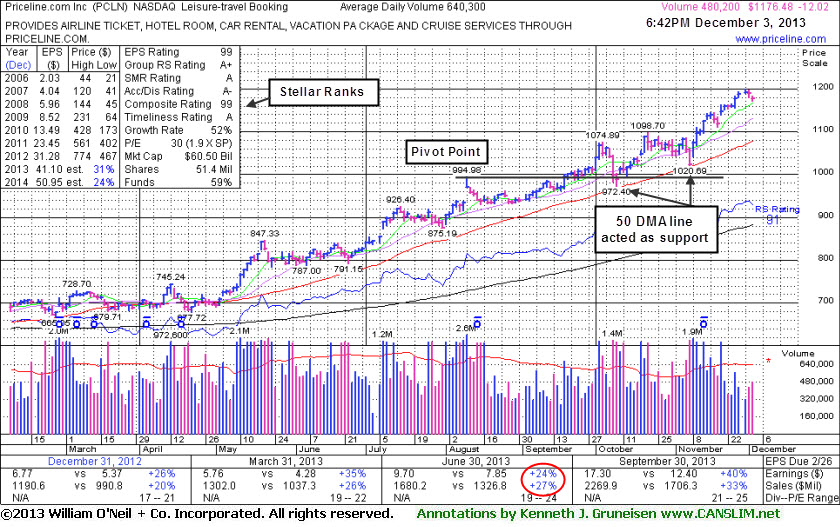
Priceline.com Inc. (PCLN -$12.02 or -1.01% to $1,176.48) pulled back today on below average volume. It wedged to new 52-week highs with recent gains during the Thanksgiving holiday-shortened week backed by below average volume. It found support at its 50-day moving average (DMA) line again on the last pullback, then rallied to new highs with a spurt of volume-driven gains without spending sufficient time consolidating to form a sound base pattern.
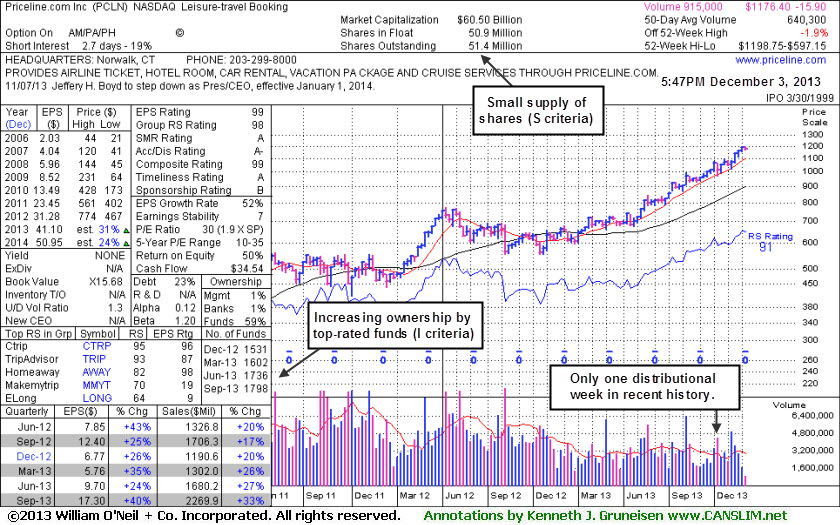
PCLN reported earnings +40% on +33% sales revenues for the Sep '13 quarter versus the year-ago period, improving after a slightly sub par Jun '13 report. When last shown in the FSU section on 9/19/13 with an annotated graph under the headline, "Rallied to New Highs Following Pullback to 50-day Average ", it was extended from any sound base. Earnings increased by +24% on +27% sales revenues for the Jun '13 quarter, just under the +25% minimum earnings guideline (C criteria). The Leisure - Travel Booking firm has earned great ranks, including the highest possible rating of 99 for earnings Per Share (EPS). Its strong annual earnings history satisfies the A criteria.
Keep in mind, the investment system's biggest winning models were typically held by at least a few mutual funds and attracting many others. However, once a stock is very heavily owned by a long list of mutual funds, as is now the case with PCLN, investors should be especially cautious and alert for any technical sell signals or fundamental disappointments which could prompt a rush for the exits. The number of top-rated funds owning its shares rose from 1,528 in Sep '12 to 1,798 in Sep '13, and increasing interest is an encouraging sign concerning the I criteria. Its current Up/Down Volume Ratio of 1.3 is an unbiased indication its shares have been under accumulation over the past 50 days.
|
|
|
Color Codes Explained :
Y - Better candidates highlighted by our
staff of experts.
G - Previously featured
in past reports as yellow but may no longer be buyable under the
guidelines.
***Last / Change / Volume data in this table is the closing quote data***
Symbol/Exchange
Company Name
Industry Group |
PRICE |
CHANGE
(%Change) |
Day High |
Volume
(% DAV)
(% 50 day avg vol) |
52 Wk Hi
% From Hi |
Featured
Date |
Price
Featured |
Pivot Featured |
|
Max Buy |
BITA
-
NYSE
Bitauto Hldgs Ltd Ads
INTERNET - Internet Information Providers
|
$32.09
|
-0.30
-0.93% |
$32.90
|
504,756
43.96% of 50 DAV
50 DAV is 1,148,100
|
$35.04
-8.42%
|
9/24/2013
|
$16.40
|
PP = $17.31
|
|
MB = $18.18
|
Most Recent Note - 11/29/2013 10:53:00 AM
G - Hovering near its 52-week high, very extended from any sound base. Its prior high in the $28 area define initial support to watch on pullbacks.
>>> FEATURED STOCK ARTICLE : Consolidating After Getting Extended From Prior Base - 11/11/2013
View all notes |
Set NEW NOTE alert |
CANSLIM.net Company Profile |
SEC
News |
Chart |
Request a new note
C
A N
S L
I M


|
CELG
-
NASDAQ
Celgene Corp
DRUGS - Drug Manufacturers - Major
|
$159.93
|
-3.18
-1.95% |
$162.68
|
2,411,300
84.36% of 50 DAV
50 DAV is 2,858,400
|
$165.74
-3.51%
|
9/12/2013
|
$149.50
|
PP = $150.02
|
|
MB = $157.52
|
Most Recent Note - 11/29/2013 2:54:45 PM
G - Hovering near its 52-week and all-time highs with volume totals cooling after volume-driven gains to new highs. Earnings +21% on +18% sales revenues for the Sep '13 quarter were below the +25% minimum guideline (C criteria) raising fundamental concerns.
>>> FEATURED STOCK ARTICLE : Testing 50-Day Average Following Sub Par Earnings Increase - 11/1/2013
View all notes |
Set NEW NOTE alert |
CANSLIM.net Company Profile |
SEC
News |
Chart |
Request a new note
C
A N
S L
I M
|
EGOV
-
NASDAQ
N I C Inc
INTERNET - Internet Software and Services
|
$23.90
|
+0.42
1.79% |
$24.00
|
203,688
68.28% of 50 DAV
50 DAV is 298,300
|
$25.99
-8.04%
|
10/18/2013
|
$25.17
|
PP = $23.66
|
|
MB = $24.84
|
Most Recent Note - 12/2/2013 6:04:50 PM
G - Down considerably today with near average but higher volume indicative of mild distributional pressure. Disciplined investors always limit losses by selling any stock that falls more than -7% from their purchase price.
>>> FEATURED STOCK ARTICLE : Finding Support Near 50-Day Average During Distributional Pressure - 11/25/2013
View all notes |
Set NEW NOTE alert |
CANSLIM.net Company Profile |
SEC
News |
Chart |
Request a new note
C
A N
S L
I M
|
FLT
-
NYSE
Fleetcor Technologies
DIVERSIFIED SERVICES - Business/Management Services
|
$122.05
|
-0.65
-0.53% |
$123.00
|
678,193
82.21% of 50 DAV
50 DAV is 825,000
|
$123.96
-1.54%
|
8/19/2013
|
$99.01
|
PP = $100.97
|
|
MB = $106.02
|
 Most Recent Note - 12/3/2013 1:04:59 PM
G - Still hovering at its all-time high, extended from any sound base. A steep upward trendline connecting its Oct-Nov lows defines initial support to watch well above its 50 DMA line ($113.34 now).
>>> FEATURED STOCK ARTICLE : Perched Near All-Time High Tallying Quiet Gains - 11/13/2013
View all notes |
Set NEW NOTE alert |
CANSLIM.net Company Profile |
SEC
News |
Chart |
Request a new note
C
A N
S L
I M
|
GNRC
-
NYSE
Generac Hldgs Inc
CONSUMER DURABLES - Electronic Equipment
|
$52.93
|
+0.18
0.34% |
$53.09
|
764,345
91.99% of 50 DAV
50 DAV is 830,900
|
$53.74
-1.50%
|
11/26/2013
|
$53.02
|
PP = $52.42
|
|
MB = $55.04
|
Most Recent Note - 11/29/2013 2:46:49 PM
Y - Perched at its 52-week high today. Prior highs in the $52 area define initial support to watch after its breakout from a short flat base with +59% above average volume triggered a new (or-add on) technical buy signal. See the latest FSU analysis for more details and new annotated daily and weekly graphs.
>>> FEATURED STOCK ARTICLE : Following Latest Breakout Prior Highs Define Support - 11/29/2013
View all notes |
Set NEW NOTE alert |
CANSLIM.net Company Profile |
SEC
News |
Chart |
Request a new note
C
A N
S L
I M
|
Symbol/Exchange
Company Name
Industry Group |
PRICE |
CHANGE
(%Change) |
Day High |
Volume
(% DAV)
(% 50 day avg vol) |
52 Wk Hi
% From Hi |
Featured
Date |
Price
Featured |
Pivot Featured |
|
Max Buy |
HLF
-
NYSE
Herbalife Ltd
DRUGS - Nutrition and Weight Management
|
$76.65
|
+4.80
6.68% |
$76.83
|
4,762,437
194.85% of 50 DAV
50 DAV is 2,444,200
|
$74.94
2.28%
|
11/22/2013
|
$72.21
|
PP = $75.04
|
|
MB = $78.79
|
Most Recent Note - 12/3/2013 1:12:35 PM
Y - Volume is running at an above average pace today while hitting a new 52-week high and trading above its pivot point. Volume must be at least +40% above average when rallying above the pivot point to trigger a proper technical buy signal.
>>> FEATURED STOCK ARTICLE : Perched Near Highs Following Rebound - 11/22/2013
View all notes |
Set NEW NOTE alert |
CANSLIM.net Company Profile |
SEC
News |
Chart |
Request a new note
C
A N
S L
I M
|
JAZZ
-
NASDAQ
Jazz Pharmaceuticals Plc
DRUGS - Biotechnology
|
$113.81
|
-3.94
-3.35% |
$117.01
|
701,909
93.88% of 50 DAV
50 DAV is 747,700
|
$118.80
-4.20%
|
9/30/2013
|
$93.20
|
PP = $89.10
|
|
MB = $93.56
|
Most Recent Note - 12/3/2013 1:14:25 PM
G - Volume totals have been cooling while hovering near its 52-week high, stubbornly holding its ground while extended from any sound base. Prior notes reminded members - "Disciplined investors avoid chasing stocks more than +5% above prior highs and always limit losses by selling any stock that falls more than -7% from their purchase price."
>>> FEATURED STOCK ARTICLE : Hovering Near All-Time Highs Following Volume-Driven Gains - 11/7/2013
View all notes |
Set NEW NOTE alert |
CANSLIM.net Company Profile |
SEC
News |
Chart |
Request a new note
C
A N
S L
I M
|
KORS
-
NYSE
Michael Kors Hldgs Ltd
RETAIL - Apparel Stores
|
$80.39
|
-1.37
-1.68% |
$81.87
|
2,351,605
52.52% of 50 DAV
50 DAV is 4,477,900
|
$83.13
-3.30%
|
8/6/2013
|
$69.66
|
PP = $66.28
|
|
MB = $69.59
|
Most Recent Note - 11/27/2013 6:31:02 PM
G - Volume totals have still been cooling while hovering in a tight range near all-time highs, stubbornly holding its ground. Prior highs in the $78 area define near-term support above its 50 DMA line.
>>> FEATURED STOCK ARTICLE : Hitting New Highs After Choppy Consolidation - 11/6/2013
View all notes |
Set NEW NOTE alert |
CANSLIM.net Company Profile |
SEC
News |
Chart |
Request a new note
C
A N
S L
I M
|
LOPE
-
NASDAQ
Grand Canyon Education
DIVERSIFIED SERVICES - Education and; Training Services
|
$44.46
|
-0.57
-1.27% |
$45.30
|
313,854
75.96% of 50 DAV
50 DAV is 413,200
|
$50.48
-11.93%
|
6/19/2013
|
$31.47
|
PP = $34.17
|
|
MB = $35.88
|
Most Recent Note - 12/3/2013 1:07:13 PM
G - Volume totals have been cooling while consolidating above its 50 DMA line defining near-term support. Repeatedly noted - "Fundamental concerns remain while technical action has been reassuring."
>>> FEATURED STOCK ARTICLE : Fundamental Concerns Noted While Consolidating Above 50-Day Moving Average - 11/26/2013
View all notes |
Set NEW NOTE alert |
CANSLIM.net Company Profile |
SEC
News |
Chart |
Request a new note
C
A N
S L
I M
|
NOAH
-
NYSE
Noah Holdings Ltd Ads
FINANCIAL SERVICES - Asset Management
|
$20.57
|
-0.21
-1.01% |
$21.04
|
330,794
39.45% of 50 DAV
50 DAV is 838,600
|
$25.51
-19.36%
|
10/15/2013
|
$19.10
|
PP = $18.33
|
|
MB = $19.25
|
Most Recent Note - 12/3/2013 1:01:27 PM
G - Still consolidating above its 50 DMA line which acted as support throughout its choppy ascent. Previously noted with caution - "A violation may trigger a technical sell signal. Caution is called for after a worrisome 'negative reversal' occurred at its 52-week high, and it is extended from its latest base."
>>> FEATURED STOCK ARTICLE : 50-Day Average And Prior Highs Define Important Support - 11/20/2013
View all notes |
Set NEW NOTE alert |
CANSLIM.net Company Profile |
SEC
News |
Chart |
Request a new note
C
A N
S L
I M
|
Symbol/Exchange
Company Name
Industry Group |
PRICE |
CHANGE
(%Change) |
Day High |
Volume
(% DAV)
(% 50 day avg vol) |
52 Wk Hi
% From Hi |
Featured
Date |
Price
Featured |
Pivot Featured |
|
Max Buy |
PCLN
-
NASDAQ
Priceline.Com Inc
INTERNET - Internet Software and Services
|
$1,176.48
|
-12.02
-1.01% |
$1,182.90
|
483,156
75.46% of 50 DAV
50 DAV is 640,300
|
$1,198.75
-1.86%
|
9/13/2013
|
$966.82
|
PP = $995.08
|
|
MB = $1,044.83
|
Most Recent Note - 11/27/2013 6:32:45 PM
G - Wedged to yet another new 52-week high with today's 3rd consecutive gain backed by below average volume. Found support at its 50 DMA line on prior pullbacks, however it has not formed any recent sound base pattern. Reported earnings +40% on +33% sales revenues for the Sep '13 quarter versus the year-ago period, improving after a slightly sub par Jun '13 report.
>>> FEATURED STOCK ARTICLE : Extended From Any Sound Base Pattern - 12/3/2013
View all notes |
Set NEW NOTE alert |
CANSLIM.net Company Profile |
SEC
News |
Chart |
Request a new note
C
A N
S L
I M
|
PRLB
-
NYSE
Proto Labs Inc
MANUFACTURING - Small Tools and Accessories
|
$74.29
|
+0.00
0.00% |
$75.42
|
344,381
73.89% of 50 DAV
50 DAV is 466,100
|
$89.97
-17.43%
|
7/29/2013
|
$64.86
|
PP = $67.50
|
|
MB = $70.88
|
Most Recent Note - 12/2/2013 6:03:10 PM
G - Still failing to attract buying demand after slumping well below its 50 DMA line which is now downward sloping. Its prior low of $68.29 on 10/09/13 defines support above its 200 DMA line.
>>> FEATURED STOCK ARTICLE : Undercut 50-Day Moving Average Yet Found Prompt Support - 11/4/2013
View all notes |
Set NEW NOTE alert |
CANSLIM.net Company Profile |
SEC
News |
Chart |
Request a new note
C
A N
S L
I M
|
SFUN
-
NYSE
Soufun Hldgs Ltd Ads A
INTERNET - Internet Information Providers
|
$76.54
|
+4.69
6.53% |
$77.45
|
2,246,309
150.42% of 50 DAV
50 DAV is 1,493,400
|
$72.65
5.35%
|
10/17/2013
|
$58.02
|
PP = $53.87
|
|
MB = $56.56
|
Most Recent Note - 12/2/2013 12:52:08 PM
G - Poised for a best-ever close and challenging its all-time high with today's considerable gain. It has not formed a sound base pattern. Disciplined investors avoid chasing extended stocks. Prior highs in the $59 area define initial support to watch on pullbacks.
>>> FEATURED STOCK ARTICLE : Perched Near All-Time High After Testing Support - 11/8/2013
View all notes |
Set NEW NOTE alert |
CANSLIM.net Company Profile |
SEC
News |
Chart |
Request a new note
C
A N
S L
I M
|
SSNC
-
NASDAQ
S S & C Technologies
COMPUTER SOFTWARE and SERVICES - Application Software
|
$42.27
|
-0.92
-2.13% |
$43.47
|
465,671
147.50% of 50 DAV
50 DAV is 315,700
|
$43.80
-3.49%
|
10/22/2013
|
$39.17
|
PP = $40.04
|
|
MB = $42.04
|
Most Recent Note - 12/3/2013 1:15:54 PM
G - Slumping back near its "max buy" level with today's pullback on below average volume. Prior highs near $41 define initial support to watch above its 50 DMA line on pullbacks.
>>> FEATURED STOCK ARTICLE : Volume Totals Cooling Following Recent Volume-Driven Breakout - 11/12/2013
View all notes |
Set NEW NOTE alert |
CANSLIM.net Company Profile |
SEC
News |
Chart |
Request a new note
C
A N
S L
I M
|
SSYS
-
NASDAQ
Stratasys Ltd
COMPUTER HARDWARE - Computer Peripherals
|
$122.49
|
+3.65
3.07% |
$123.52
|
1,505,837
127.84% of 50 DAV
50 DAV is 1,177,900
|
$134.00
-8.59%
|
10/11/2013
|
$102.94
|
PP = $105.38
|
|
MB = $110.65
|
Most Recent Note - 11/29/2013 2:52:53 PM
G - Consolidating above support at its 50 DMA line and prior highs with volume totals cooling. More damaging losses would raise greater concerns and trigger worrisome technical sell signals. Reported earnings +13% on +153% sales revenues, below the +25% minimum earnings guideline (C criteria) raising fundamental concerns.
>>> FEATURED STOCK ARTICLE : Rallying For New Highs Despite Fundamental Flaw Raising Concern - 11/18/2013
View all notes |
Set NEW NOTE alert |
CANSLIM.net Company Profile |
SEC
News |
Chart |
Request a new note
C
A N
S L
I M
|
Symbol/Exchange
Company Name
Industry Group |
PRICE |
CHANGE
(%Change) |
Day High |
Volume
(% DAV)
(% 50 day avg vol) |
52 Wk Hi
% From Hi |
Featured
Date |
Price
Featured |
Pivot Featured |
|
Max Buy |
STMP
-
NASDAQ
Stamps.Com Inc
INTERNET - Internet Software and Services
|
$44.15
|
-1.87
-4.06% |
$46.21
|
212,881
188.06% of 50 DAV
50 DAV is 113,200
|
$49.40
-10.63%
|
9/24/2013
|
$45.54
|
PP = $46.57
|
|
MB = $48.90
|
Most Recent Note - 12/3/2013 12:45:13 PM
G - Slumping below its 50 DMA line today and testing an upward trendline where damaging violations may raise more serious concerns. Earnings were +24% on +7% sales revenues for the Sep '13 quarter, just below the +25% minimum earnings guideline (C criteria). See the latest FSU analysis for more details and new annotated daily and weekly graphs.
>>> FEATURED STOCK ARTICLE : Upward Trendline and 50-Day Average Define Important Near-Term Support - 12/2/2013
View all notes |
Set NEW NOTE alert |
CANSLIM.net Company Profile |
SEC
News |
Chart |
Request a new note
C
A N
S L
I M
|
ULTI
-
NASDAQ
Ultimate Software Group
INTERNET - Internet Software and Services
|
$154.21
|
+1.24
0.81% |
$154.50
|
122,161
83.73% of 50 DAV
50 DAV is 145,900
|
$162.88
-5.32%
|
10/16/2013
|
$142.95
|
PP = $151.18
|
|
MB = $158.74
|
Most Recent Note - 11/27/2013 6:34:35 PM
Y - Volume totals have still been cooling while holding its ground near its 52-week high yet below its "max buy" level. Prior highs and its 50 DMA line define near-term support near the $151 area.
>>> FEATURED STOCK ARTICLE : Consolidating Above 50 DMA Line and Prior Highs Defining Support - 11/21/2013
View all notes |
Set NEW NOTE alert |
CANSLIM.net Company Profile |
SEC
News |
Chart |
Request a new note
C
A N
S L
I M
|
VRX
-
NYSE
Valeant Pharmaceuticals
DRUGS - Drug Manufacturers - Other
|
$109.19
|
-0.59
-0.54% |
$109.87
|
874,659
77.30% of 50 DAV
50 DAV is 1,131,500
|
$115.40
-5.38%
|
9/11/2013
|
$100.26
|
PP = $105.50
|
|
MB = $110.78
|
Most Recent Note - 11/27/2013 6:35:20 PM
Y - Still consolidating in a very tight range near its 50 DMA line with volume totals cooling. Recent lows in the $102 area define near-term support where subsequent violations may trigger technical sell signals. Recently reported earnings +24% on +74% sales revenues for the Sep '13 quarter, a notch below the +25% minimum guideline (C criteria).
>>> FEATURED STOCK ARTICLE : Recent Lows Define Support to Watch Below 50 Day Average - 11/15/2013
View all notes |
Set NEW NOTE alert |
CANSLIM.net Company Profile |
SEC
News |
Chart |
Request a new note
C
A N
S L
I M
|
YNDX
-
NASDAQ
Yandex N V Class A
INTERNET - Internet Information Providers
|
$39.85
|
-0.22
-0.55% |
$41.56
|
4,879,220
190.76% of 50 DAV
50 DAV is 2,557,800
|
$42.00
-5.12%
|
11/27/2013
|
$39.61
|
PP = $42.10
|
|
MB = $44.21
|
Most Recent Note - 12/3/2013 12:54:47 PM
Y - Challenged its 52-week high earlier today with above average volume behind its gain approaching the new pivot point cited based on its 10/22/13 high plus 10 cents. Subsequent volume-driven gains above the pivot point may trigger a new (or add-on) technical buy signal. Prior lows ($35.59 on 11/08/13 and $34.31 on 10/08/13) defines the next important chart support levels to watch. See the latest FSU analysis for more details and annotated daily and weekly graphs.
>>> FEATURED STOCK ARTICLE : Forming New Base Pattern With Little Resistance Remaining - 11/27/2013
View all notes |
Set NEW NOTE alert |
CANSLIM.net Company Profile |
SEC
News |
Chart |
Request a new note
C
A N
S L
I M
|
|
|
|
THESE ARE NOT BUY RECOMMENDATIONS!
Comments contained in the body of this report are technical
opinions only. The material herein has been obtained
from sources believed to be reliable and accurate, however,
its accuracy and completeness cannot be guaranteed.
This site is not an investment advisor, hence it does
not endorse or recommend any securities or other investments.
Any recommendation contained in this report may not
be suitable for all investors and it is not to be deemed
an offer or solicitation on our part with respect to
the purchase or sale of any securities. All trademarks,
service marks and trade names appearing in this report
are the property of their respective owners, and are
likewise used for identification purposes only.
This report is a service available
only to active Paid Premium Members.
You may opt-out of receiving report notifications
at any time. Questions or comments may be submitted
by writing to Premium Membership Services 665 S.E. 10 Street, Suite 201 Deerfield Beach, FL 33441-5634 or by calling 1-800-965-8307
or 954-785-1121.
|
|
|

