You are not logged in.
This means you
CAN ONLY VIEW reports that were published prior to Monday, April 14, 2025.
You
MUST UPGRADE YOUR MEMBERSHIP if you want to see any current reports.
AFTER MARKET UPDATE - MONDAY, DECEMBER 3RD, 2012
Previous After Market Report Next After Market Report >>>
|
|
|
|
DOW |
-59.98 |
12,965.60 |
-0.46% |
|
Volume |
658,562,440 |
-44% |
|
Volume |
1,614,729,250 |
-18% |
|
NASDAQ |
-8.04 |
3,002.20 |
-0.27% |
|
Advancers |
1,183 |
38% |
|
Advancers |
1,111 |
43% |
|
S&P 500 |
-6.72 |
1,409.46 |
-0.47% |
|
Decliners |
1,811 |
58% |
|
Decliners |
1,372 |
53% |
|
Russell 2000 |
-1.12 |
820.80 |
-0.14% |
|
52 Wk Highs |
147 |
|
|
52 Wk Highs |
59 |
|
|
S&P 600 |
-0.33 |
461.82 |
-0.07% |
|
52 Wk Lows |
10 |
|
|
52 Wk Lows |
29 |
|
|
 |
Indices Erased Early Gains and Ended Near Lows After a Negative Reversal
Kenneth J. Gruneisen - Passed the CAN SLIM® Master's Exam
The major averages quickly reversed early gains on Monday and finished near the session's lows with unanimous losses. Volume totals were lighter than the prior session on the Nasdaq exchange and on the NYSE. Decliners led advancers by 3-2 on the NYSE and by 7-6 on the Nasdaq exchange. The total number of stocks hitting new 52-week highs solidly outnumbered new 52-week lows on both the NYSE and the Nasdaq exchange. There were 53 high-ranked companies from the CANSLIM.net Leaders List making new 52-week highs and appearing on the CANSLIM.net BreakOuts Page, up from the prior session total of 41 stocks. Any sustainable rally requires a healthy crop of companies hitting new 52-week highs, so it is encouraging to see meaningful leadership present. After a positive start it was discouraging that only 2 of the 10 high-ranked companies currently included on the Featured Stocks Page finished the session with gains.
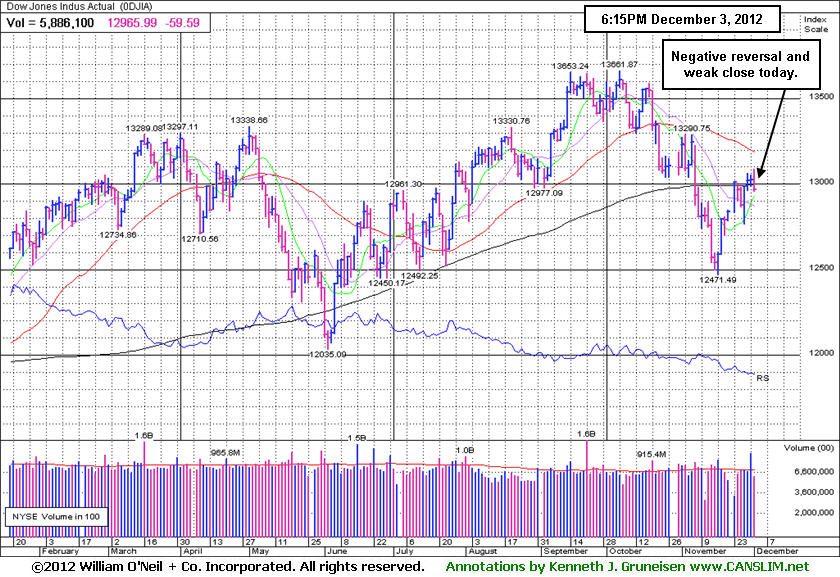
The major averages gave back their earlier gains and ended lower on the first trading day of December after a weaker-than-expected U.S. manufacturing report. The Institute for Supply Management index fell to 49.5 in November, down from 51.7 in the prior month and below the consensus estimate of 51.4. This offset a separate report that showed construction spending increased at an annualized 1.4% rate in October. The muted market action was also attributed to uncertainty surrounding the fiscal cliff. News that House Republicans sent a counter proposal to President Obama to avoid the looming fiscal cliff failed to lift the market.
Eight of 10 sectors in the S&P 500 index finished the session in negative territory. Materials was the worst performing group with Dow Chemical Co (DOW -2.95%) falling. Industrials were also notable laggards. Owens-Illinois Inc (OI -3.44%) and Lockheed Martin Corp (LMT -1.88%) declined. Tech was a relative outperformer with Dell Inc (DELL +4.36%) and Seagate Technology Plc (STX +1.04%) rising.
The market direction (M criteria) is currently a "confirmed uptrend" and new buying efforts may be justified only in worthy high-ranked leaders. See the noteworthy companies included on the Featured Stocks Page.
Watch for an announcement via email concerning the next WEBCAST. The webcast will also be available via an updated link highlighted at the top of the Premium Member Homepage.
PICTURED: The Dow Jones Industrial Average reversed early gains and ended near the session low, technically termed a "negative reversal", as it closed below its 200-day moving average (DMA) line (12,996.35).
|
 Kenneth J. Gruneisen started out as a licensed stockbroker in August 1987, a couple of months prior to the historic stock market crash that took the Dow Jones Industrial Average down -22.6% in a single day. He has published daily fact-based fundamental and technical analysis on high-ranked stocks online for two decades. Through FACTBASEDINVESTING.COM, Kenneth provides educational articles, news, market commentary, and other information regarding proven investment systems that work in good times and bad.
Comments contained in the body of this report are technical opinions only and are not necessarily those of Gruneisen Growth Corp. The material herein has been obtained from sources believed to be reliable and accurate, however, its accuracy and completeness cannot be guaranteed. Our firm, employees, and customers may effect transactions, including transactions contrary to any recommendation herein, or have positions in the securities mentioned herein or options with respect thereto. Any recommendation contained in this report may not be suitable for all investors and it is not to be deemed an offer or solicitation on our part with respect to the purchase or sale of any securities. |
|
 |
Gold & Silver Index Slumps Under 200-Day Average Again
Kenneth J. Gruneisen - Passed the CAN SLIM® Master's Exam
The Healthcare Index ($HMO +0.23%) was a standout gainer, but the Gold & Silver Index ($XAU -1.97%) was a standout decliner on Monday. Weakness in energy-related shares pushed the Integrated Oil Index ($XOI -0.61%) ands the Oil Services Index ($OSX -0.32%) to small losses.
Losses in the influential Bank Index ($BKX -0.82%) and Broker/Dealer Index ($XBD -0.49%) both created a drag on the major averages. The Retail Index ($RLX -0.75%) also lost ground, and the tech sector saw unanimous losses from the Biotechnology Index ($BTK -0.69%), Networking Index ($NWX -0.62%), Internet Index ($IIX -0.55%), and Semiconductor Index ($SOX -0.48%).
Charts courtesy www.stockcharts.com
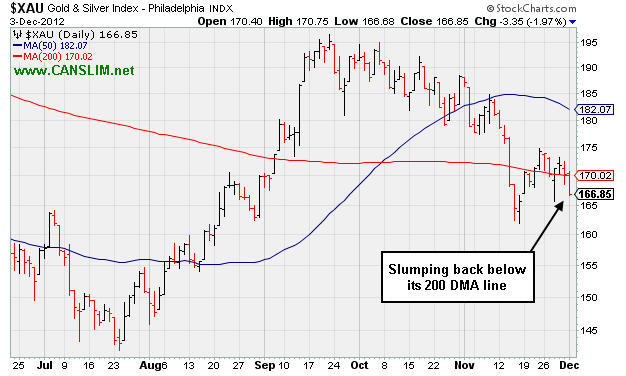
PICTURED: The Gold & Silver Index ($XAU -1.97%) slumped back below its 200-day moving average (DMA).
| Oil Services |
$OSX |
217.81 |
-0.69 |
-0.32% |
+0.71% |
| Healthcare |
$HMO |
2,487.08 |
+5.80 |
+0.23% |
+9.01% |
| Integrated Oil |
$XOI |
1,209.20 |
-7.37 |
-0.61% |
-1.62% |
| Semiconductor |
$SOX |
372.54 |
-1.81 |
-0.48% |
+2.22% |
| Networking |
$NWX |
210.23 |
-1.30 |
-0.62% |
-2.29% |
| Internet |
$IIX |
319.52 |
-1.76 |
-0.55% |
+13.41% |
| Broker/Dealer |
$XBD |
87.00 |
-0.43 |
-0.49% |
+4.48% |
| Retail |
$RLX |
670.94 |
-5.04 |
-0.75% |
+28.24% |
| Gold & Silver |
$XAU |
166.85 |
-3.35 |
-1.97% |
-7.63% |
| Bank |
$BKX |
48.16 |
-0.40 |
-0.82% |
+22.30% |
| Biotech |
$BTK |
1,528.32 |
-10.61 |
-0.69% |
+40.03% |
|
|
|
 |
Mild Distribution Day While Consolidating Above 50-Day Moving Average
Kenneth J. Gruneisen - Passed the CAN SLIM® Master's Exam
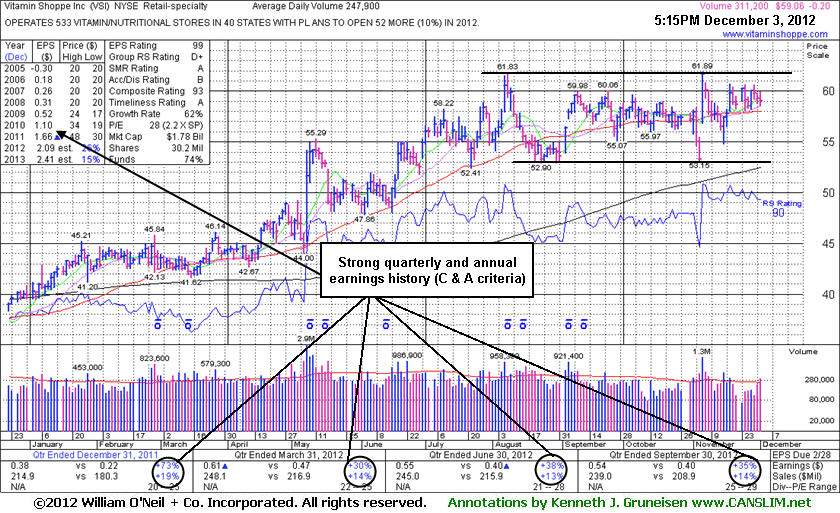
Vitamin Shoppe Inc (VSI -$0.20 or -0.34% to $59.06) encountered mild distributional pressure today. It is still perched within close striking distance of its 52-week high. The $61 area has been a stubborn resistance level in recent months while the $53 area defines a floor of chart support below its 50-day moving average (DMA) line. It could stay confined to that range for a long time, so disciplined investors will keep an eye on it until it shows conviction. A new pivot point is being cited based on its 11/06/12 high plus 10 cents. Subsequent volume-driven gains above that level could trigger a new technical buy signal.
It was last shown in this FSU section on 11/12/12 with and annotated graph under the headline, ''Promptly Negated Recent Breakout ". That report noted its waning Group Relative Strength Rating. Its chart has the look of a potentially very bad "double top" which would be completed, however, first by a slump below its 50-day moving average (DMA) line, followed by a severe breakdown undercutting its 200-day moving average (DMA) line and also violating its prior low ($52.90 on 8/23/12). An indication it may find good support from the institutional crowd is that the number of top-rated funds owning its shares has risen from 288 in Jun '11 to 390 in Sep '12, a reassuring sign concerning the I criteria.
It released better than expected earnings +35% on +14% sales revenues for the Sep '12 quarter. Fundamentally, it has earned high ranks after showing strong quarterly and annual earnings increases satisfying the C and A criteria. Vitamin Shoppe has 29.7 million shares outstanding. That small supply is not a bad thing, but could contribute to greater price volatility. Historic studies have shown that once companies have grown their supply (S criteria) of shares outstanding to hundreds of millions, or even billions of shares outstanding, they are less likely candidates to be "above average" gainers.
|
|
|
Color Codes Explained :
Y - Better candidates highlighted by our
staff of experts.
G - Previously featured
in past reports as yellow but may no longer be buyable under the
guidelines.
***Last / Change / Volume data in this table is the closing quote data***
Symbol/Exchange
Company Name
Industry Group |
PRICE |
CHANGE
(%Change) |
Day High |
Volume
(% DAV)
(% 50 day avg vol) |
52 Wk Hi
% From Hi |
Featured
Date |
Price
Featured |
Pivot Featured |
|
Max Buy |
CFNL
-
NASDAQ
Cardinal Financial Corp
BANKING - Regional - Southeast Banks
|
$15.46
|
+0.46
3.07% |
$15.50
|
618,693
341.82% of 50 DAV
50 DAV is 181,000
|
$16.21
-4.63%
|
12/3/2012
|
$15.20
|
PP = $16.31
|
|
MB = $17.13
|
 Most Recent Note - 12/3/2012 11:57:33 AM
Y - Color code is changed to yellow with a new pivot point cited based on its 11/06/12 high while still building on a short base-on-base pattern. Recently consolidating above prior highs and its 50 DMA line defining near-term chart support where violations may trigger technical sell signals. Volume-driven gains above its pivot point may trigger a new (or add-on) technical buy signal.
>>> The latest Featured Stock Update with an annotated graph appeared on 11/20/2012. Click here.
View all notes |
Alert me of new notes |
CANSLIM.net Company Profile |
SEC |
Zacks Reports |
StockTalk |
News |
Chart |
Request a new note
C
A N
S L
I M


|
CMCSA
-
NASDAQ
Comcast Corp Cl A
MEDIA - CATV Systems
|
$37.08
|
-0.12
-0.31% |
$37.41
|
8,412,452
67.18% of 50 DAV
50 DAV is 12,522,500
|
$37.96
-2.32%
|
12/3/2012
|
$37.08
|
PP = $38.06
|
|
MB = $39.96
|
Most Recent Note - 12/3/2012 4:59:48 PM
Y - Color code is changed to yellow with new pivot point cited based on its 11/02/12 high plus 10 cents while currently building on a short flat base. Subsequent volume-driven gains above the pivot point may trigger a new (or add-on) technical buy signal.
>>> The latest Featured Stock Update with an annotated graph appeared on 11/19/2012. Click here.
View all notes |
Alert me of new notes |
CANSLIM.net Company Profile |
SEC |
Zacks Reports |
StockTalk |
News |
Chart |
Request a new note
C
A N
S L
I M
|
GPX
-
NYSE
G P Strategies Corp
DIVERSIFIED SERVICES - Education and Training Services
|
$19.86
|
-0.19
-0.95% |
$20.01
|
94,186
160.45% of 50 DAV
50 DAV is 58,700
|
$21.44
-7.37%
|
10/8/2012
|
$20.00
|
PP = $20.77
|
|
MB = $21.81
|
Most Recent Note - 12/3/2012 5:02:32 PM
G - It negated the recent technical breakout and encountered distributional pressure yet finished near the session high after undercutting its 50 DMA line today. Earnings +0% on +12% sales revenues for the Sep '12 quarter, below the +25% minimum earnings guideline (C criteria) raised fundamental concerns.
>>> The latest Featured Stock Update with an annotated graph appeared on 11/15/2012. Click here.
View all notes |
Alert me of new notes |
CANSLIM.net Company Profile |
SEC |
Zacks Reports |
StockTalk |
News |
Chart |
Request a new note
C
A N
S L
I M
|
LKQ
-
NASDAQ
L K Q Corp
WHOLESALE - Auto Parts
|
$21.78
|
-0.12
-0.55% |
$22.24
|
1,656,642
75.77% of 50 DAV
50 DAV is 2,186,300
|
$22.29
-2.27%
|
8/9/2012
|
$18.97
|
PP = $18.72
|
|
MB = $19.66
|
Most Recent Note - 11/30/2012 4:43:41 PM
G - Holding its ground near its 52-week high today following a worrisome "negative reversal" and finish near the session low on 11/26/12 followed by additional losses on above average volume. Results below the +25% minimum earnings guideline (C criteria) for Sep '12 recently raised fundamental concerns. See the latest FSU analysis for more details and a new annotated graph.
>>> The latest Featured Stock Update with an annotated graph appeared on 11/30/2012. Click here.
View all notes |
Alert me of new notes |
CANSLIM.net Company Profile |
SEC |
Zacks Reports |
StockTalk |
News |
Chart |
Request a new note
C
A N
S L
I M
|
MIDD
-
NASDAQ
Middleby Corp
MANUFACTURING - Diversified Machinery
|
$126.73
|
-0.66
-0.52% |
$128.38
|
76,008
106.90% of 50 DAV
50 DAV is 71,100
|
$128.96
-1.73%
|
10/8/2012
|
$118.46
|
PP = $122.67
|
|
MB = $128.80
|
Most Recent Note - 12/3/2012 6:18:44 PM
Y - Still consolidating in a tight trading range near its all-time high. Recently reported earnings +23% on +18% sales for the Sep '12 quarter, below the +25% minimum earnings guideline (C criteria), raising fundamental concerns.
>>> The latest Featured Stock Update with an annotated graph appeared on 11/16/2012. Click here.
View all notes |
Alert me of new notes |
CANSLIM.net Company Profile |
SEC |
Zacks Reports |
StockTalk |
News |
Chart |
Request a new note
C
A N
S L
I M
|
Symbol/Exchange
Company Name
Industry Group |
PRICE |
CHANGE
(%Change) |
Day High |
Volume
(% DAV)
(% 50 day avg vol) |
52 Wk Hi
% From Hi |
Featured
Date |
Price
Featured |
Pivot Featured |
|
Max Buy |
RAX
-
NYSE
Rackspace Hosting Inc
INTERNET - Internet Software and; Services
|
$67.36
|
-1.76
-2.55% |
$69.49
|
1,272,094
78.43% of 50 DAV
50 DAV is 1,621,900
|
$70.00
-3.77%
|
11/26/2012
|
$66.26
|
PP = $67.18
|
|
MB = $70.54
|
Most Recent Note - 12/3/2012 6:36:05 PM
Y - Encountered mild distributional pressure today. Confirming gains above its pivot point with at least +40% above average volume would be a welcome reassurance. Disciplined investors may be wise to use a tactic called "pyramiding" to allow the market action to dictate their weighting in new buys while always limiting losses by selling if any stock ever falls more than -7% from their purchase price.
>>> The latest Featured Stock Update with an annotated graph appeared on 11/27/2012. Click here.
View all notes |
Alert me of new notes |
CANSLIM.net Company Profile |
SEC |
Zacks Reports |
StockTalk |
News |
Chart |
Request a new note
C
A N
S L
I M
|
RGR
-
NYSE
Sturm Ruger & Co Inc
CONSUMER DURABLES - Sporting Goods
|
$58.58
|
-0.01
-0.02% |
$58.88
|
830,163
177.99% of 50 DAV
50 DAV is 466,400
|
$60.11
-2.55%
|
11/20/2012
|
$52.23
|
PP = $52.65
|
|
MB = $55.28
|
Most Recent Note - 12/3/2012 12:25:59 PM
G - Pulling back from its 52-week high hit last week with volume running at an above average pace behind today's 2nd consecutive loss after a streak of 8 consecutive volume-driven gains. It is extended from its previously noted base and may form a high handle on its larger 7-month cup shaped base, however the minimum length for a proper handle is 1 week for it to be recognized as a valid cup-with-handle base. Prior highs near $52 define initial chart support to watch where violations may trigger technical sell signals.
>>> The latest Featured Stock Update with an annotated graph appeared on 11/21/2012. Click here.
View all notes |
Alert me of new notes |
CANSLIM.net Company Profile |
SEC |
Zacks Reports |
StockTalk |
News |
Chart |
Request a new note
C
A N
S L
I M
|
RNF
-
NYSE
Rentech Nitrogen Ptnr Lp
CHEMICALS - Agricultural Chemicals
|
$39.55
|
-0.36
-0.90% |
$40.49
|
304,460
78.03% of 50 DAV
50 DAV is 390,200
|
$41.15
-3.89%
|
11/1/2012
|
$39.11
|
PP = $40.15
|
|
MB = $42.16
|
Most Recent Note - 11/28/2012 5:21:02 PM
Y - It has tallied 4 consecutive gains with below average volume, recently indicating lackluster buying demand from the institutional crowd. Disciplined investors may watch for volume-driven gains for a new high close to trigger a technical buy signal.
>>> The latest Featured Stock Update with an annotated graph appeared on 11/26/2012. Click here.
View all notes |
Alert me of new notes |
CANSLIM.net Company Profile |
SEC |
Zacks Reports |
StockTalk |
News |
Chart |
Request a new note
C
A N
S L
I M
|
VSI
-
NYSE
Vitamin Shoppe Inc
SPECIALTY RETAIL - Specialty Retail, Other
|
$59.06
|
-0.20
-0.34% |
$59.95
|
311,484
125.65% of 50 DAV
50 DAV is 247,900
|
$61.89
-4.57%
|
12/3/2012
|
$59.06
|
PP = $61.99
|
|
MB = $65.09
|
Most Recent Note - 12/3/2012 5:58:56 PM
Y -Encountering mild distributional pressure. The $61 area has been a stubborn resistance level in recent months. See the latest FSU analysis for more details and a new annotated graph.
>>> The latest Featured Stock Update with an annotated graph appeared on 12/3/2012. Click here.
View all notes |
Alert me of new notes |
CANSLIM.net Company Profile |
SEC |
Zacks Reports |
StockTalk |
News |
Chart |
Request a new note
C
A N
S L
I M
|
WPI
-
NYSE
Watson Pharmaceuticals
DRUGS - Drugs - Generic
|
$88.02
|
+0.01
0.01% |
$89.45
|
933,915
119.12% of 50 DAV
50 DAV is 784,000
|
$90.00
-2.20%
|
8/24/2012
|
$82.90
|
PP = $81.10
|
|
MB = $85.16
|
Most Recent Note - 11/29/2012 1:05:50 PM
G - Consolidating above its 50 DMA line with little resistance remaining due to overhead supply. Quarterly comparisons for sales revenues and earnings increases have shown sequential deceleration in its growth rate raising some fundamental concerns, as recently noted.
>>> The latest Featured Stock Update with an annotated graph appeared on 11/23/2012. Click here.
View all notes |
Alert me of new notes |
CANSLIM.net Company Profile |
SEC |
Zacks Reports |
StockTalk |
News |
Chart |
Request a new note
C
A N
S L
I M
|
Symbol/Exchange
Company Name
Industry Group |
PRICE |
CHANGE
(%Change) |
Day High |
Volume
(% DAV)
(% 50 day avg vol) |
52 Wk Hi
% From Hi |
Featured
Date |
Price
Featured |
Pivot Featured |
|
Max Buy |
|
|
|
THESE ARE NOT BUY RECOMMENDATIONS!
Comments contained in the body of this report are technical
opinions only. The material herein has been obtained
from sources believed to be reliable and accurate, however,
its accuracy and completeness cannot be guaranteed.
This site is not an investment advisor, hence it does
not endorse or recommend any securities or other investments.
Any recommendation contained in this report may not
be suitable for all investors and it is not to be deemed
an offer or solicitation on our part with respect to
the purchase or sale of any securities. All trademarks,
service marks and trade names appearing in this report
are the property of their respective owners, and are
likewise used for identification purposes only.
This report is a service available
only to active Paid Premium Members.
You may opt-out of receiving report notifications
at any time. Questions or comments may be submitted
by writing to Premium Membership Services 665 S.E. 10 Street, Suite 201 Deerfield Beach, FL 33441-5634 or by calling 1-800-965-8307
or 954-785-1121.
|
|
|

