***Last / Change / Volume data in this table is the closing quote data***
Symbol/Exchange
Company Name
Industry Group |
PRICE |
CHANGE
(%Change) |
Day High |
Volume
(% DAV)
(% 50 day avg vol) |
52 Wk Hi
% From Hi |
Featured
Date |
Price
Featured |
Pivot Featured |
|
Max Buy |
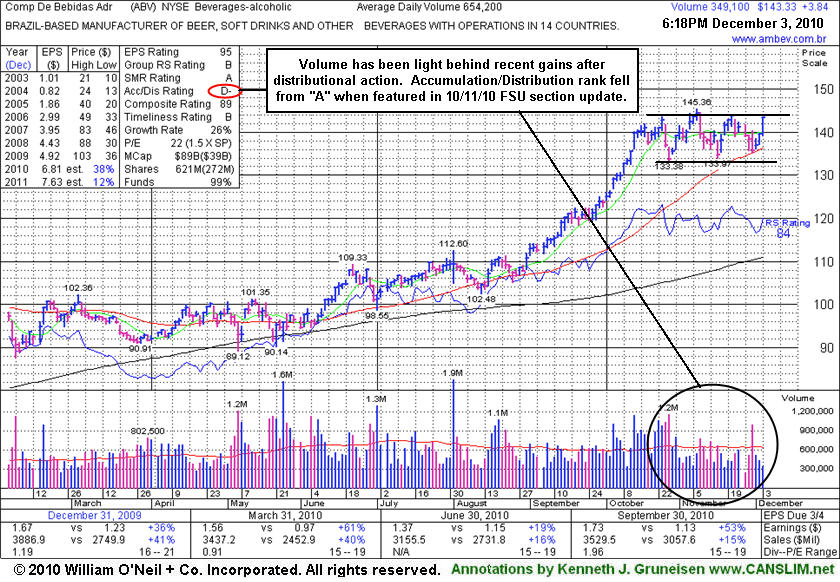
ABV
-
NYSE
Comp De Bebidas Adr
FOOD and BEVERAGE - Beverages - Brewers
|
$143.33
|
+3.84
2.75% |
$143.50
|
349,229
52.99% of 50 DAV
50 DAV is 659,000
|
$145.36
-1.40%
|
11/4/2010
|
$142.35
|
PP = $143.63
|
|
MB = $150.81
|
 Most Recent Note - 12/3/2010 4:26:49 PM
Y - It posted a considerable gain on light volume today, rallying near its 52-week high. A convincing gain with above average volume has not been seen since October, and recent distributional pressure remains a concern until proof of fresh institutional buying demand is shown. Color code is changed to yellow based on its recent resilience.
>>> The latest Featured Stock Update with an annotated graph appeared on 12/3/2010. Click here.
View all notes |
Alert me of new notes |
CANSLIM.net Company Profile |
SEC |
Zacks Reports |
StockTalk |
News |
Chart |
Request a new note
C
A N
S L
I M


|
ARUN
-
NASDAQ
Aruba Networks Inc
COMPUTER HARDWARE - Networking andamp; Communication Dev
|
$23.02
|
+0.02
0.09% |
$23.24
|
2,230,254
83.75% of 50 DAV
50 DAV is 2,663,100
|
$24.28
-5.19%
|
8/30/2010
|
$18.12
|
PP = $18.51
|
|
MB = $19.44
|
Most Recent Note - 12/1/2010 5:14:56 PM
G - Considerable gain today with heavy volume promptly repaired the prior session's 50 DMA line violation, a sign of great institutional support. It made a stand near an upward trendline connecting May - November lows previously noted as support to watch.
>>> The latest Featured Stock Update with an annotated graph appeared on 10/26/2010. Click here.
View all notes |
Alert me of new notes |
CANSLIM.net Company Profile |
SEC |
Zacks Reports |
StockTalk |
News |
Chart |
Request a new note
C
A N
S L
I M
|
BIDU
-
NASDAQ
Baidu Inc Ads
INTERNET - Internet Information Providers
|
$109.23
|
+2.86
2.69% |
$109.87
|
9,365,692
76.76% of 50 DAV
50 DAV is 12,201,400
|
$115.04
-5.05%
|
9/17/2010
|
$85.73
|
PP = $88.42
|
|
MB = $92.84
|
Most Recent Note - 12/3/2010 5:37:04 PM
G - Rallied today with light volume after testing important support at its 50 DMA line. Any damaging violation of its short-term average or recent chart low ($103.11 on 11/16/10) would raise greater concerns and trigger technical sell signals. BIDU has been noted as a riskier "late stage" candidate, yet could produce more climactic gains.
>>> The latest Featured Stock Update with an annotated graph appeared on 11/30/2010. Click here.
View all notes |
Alert me of new notes |
CANSLIM.net Company Profile |
SEC |
Zacks Reports |
StockTalk |
News |
Chart |
Request a new note
C
A N
S L
I M
|
CACC
-
NASDAQ
Credit Acceptance Corp
FINANCIAL SERVICES - Credit Services
|
$61.92
|
-0.08
-0.13% |
$61.96
|
15,588
63.37% of 50 DAV
50 DAV is 24,600
|
$63.45
-2.41%
|
11/22/2010
|
$59.97
|
PP = $62.00
|
|
MB = $65.10
|
Most Recent Note - 12/1/2010 5:20:32 PM
Y - Another small loss today with light volume has its slumping slightly under its pivot point, yet the M criteria has now been reconfirmed by a solid follow-through day. Its 11/29/10 gain with +69% above average volume helped it rally above the pivot point of a "double bottom" type base pattern, meeting the guidelines for a new (or add-on) technical buy signal. Additional volume driven gains would be a reassuring sign.
>>> The latest Featured Stock Update with an annotated graph appeared on 10/29/2010. Click here.
View all notes |
Alert me of new notes |
CANSLIM.net Company Profile |
SEC |
Zacks Reports |
StockTalk |
News |
Chart |
Request a new note
C
A N
S L
I M
|
CIS
-
NYSE
Camelot Info Systems Ads
COMPUTER SOFTWARE andamp; SERVICES - Information Technology Service
|
$23.31
|
+0.31
1.35% |
$23.46
|
240,071
79.92% of 50 DAV
50 DAV is 300,400
|
$24.89
-6.35%
|
11/26/2010
|
$18.93
|
PP = $19.72
|
|
MB = $20.71
|
Most Recent Note - 12/2/2010 11:15:38 AM
G - Pulling back today, it quickly got extended from a sound base. Prior highs in the $19.50 area define chart support to watch following its recent streak of volume-driven gains.
>>> The latest Featured Stock Update with an annotated graph appeared on 11/26/2010. Click here.
View all notes |
Alert me of new notes |
CANSLIM.net Company Profile |
SEC |
Zacks Reports |
StockTalk |
News |
Chart |
Request a new note
C
A N
S L
I M
|
Symbol/Exchange
Company Name
Industry Group |
PRICE |
CHANGE
(%Change) |
Day High |
Volume
(% DAV)
(% 50 day avg vol) |
52 Wk Hi
% From Hi |
Featured
Date |
Price
Featured |
Pivot Featured |
|
Max Buy |
CMG
-
NYSE
Chipotle Mexican Grill
LEISURE - Restaurants
|
$235.95
|
-15.01
-5.98% |
$247.38
|
4,051,197
443.53% of 50 DAV
50 DAV is 913,400
|
$262.78
-10.21%
|
9/1/2010
|
$158.31
|
PP = $155.52
|
|
MB = $163.30
|
Most Recent Note - 12/3/2010 4:31:11 PM
G - Gapped down today and suffered a damaging distributional loss with 4 times average volume. It was repeatedly noted as -"Extended from any sound base pattern." Its 50 DMA line (now $209) defines the nearest chart support level.
>>> The latest Featured Stock Update with an annotated graph appeared on 10/28/2010. Click here.
View all notes |
Alert me of new notes |
CANSLIM.net Company Profile |
SEC |
Zacks Reports |
StockTalk |
News |
Chart |
Request a new note
C
A N
S L
I M
|
DECK
-
NASDAQ
Deckers Outdoor Corp
CONSUMER NON-DURABLES - Textile - Apparel Footwear
|
$82.88
|
+5.08
6.53% |
$82.97
|
4,500,187
315.91% of 50 DAV
50 DAV is 1,424,500
|
$79.85
3.79%
|
10/27/2010
|
$54.16
|
PP = $54.86
|
|
MB = $57.60
|
Most Recent Note - 12/3/2010 4:39:46 PM
G - Finished near its session high with heavy volume behind its gain today and its recent streak of consecutive gains to new all-time highs. Very extended from its latest sound base, its prior highs and its 50 DMA line define the nearest chart support.
>>> The latest Featured Stock Update with an annotated graph appeared on 10/27/2010. Click here.
View all notes |
Alert me of new notes |
CANSLIM.net Company Profile |
SEC |
Zacks Reports |
StockTalk |
News |
Chart |
Request a new note
C
A N
S L
I M
|
EZCH
-
NASDAQ
Ezchip Semiconductor Ltd
ELECTRONICS - Semiconductor - Specialized
|
$27.83
|
-0.10
-0.36% |
$28.11
|
413,480
170.02% of 50 DAV
50 DAV is 243,200
|
$27.95
-0.43%
|
12/2/2010
|
$27.53
|
PP = $26.00
|
|
MB = $27.30
|
Most Recent Note - 12/3/2010 4:40:46 PM
Y - Held its ground today. On the prior session it blasted out of an orderly "double bottom" type base with pivot point cited based on its 11/08/10 high. Sales and earnings increases have been strong. It may be considered a "breakaway gap" which is the one noted exception that allows investors to chase a stock more than +5% above its pivot point. Patient investors may find chances to accumulate on pullbacks. See the latest Featured Stock Update (FSU) analysis with annotated graph.
>>> The latest Featured Stock Update with an annotated graph appeared on 12/2/2010. Click here.
View all notes |
Alert me of new notes |
CANSLIM.net Company Profile |
SEC |
Zacks Reports |
StockTalk |
News |
Chart |
Request a new note
C
A N
S L
I M
|
EZPW
-
NASDAQ
Ezcorp Inc Cl A
SPECIALTY RETAIL - Specialty Retail, Other
|
$26.61
|
-0.66
-2.42% |
$27.30
|
399,274
131.73% of 50 DAV
50 DAV is 303,100
|
$27.67
-3.83%
|
11/5/2010
|
$24.02
|
PP = $23.85
|
|
MB = $25.04
|
Most Recent Note - 12/3/2010 4:55:28 PM
G - Pulled back on lighter volume today after spiking to new all-time highs this week, getting extended from a sound base pattern. Prior highs in the $22-23 area define chart support to watch near its 50 DMA line.
>>> The latest Featured Stock Update with an annotated graph appeared on 11/6/2010. Click here.
View all notes |
Alert me of new notes |
CANSLIM.net Company Profile |
SEC |
Zacks Reports |
StockTalk |
News |
Chart |
Request a new note
C
A N
S L
I M
|
FFIV
-
NASDAQ
F 5 Networks Inc
INTERNET - Internet Software and Services
|
$139.28
|
+2.13
1.55% |
$141.62
|
2,320,603
80.31% of 50 DAV
50 DAV is 2,889,600
|
$139.59
-0.22%
|
6/16/2010
|
$74.50
|
PP = $74.10
|
|
MB = $77.81
|
Most Recent Note - 12/3/2010 4:58:10 PM
G - Light volume gain today for another new all-time high. Extended from any sound base pattern. Prior highs in the $112 area define initial chart support.
>>> The latest Featured Stock Update with an annotated graph appeared on 11/15/2010. Click here.
View all notes |
Alert me of new notes |
CANSLIM.net Company Profile |
SEC |
Zacks Reports |
StockTalk |
News |
Chart |
Request a new note
C
A N
S L
I M
|
Symbol/Exchange
Company Name
Industry Group |
PRICE |
CHANGE
(%Change) |
Day High |
Volume
(% DAV)
(% 50 day avg vol) |
52 Wk Hi
% From Hi |
Featured
Date |
Price
Featured |
Pivot Featured |
|
Max Buy |
FOSL
-
NASDAQ
Fossil Inc
CONSUMER DURABLES - Recreational Goods, Other
|
$72.26
|
-0.52
-0.71% |
$72.99
|
578,737
71.68% of 50 DAV
50 DAV is 807,400
|
$73.01
-1.03%
|
11/26/2010
|
$69.10
|
PP = $70.17
|
|
MB = $73.68
|
Most Recent Note - 12/3/2010 5:07:18 PM
Y - Held its ground today. It rallied to a new all-time high above its pivot point with volume +147% above average behind its considerable 12/02/10 gain, triggering a technical buy signal after an advanced "3-weeks tight" pattern.
>>> The latest Featured Stock Update with an annotated graph appeared on 11/29/2010. Click here.
View all notes |
Alert me of new notes |
CANSLIM.net Company Profile |
SEC |
Zacks Reports |
StockTalk |
News |
Chart |
Request a new note
C
A N
S L
I M
|
HMSY
-
NASDAQ
H M S Holdings Corp
COMPUTER SOFTWARE and SERVICES - Healthcare Information Service
|
$65.27
|
+0.63
0.97% |
$65.44
|
128,773
62.54% of 50 DAV
50 DAV is 205,900
|
$64.65
0.96%
|
11/19/2010
|
$61.89
|
PP = $63.01
|
|
MB = $66.16
|
Most Recent Note - 12/3/2010 5:58:29 PM
Y - Volume total was light behind today's 3rd consecutive gain as it traded further above its pivot point for another new 52-week high. Volume did not meet the guideline to trigger a proper new (or add-on) technical buy signal. Its 50 DMA line defines important support to watch.
>>> The latest Featured Stock Update with an annotated graph appeared on 11/19/2010. Click here.
View all notes |
Alert me of new notes |
CANSLIM.net Company Profile |
SEC |
Zacks Reports |
StockTalk |
News |
Chart |
Request a new note
C
A N
S L
I M
|
HS
-
NYSE
Healthspring Inc
HEALTH SERVICES - Health Care Plans
|
$28.75
|
+0.52
1.84% |
$28.84
|
332,714
51.74% of 50 DAV
50 DAV is 643,100
|
$29.80
-3.52%
|
8/27/2010
|
$19.91
|
PP = $19.75
|
|
MB = $20.74
|
Most Recent Note - 12/3/2010 5:55:25 PM
G - Finished at its second-best close ever today after gains with light volume this week helped it rally from support at its 50 DMA line. It tested that important short-term average for the first time since August, meanwhile any more damaging losses would raise concerns and trigger a technical sell signal.
>>> The latest Featured Stock Update with an annotated graph appeared on 10/22/2010. Click here.
View all notes |
Alert me of new notes |
CANSLIM.net Company Profile |
SEC |
Zacks Reports |
StockTalk |
News |
Chart |
Request a new note
C
A N
S L
I M
|
JOBS
-
NASDAQ
Fifty One Job Inc Ads
DIVERSIFIED SERVICES - Staffing and; Outsourcing Service
|
$52.00
|
-0.17
-0.33% |
$52.71
|
72,042
37.44% of 50 DAV
50 DAV is 192,400
|
$52.99
-1.87%
|
10/13/2010
|
$42.07
|
PP = $40.60
|
|
MB = $42.63
|
Most Recent Note - 12/1/2010 5:42:14 PM
G - Gapped up today for a new 52-week high. It is extended from a sound base, and its 50 DMA line defines important support to watch.
>>> The latest Featured Stock Update with an annotated graph appeared on 11/16/2010. Click here.
View all notes |
Alert me of new notes |
CANSLIM.net Company Profile |
SEC |
Zacks Reports |
StockTalk |
News |
Chart |
Request a new note
C
A N
S L
I M
|
LFT
-
NYSE
Longtop Financl Tech Ads
COMPUTER SOFTWARE and SERVICES - Business Software and Services
|
$39.75
|
+0.26
0.66% |
$39.87
|
120,307
22.81% of 50 DAV
50 DAV is 527,500
|
$42.86
-7.26%
|
11/5/2010
|
$41.83
|
PP = $40.96
|
|
MB = $43.01
|
Most Recent Note - 12/3/2010 5:51:03 PM
Y - Perched -7.3% off its all-time high, above support near its 50 DMA line, it traded very light volume today. More damaging losses leading to a violation of the short-term average would raise concerns and trigger a technical sell signal.
>>> The latest Featured Stock Update with an annotated graph appeared on 10/14/2010. Click here.
View all notes |
Alert me of new notes |
CANSLIM.net Company Profile |
SEC |
Zacks Reports |
StockTalk |
News |
Chart |
Request a new note
C
A N
S L
I M
|
Symbol/Exchange
Company Name
Industry Group |
PRICE |
CHANGE
(%Change) |
Day High |
Volume
(% DAV)
(% 50 day avg vol) |
52 Wk Hi
% From Hi |
Featured
Date |
Price
Featured |
Pivot Featured |
|
Max Buy |
LULU
-
NASDAQ
Lululemon Athletica
MANUFACTURING - Textile Manufacturing
|
$53.38
|
+0.01
0.02% |
$53.90
|
1,578,020
147.26% of 50 DAV
50 DAV is 1,071,600
|
$54.84
-2.66%
|
10/8/2010
|
$47.66
|
PP = $46.67
|
|
MB = $49.00
|
Most Recent Note - 12/3/2010 5:52:24 PM
G - Gapped down today but closed with a gain after a positive reversal. Prior highs in the $46-48 area define chart support to watch along with its 50 DMA line.
>>> The latest Featured Stock Update with an annotated graph appeared on 12/1/2010. Click here.
View all notes |
Alert me of new notes |
CANSLIM.net Company Profile |
SEC |
Zacks Reports |
StockTalk |
News |
Chart |
Request a new note
C
A N
S L
I M
|
MWIV
-
NASDAQ
M W I Veterinary Supply
HEALTH SERVICES - Medical Instruments and; Supplies
|
$61.50
|
-0.47
-0.76% |
$61.99
|
45,732
83.76% of 50 DAV
50 DAV is 54,600
|
$63.94
-3.82%
|
11/4/2010
|
$61.79
|
PP = $59.60
|
|
MB = $62.58
|
Most Recent Note - 12/1/2010 5:49:05 PM
Y - Gap up gain today on below average volume for its best ever close. Its 50 DMA line has been repeatedly noted as a very important support level. It stalled after hitting its all-time high on 11/04/10, yet held its ground stubbornly above its short-term average.
>>> The latest Featured Stock Update with an annotated graph appeared on 11/2/2010. Click here.
View all notes |
Alert me of new notes |
CANSLIM.net Company Profile |
SEC |
Zacks Reports |
StockTalk |
News |
Chart |
Request a new note
C
A N
S L
I M
|
NEOG
-
NASDAQ
Neogen Corp
DRUGS - Diagnostic Substances
|
$37.95
|
-0.35
-0.91% |
$38.16
|
75,760
95.30% of 50 DAV
50 DAV is 79,500
|
$38.97
-2.62%
|
9/1/2010
|
$30.79
|
PP = $30.49
|
|
MB = $32.01
|
Most Recent Note - 12/1/2010 5:50:51 PM
G - Gapped up for a gain today with above average volume to a new all-time high. It is extended from any sound base, and its 50 DMA line recently has been a reliable support level.
>>> The latest Featured Stock Update with an annotated graph appeared on 10/13/2010. Click here.
View all notes |
Alert me of new notes |
CANSLIM.net Company Profile |
SEC |
Zacks Reports |
StockTalk |
News |
Chart |
Request a new note
C
A N
S L
I M
|
NFLX
-
NASDAQ
Netflix Inc
SPECIALTY RETAIL - Music and Video Stores
|
$185.45
|
-7.97
-4.12% |
$195.20
|
8,981,327
148.61% of 50 DAV
50 DAV is 6,043,400
|
$206.80
-10.32%
|
11/9/2010
|
$173.10
|
PP = $184.84
|
|
MB = $194.08
|
Most Recent Note - 12/3/2010 5:11:41 PM
G - Sinking near prior highs, yet still well above its 50 DMA line, it endured heavy distributional pressure this week after a "negative reversal" at its all-time high on 12/01/10.
>>> The latest Featured Stock Update with an annotated graph appeared on 11/24/2010. Click here.
View all notes |
Alert me of new notes |
CANSLIM.net Company Profile |
SEC |
Zacks Reports |
StockTalk |
News |
Chart |
Request a new note
C
A N
S L
I M
|
NTAP
-
NASDAQ
Netapp Inc
COMPUTER HARDWARE - Data Storage Devices
|
$54.07
|
+0.23
0.43% |
$54.57
|
4,054,608
56.68% of 50 DAV
50 DAV is 7,153,200
|
$57.96
-6.71%
|
9/8/2010
|
$46.98
|
PP = $44.99
|
|
MB = $47.24
|
Most Recent Note - 12/2/2010 4:20:28 PM
G - Rallying further above its 50 DMA line with a third consecutive gain on near average volume. It is not near a sound base pattern, but the gain above its short-term average improves its technical stance.
>>> The latest Featured Stock Update with an annotated graph appeared on 11/3/2010. Click here.
View all notes |
Alert me of new notes |
CANSLIM.net Company Profile |
SEC |
Zacks Reports |
StockTalk |
News |
Chart |
Request a new note
C
A N
S L
I M
|
Symbol/Exchange
Company Name
Industry Group |
PRICE |
CHANGE
(%Change) |
Day High |
Volume
(% DAV)
(% 50 day avg vol) |
52 Wk Hi
% From Hi |
Featured
Date |
Price
Featured |
Pivot Featured |
|
Max Buy |
ORCL
-
NASDAQ
Oracle Corp
COMPUTER SOFTWARE and SERVICES - Application Software
|
$28.81
|
+0.71
2.53% |
$28.90
|
34,454,687
101.34% of 50 DAV
50 DAV is 33,999,800
|
$29.82
-3.39%
|
9/20/2010
|
$27.32
|
PP = $26.73
|
|
MB = $28.07
|
Most Recent Note - 12/3/2010 5:29:57 PM
Y - Gains on near-average volume helped it rally back above its 50 DMA line this week, helping its outlook to improve, technically. Color code is changed to yellow based on recent resilience.
>>> The latest Featured Stock Update with an annotated graph appeared on 11/18/2010. Click here.
View all notes |
Alert me of new notes |
CANSLIM.net Company Profile |
SEC |
Zacks Reports |
StockTalk |
News |
Chart |
Request a new note
C
A N
S L
I M
|
PAY
-
NYSE
Verifone Systems Inc
COMPUTER HARDWARE - Transaction Automation Systems
|
$39.87
|
+3.11
8.46% |
$40.23
|
5,849,561
436.24% of 50 DAV
50 DAV is 1,340,900
|
$37.08
7.52%
|
11/29/2010
|
$33.96
|
PP = $36.04
|
|
MB = $37.84
|
Most Recent Note - 12/3/2010 5:31:31 PM
G - Gapped up today and rallied for a considerable gain and new 52-week high. Color code was changed to green. Noted on 12/02/10 - "Rallied above the new pivot point cited. Its considerable gain on more than than 2 times average volume triggered a technical buy signal while rising from a previously noted advanced 'ascending base' pattern."
>>> The latest Featured Stock Update with an annotated graph appeared on 10/25/2010. Click here.
View all notes |
Alert me of new notes |
CANSLIM.net Company Profile |
SEC |
Zacks Reports |
StockTalk |
News |
Chart |
Request a new note
C
A N
S L
I M
|
RAX
-
NYSE
Rackspace Hosting Inc
INTERNET - Internet Software and; Services
|
$30.20
|
+0.59
1.99% |
$30.28
|
1,069,249
41.33% of 50 DAV
50 DAV is 2,586,800
|
$30.49
-0.95%
|
9/21/2010
|
$22.84
|
PP = $23.61
|
|
MB = $24.79
|
Most Recent Note - 12/3/2010 5:56:46 PM
G - Small gain on light volume today for a best-ever close. Volume totals have been below average in recent weeks. No resistance remains due to overhead supply, but it is extended from any sound base.
>>> The latest Featured Stock Update with an annotated graph appeared on 11/17/2010. Click here.
View all notes |
Alert me of new notes |
CANSLIM.net Company Profile |
SEC |
Zacks Reports |
StockTalk |
News |
Chart |
Request a new note
C
A N
S L
I M
|
ROVI
-
NASDAQ
Rovi Corp
COMPUTER SOFTWARE andamp; SERVICES - Security Software andamp; Services
|
$55.90
|
+1.43
2.63% |
$56.07
|
1,111,292
82.90% of 50 DAV
50 DAV is 1,340,600
|
$55.58
0.58%
|
10/29/2010
|
$49.99
|
PP = $53.10
|
|
MB = $55.76
|
Most Recent Note - 12/3/2010 5:41:26 PM
G - Gain today for a new high close above its "max buy" level" without great volume conviction. Color code is changed to green after getting extended from its latest base without enough volume behind gains in recent weeks to trigger a proper new (or add-on) technical buy signal. Meanwhile, its 50 DMA line defines important support to watch.
>>> The latest Featured Stock Update with an annotated graph appeared on 10/20/2010. Click here.
View all notes |
Alert me of new notes |
CANSLIM.net Company Profile |
SEC |
Zacks Reports |
StockTalk |
News |
Chart |
Request a new note
C
A N
S L
I M
|
SHOO
-
NASDAQ
Steven Madden Limited
CONSUMER NON-DURABLES - Textile - Apparel Footwear
|
$46.14
|
+0.33
0.72% |
$46.37
|
166,701
46.34% of 50 DAV
50 DAV is 359,700
|
$46.75
-1.30%
|
11/23/2010
|
$44.61
|
PP = $44.95
|
|
MB = $47.20
|
Most Recent Note - 12/3/2010 5:43:46 PM
Y - Holding its ground with volume totals cooling since its 11/29/10 gain above the new pivot point cited with twice average volume met the guidelines for a new (or add-on) technical buy signal. No resistance remains due to overhead supply.
>>> The latest Featured Stock Update with an annotated graph appeared on 11/23/2010. Click here.
View all notes |
Alert me of new notes |
CANSLIM.net Company Profile |
SEC |
Zacks Reports |
StockTalk |
News |
Chart |
Request a new note
C
A N
S L
I M
|
Symbol/Exchange
Company Name
Industry Group |
PRICE |
CHANGE
(%Change) |
Day High |
Volume
(% DAV)
(% 50 day avg vol) |
52 Wk Hi
% From Hi |
Featured
Date |
Price
Featured |
Pivot Featured |
|
Max Buy |
SLW
-
NYSE
Silver Wheaton Corp
METALS and; MINING - Silver
|
$39.31
|
+1.02
2.66% |
$39.50
|
9,661,496
100.85% of 50 DAV
50 DAV is 9,579,900
|
$38.71
1.55%
|
8/25/2010
|
$21.40
|
PP = $21.99
|
|
MB = $23.09
|
Most Recent Note - 12/3/2010 5:33:01 PM
G - Up today with above average volume behind a 5th consecutive gain for another new all-time high. It is extended from any sound base, and the recent low ($30.52 on 11/16/10) defines initial support above its 50 DMA line.
>>> The latest Featured Stock Update with an annotated graph appeared on 10/18/2010. Click here.
View all notes |
Alert me of new notes |
CANSLIM.net Company Profile |
SEC |
Zacks Reports |
StockTalk |
News |
Chart |
Request a new note
C
A N
S L
I M
|
UA
-
NYSE
Under Armour Inc Cl A
CONSUMER NON-DURABLES - Textile - Apparel Clothing
|
$59.03
|
+0.94
1.62% |
$59.19
|
530,807
73.74% of 50 DAV
50 DAV is 719,800
|
$59.08
-0.08%
|
9/9/2010
|
$39.99
|
PP = $40.10
|
|
MB = $42.11
|
Most Recent Note - 12/1/2010 6:06:04 PM
G - Hit yet another new 52-week high today, but closed near the session low. The high-ranked Apparel - Clothing firm is very extended from any sound base and well above support at its 50 DMA line.
>>> The latest Featured Stock Update with an annotated graph appeared on 11/4/2010. Click here.
View all notes |
Alert me of new notes |
CANSLIM.net Company Profile |
SEC |
Zacks Reports |
StockTalk |
News |
Chart |
Request a new note
C
A N
S L
I M
|
ULTA
-
NASDAQ
Ulta Salon Cosm & Frag
SPECIALTY RETAIL - Specialty Retail, Other
|
$35.22
|
-0.50
-1.40% |
$35.58
|
1,773,567
391.69% of 50 DAV
50 DAV is 452,800
|
$37.24
-5.42%
|
9/3/2010
|
$26.36
|
PP = $25.89
|
|
MB = $27.18
|
Most Recent Note - 12/3/2010 5:14:34 PM
G - Finished in the upper third of its intra-day range today but endured distributional pressure this week after hitting a new all-time high. It is extended from any recent base, meanwhile, its 50 DMA line defines initial support to watch.
>>> The latest Featured Stock Update with an annotated graph appeared on 11/1/2010. Click here.
View all notes |
Alert me of new notes |
CANSLIM.net Company Profile |
SEC |
Zacks Reports |
StockTalk |
News |
Chart |
Request a new note
C
A N
S L
I M
|
VIT
-
NYSE
Vanceinfo Tech Inc Ads
COMPUTER SOFTWARE and SERVICES - Business Software and Services
|
$38.95
|
-1.38
-3.42% |
$41.06
|
887,763
143.67% of 50 DAV
50 DAV is 617,900
|
$40.72
-4.35%
|
7/8/2010
|
$25.20
|
PP = $26.58
|
|
MB = $27.91
|
Most Recent Note - 12/3/2010 5:26:51 PM
G - After a negative reversal an all-time high it finished near the session low today with above average volume behind the loss. Completed a Public Offering on 11/23/10. It 50 DMA line has acted as support recently, but it has not formed a sound base recently.
>>> The latest Featured Stock Update with an annotated graph appeared on 10/21/2010. Click here.
View all notes |
Alert me of new notes |
CANSLIM.net Company Profile |
SEC |
Zacks Reports |
StockTalk |
News |
Chart |
Request a new note
C
A N
S L
I M
|