***Last / Change / Volume data in this table is the closing quote data***
Symbol/Exchange
Company Name
Industry Group |
PRICE |
CHANGE
(%Change) |
Day High |
Volume
(% DAV)
(% 50 day avg vol) |
52 Wk Hi
% From Hi |
Featured
Date |
Price
Featured |
Pivot Featured |
|
Max Buy |
BITA
-
NYSE
Bitauto Hldgs Ltd Ads
INTERNET - Internet Information Providers
|
$32.39
|
+0.89
2.83% |
$32.80
|
990,996
87.30% of 50 DAV
50 DAV is 1,135,200
|
$35.04
-7.56%
|
9/24/2013
|
$16.40
|
PP = $17.31
|
|
MB = $18.18
|
Most Recent Note - 11/29/2013 10:53:00 AM
G - Hovering near its 52-week high, very extended from any sound base. Its prior high in the $28 area define initial support to watch on pullbacks.
>>> FEATURED STOCK ARTICLE : Consolidating After Getting Extended From Prior Base - 11/11/2013
View all notes |
Set NEW NOTE alert |
CANSLIM.net Company Profile |
SEC
News |
Chart |
Request a new note
C
A N
S L
I M


|
CELG
-
NASDAQ
Celgene Corp
DRUGS - Drug Manufacturers - Major
|
$163.11
|
+1.34
0.83% |
$163.18
|
1,831,459
62.05% of 50 DAV
50 DAV is 2,951,400
|
$165.74
-1.59%
|
9/12/2013
|
$149.50
|
PP = $150.02
|
|
MB = $157.52
|
Most Recent Note - 11/29/2013 2:54:45 PM
G - Hovering near its 52-week and all-time highs with volume totals cooling after volume-driven gains to new highs. Earnings +21% on +18% sales revenues for the Sep '13 quarter were below the +25% minimum guideline (C criteria) raising fundamental concerns.
>>> FEATURED STOCK ARTICLE : Testing 50-Day Average Following Sub Par Earnings Increase - 11/1/2013
View all notes |
Set NEW NOTE alert |
CANSLIM.net Company Profile |
SEC
News |
Chart |
Request a new note
C
A N
S L
I M
|
EGOV
-
NASDAQ
N I C Inc
INTERNET - Internet Software and Services
|
$23.48
|
-0.90
-3.69% |
$24.30
|
279,456
91.75% of 50 DAV
50 DAV is 304,600
|
$25.99
-9.66%
|
10/18/2013
|
$25.17
|
PP = $23.66
|
|
MB = $24.84
|
 Most Recent Note - 12/2/2013 6:04:50 PM
G - Down considerably today with near average but higher volume indicative of mild distributional pressure. Disciplined investors always limit losses by selling any stock that falls more than -7% from their purchase price.
>>> FEATURED STOCK ARTICLE : Finding Support Near 50-Day Average During Distributional Pressure - 11/25/2013
View all notes |
Set NEW NOTE alert |
CANSLIM.net Company Profile |
SEC
News |
Chart |
Request a new note
C
A N
S L
I M
|
FLT
-
NYSE
Fleetcor Technologies
DIVERSIFIED SERVICES - Business/Management Services
|
$122.70
|
+0.92
0.76% |
$123.96
|
838,385
100.37% of 50 DAV
50 DAV is 835,300
|
$122.79
-0.07%
|
8/19/2013
|
$99.01
|
PP = $100.97
|
|
MB = $106.02
|
Most Recent Note - 11/26/2013 7:23:39 PM
G - Churned heavy volume today while perched at its all-time high, extended from any sound base. Its 50 DMA line ($112.43 now) defines near-term support to watch on pullbacks.
>>> FEATURED STOCK ARTICLE : Perched Near All-Time High Tallying Quiet Gains - 11/13/2013
View all notes |
Set NEW NOTE alert |
CANSLIM.net Company Profile |
SEC
News |
Chart |
Request a new note
C
A N
S L
I M
|
GNRC
-
NYSE
Generac Hldgs Inc
CONSUMER DURABLES - Electronic Equipment
|
$52.75
|
-0.51
-0.96% |
$53.71
|
705,027
83.81% of 50 DAV
50 DAV is 841,200
|
$53.74
-1.83%
|
11/26/2013
|
$53.02
|
PP = $52.42
|
|
MB = $55.04
|
Most Recent Note - 11/29/2013 2:46:49 PM
Y - Perched at its 52-week high today. Prior highs in the $52 area define initial support to watch after its breakout from a short flat base with +59% above average volume triggered a new (or-add on) technical buy signal. See the latest FSU analysis for more details and new annotated daily and weekly graphs.
>>> FEATURED STOCK ARTICLE : Following Latest Breakout Prior Highs Define Support - 11/29/2013
View all notes |
Set NEW NOTE alert |
CANSLIM.net Company Profile |
SEC
News |
Chart |
Request a new note
C
A N
S L
I M
|
Symbol/Exchange
Company Name
Industry Group |
PRICE |
CHANGE
(%Change) |
Day High |
Volume
(% DAV)
(% 50 day avg vol) |
52 Wk Hi
% From Hi |
Featured
Date |
Price
Featured |
Pivot Featured |
|
Max Buy |
HLF
-
NYSE
Herbalife Ltd
DRUGS - Nutrition and Weight Management
|
$71.85
|
+2.17
3.11% |
$72.15
|
1,714,808
68.30% of 50 DAV
50 DAV is 2,510,700
|
$74.94
-4.12%
|
11/22/2013
|
$72.21
|
PP = $75.04
|
|
MB = $78.79
|
Most Recent Note - 11/29/2013 2:48:44 PM
Y - Subsequent volume-driven gains for new highs may trigger a technical buy signal. Volume totals have been cooling while consolidating above its 50 DMA line and within close striking distance of its 52-week high.
>>> FEATURED STOCK ARTICLE : Perched Near Highs Following Rebound - 11/22/2013
View all notes |
Set NEW NOTE alert |
CANSLIM.net Company Profile |
SEC
News |
Chart |
Request a new note
C
A N
S L
I M
|
JAZZ
-
NASDAQ
Jazz Pharmaceuticals Plc
DRUGS - Biotechnology
|
$117.75
|
+0.83
0.71% |
$117.80
|
555,890
73.57% of 50 DAV
50 DAV is 755,600
|
$118.80
-0.88%
|
9/30/2013
|
$93.20
|
PP = $89.10
|
|
MB = $93.56
|
Most Recent Note - 11/27/2013 6:29:34 PM
G- Hovering near its 52-week high, extended from any sound base. Prior notes reminded members - "Disciplined investors avoid chasing stocks more than +5% above prior highs and always limit losses by selling any stock that falls more than -7% from their purchase price."
>>> FEATURED STOCK ARTICLE : Hovering Near All-Time Highs Following Volume-Driven Gains - 11/7/2013
View all notes |
Set NEW NOTE alert |
CANSLIM.net Company Profile |
SEC
News |
Chart |
Request a new note
C
A N
S L
I M
|
KORS
-
NYSE
Michael Kors Hldgs Ltd
RETAIL - Apparel Stores
|
$81.76
|
+0.21
0.26% |
$82.19
|
1,733,227
38.41% of 50 DAV
50 DAV is 4,512,000
|
$83.13
-1.65%
|
8/6/2013
|
$69.66
|
PP = $66.28
|
|
MB = $69.59
|
Most Recent Note - 11/27/2013 6:31:02 PM
G - Volume totals have still been cooling while hovering in a tight range near all-time highs, stubbornly holding its ground. Prior highs in the $78 area define near-term support above its 50 DMA line.
>>> FEATURED STOCK ARTICLE : Hitting New Highs After Choppy Consolidation - 11/6/2013
View all notes |
Set NEW NOTE alert |
CANSLIM.net Company Profile |
SEC
News |
Chart |
Request a new note
C
A N
S L
I M
|
LOPE
-
NASDAQ
Grand Canyon Education
DIVERSIFIED SERVICES - Education and; Training Services
|
$45.03
|
-0.51
-1.12% |
$46.33
|
310,962
74.14% of 50 DAV
50 DAV is 419,400
|
$50.48
-10.80%
|
6/19/2013
|
$31.47
|
PP = $34.17
|
|
MB = $35.88
|
Most Recent Note - 11/26/2013 7:15:11 PM
G - Its 50 DMA line defines support. See the latest FSU analysis for more details and new annotated daily and weekly graphs. Repeatedly noted - "Fundamental concerns remain while technical action has been reassuring."
>>> FEATURED STOCK ARTICLE : Fundamental Concerns Noted While Consolidating Above 50-Day Moving Average - 11/26/2013
View all notes |
Set NEW NOTE alert |
CANSLIM.net Company Profile |
SEC
News |
Chart |
Request a new note
C
A N
S L
I M
|
MRLN
-
NASDAQ
Marlin Business Services
DIVERSIFIED SERVICES - Rental and Leasing Services
|
$22.65
|
-2.20
-8.85% |
$24.49
|
58,662
259.57% of 50 DAV
50 DAV is 22,600
|
$28.64
-20.91%
|
9/9/2013
|
$23.75
|
PP = $24.03
|
|
MB = $25.23
|
Most Recent Note - 12/2/2013 5:02:14 PM
Down considerably today with above average volume while violating prior lows triggering additional technical sell signals. It will be dropped from the Featured Stocks list tonight. Slumped to its 200 DMA line which may likely serve as support, yet it now faces overhead supply up through the $28 area. For its outlook to improve it needs gains above its 50 DMA line.
>>> FEATURED STOCK ARTICLE : Violated 50-Day Moving Average Line Raising Concerns - 11/14/2013
View all notes |
Set NEW NOTE alert |
CANSLIM.net Company Profile |
SEC
News |
Chart |
Request a new note
C
A N
S L
I M
|
Symbol/Exchange
Company Name
Industry Group |
PRICE |
CHANGE
(%Change) |
Day High |
Volume
(% DAV)
(% 50 day avg vol) |
52 Wk Hi
% From Hi |
Featured
Date |
Price
Featured |
Pivot Featured |
|
Max Buy |
NOAH
-
NYSE
Noah Holdings Ltd Ads
FINANCIAL SERVICES - Asset Management
|
$20.78
|
+0.69
3.43% |
$20.86
|
304,766
36.27% of 50 DAV
50 DAV is 840,300
|
$25.51
-18.54%
|
10/15/2013
|
$19.10
|
PP = $18.33
|
|
MB = $19.25
|
Most Recent Note - 11/26/2013 7:25:39 PM
G - Posted a gain today with light volume halting its slide at its 50 DMA line which acted as support throughout its choppy ascent. A violation may trigger a technical sell signal. Caution is called for after a worrisome "negative reversal" occurred at its 52-week high, and it is extended from its latest base.
>>> FEATURED STOCK ARTICLE : 50-Day Average And Prior Highs Define Important Support - 11/20/2013
View all notes |
Set NEW NOTE alert |
CANSLIM.net Company Profile |
SEC
News |
Chart |
Request a new note
C
A N
S L
I M
|
PCLN
-
NASDAQ
Priceline.Com Inc
INTERNET - Internet Software and Services
|
$1,188.50
|
-3.83
-0.32% |
$1,196.59
|
435,491
67.64% of 50 DAV
50 DAV is 643,800
|
$1,198.75
-0.86%
|
9/13/2013
|
$966.82
|
PP = $995.08
|
|
MB = $1,044.83
|
Most Recent Note - 11/27/2013 6:32:45 PM
G - Wedged to yet another new 52-week high with today's 3rd consecutive gain backed by below average volume. Found support at its 50 DMA line on prior pullbacks, however it has not formed any recent sound base pattern. Reported earnings +40% on +33% sales revenues for the Sep '13 quarter versus the year-ago period, improving after a slightly sub par Jun '13 report.
>>> FEATURED STOCK ARTICLE : Rallied to New Highs Following Pullback to 50-day Average - 10/29/2013
View all notes |
Set NEW NOTE alert |
CANSLIM.net Company Profile |
SEC
News |
Chart |
Request a new note
C
A N
S L
I M
|
PRAA
-
NASDAQ
Portfolio Recovery Assoc
DIVERSIFIED SERVICES - Business/Management Services
|
$55.89
|
-2.51
-4.30% |
$58.74
|
592,969
134.74% of 50 DAV
50 DAV is 440,100
|
$63.96
-12.62%
|
10/17/2013
|
$60.75
|
PP = $61.70
|
|
MB = $64.79
|
Most Recent Note - 12/2/2013 6:00:21 PM
Down with above average volume today after its 50 DMA line acted as resistance. A rebound above that short-term average is needed for its outlook to improve. Faces resistance due to overhead supply up through the $63 area and it will be dropped from the Featured Stocks list tonight.
>>> FEATURED STOCK ARTICLE : Near 50-Day Moving Average Enduring Distributional Pressure - 11/5/2013
View all notes |
Set NEW NOTE alert |
CANSLIM.net Company Profile |
SEC
News |
Chart |
Request a new note
C
A N
S L
I M
|
PRLB
-
NYSE
Proto Labs Inc
MANUFACTURING - Small Tools and Accessories
|
$74.29
|
-0.01
-0.01% |
$74.49
|
279,005
58.90% of 50 DAV
50 DAV is 473,700
|
$89.97
-17.43%
|
7/29/2013
|
$64.86
|
PP = $67.50
|
|
MB = $70.88
|
Most Recent Note - 12/2/2013 6:03:10 PM
G - Still failing to attract buying demand after slumping well below its 50 DMA line which is now downward sloping. Its prior low of $68.29 on 10/09/13 defines support above its 200 DMA line.
>>> FEATURED STOCK ARTICLE : Undercut 50-Day Moving Average Yet Found Prompt Support - 11/4/2013
View all notes |
Set NEW NOTE alert |
CANSLIM.net Company Profile |
SEC
News |
Chart |
Request a new note
C
A N
S L
I M
|
SFUN
-
NYSE
Soufun Hldgs Ltd Ads A
INTERNET - Internet Information Providers
|
$71.85
|
+6.90
10.62% |
$72.65
|
1,797,833
121.20% of 50 DAV
50 DAV is 1,483,300
|
$71.62
0.32%
|
10/17/2013
|
$58.02
|
PP = $53.87
|
|
MB = $56.56
|
Most Recent Note - 12/2/2013 12:52:08 PM
G - Poised for a best-ever close and challenging its all-time high with today's considerable gain. It has not formed a sound base pattern. Disciplined investors avoid chasing extended stocks. Prior highs in the $59 area define initial support to watch on pullbacks.
>>> FEATURED STOCK ARTICLE : Perched Near All-Time High After Testing Support - 11/8/2013
View all notes |
Set NEW NOTE alert |
CANSLIM.net Company Profile |
SEC
News |
Chart |
Request a new note
C
A N
S L
I M
|
Symbol/Exchange
Company Name
Industry Group |
PRICE |
CHANGE
(%Change) |
Day High |
Volume
(% DAV)
(% 50 day avg vol) |
52 Wk Hi
% From Hi |
Featured
Date |
Price
Featured |
Pivot Featured |
|
Max Buy |
SSNC
-
NASDAQ
S S & C Technologies
COMPUTER SOFTWARE and SERVICES - Application Software
|
$43.19
|
+0.08
0.19% |
$43.80
|
346,904
104.71% of 50 DAV
50 DAV is 331,300
|
$43.63
-1.01%
|
10/22/2013
|
$39.17
|
PP = $40.04
|
|
MB = $42.04
|
Most Recent Note - 11/27/2013 6:38:18 PM
G - Color code is changed to green after rallying beyond its "max buy" level with gains backed by below average volume. Prior highs near $41 define initial support to watch above its 50 DMA line on pullbacks.
>>> FEATURED STOCK ARTICLE : Volume Totals Cooling Following Recent Volume-Driven Breakout - 11/12/2013
View all notes |
Set NEW NOTE alert |
CANSLIM.net Company Profile |
SEC
News |
Chart |
Request a new note
C
A N
S L
I M
|
SSYS
-
NASDAQ
Stratasys Ltd
COMPUTER HARDWARE - Computer Peripherals
|
$118.84
|
+1.07
0.91% |
$119.83
|
719,558
60.62% of 50 DAV
50 DAV is 1,187,000
|
$134.00
-11.31%
|
10/11/2013
|
$102.94
|
PP = $105.38
|
|
MB = $110.65
|
Most Recent Note - 11/29/2013 2:52:53 PM
G - Consolidating above support at its 50 DMA line and prior highs with volume totals cooling. More damaging losses would raise greater concerns and trigger worrisome technical sell signals. Reported earnings +13% on +153% sales revenues, below the +25% minimum earnings guideline (C criteria) raising fundamental concerns.
>>> FEATURED STOCK ARTICLE : Rallying For New Highs Despite Fundamental Flaw Raising Concern - 11/18/2013
View all notes |
Set NEW NOTE alert |
CANSLIM.net Company Profile |
SEC
News |
Chart |
Request a new note
C
A N
S L
I M
|
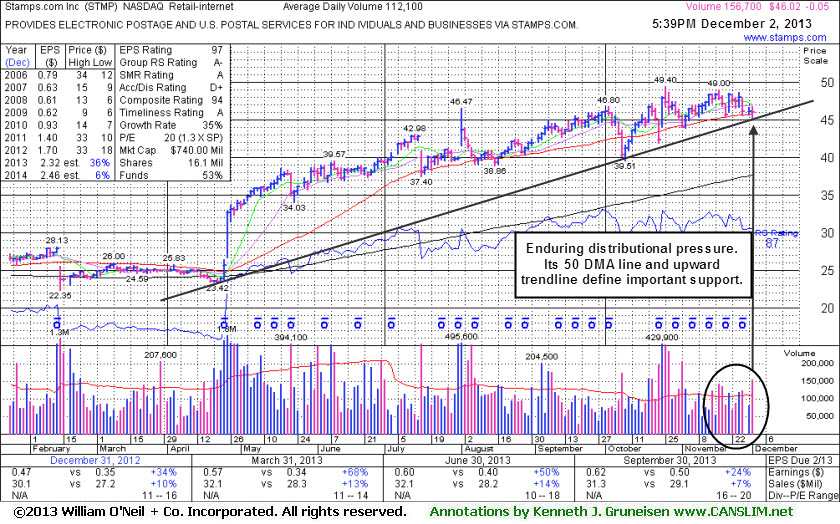
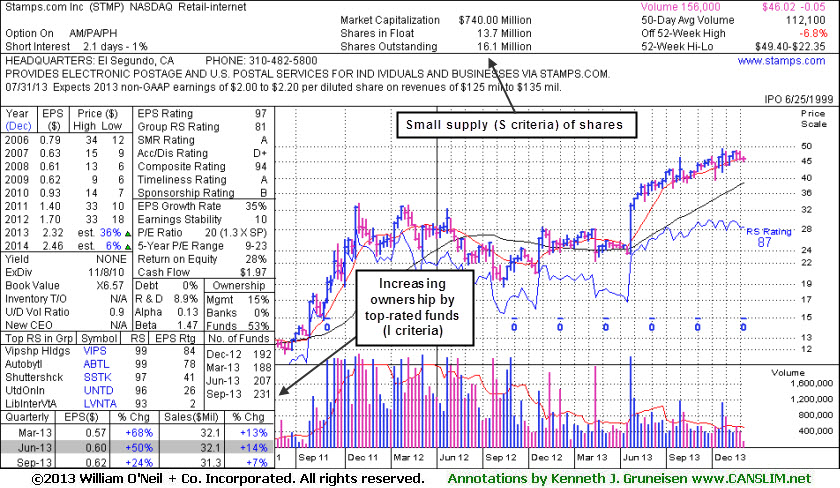
STMP
-
NASDAQ
Stamps.Com Inc
INTERNET - Internet Software and Services
|
$46.02
|
-0.05
-0.11% |
$46.75
|
156,902
139.97% of 50 DAV
50 DAV is 112,100
|
$49.40
-6.84%
|
9/24/2013
|
$45.54
|
PP = $46.57
|
|
MB = $48.90
|
Most Recent Note - 12/2/2013 6:06:40 PM
G - Testing its 50 DMA line and an upward trendline where violations would raise serious concerns. Earnings were +24% on +7% sales revenues for the Sep '13 quarter, just below the +25% minimum earnings guideline (C criteria). See the latest FSU analysis for more details and new annotated daily and weekly graphs.
>>> FEATURED STOCK ARTICLE : Upward Trendline and 50-Day Average Define Important Near-Term Support - 12/2/2013
View all notes |
Set NEW NOTE alert |
CANSLIM.net Company Profile |
SEC
News |
Chart |
Request a new note
C
A N
S L
I M
|
ULTI
-
NASDAQ
Ultimate Software Group
INTERNET - Internet Software and Services
|
$152.97
|
-3.72
-2.37% |
$157.40
|
83,283
56.39% of 50 DAV
50 DAV is 147,700
|
$162.88
-6.08%
|
10/16/2013
|
$142.95
|
PP = $151.18
|
|
MB = $158.74
|
Most Recent Note - 11/27/2013 6:34:35 PM
Y - Volume totals have still been cooling while holding its ground near its 52-week high yet below its "max buy" level. Prior highs and its 50 DMA line define near-term support near the $151 area.
>>> FEATURED STOCK ARTICLE : Consolidating Above 50 DMA Line and Prior Highs Defining Support - 11/21/2013
View all notes |
Set NEW NOTE alert |
CANSLIM.net Company Profile |
SEC
News |
Chart |
Request a new note
C
A N
S L
I M
|
VRX
-
NYSE
Valeant Pharmaceuticals
DRUGS - Drug Manufacturers - Other
|
$109.78
|
+0.15
0.14% |
$110.77
|
836,316
73.12% of 50 DAV
50 DAV is 1,143,700
|
$115.40
-4.87%
|
9/11/2013
|
$100.26
|
PP = $105.50
|
|
MB = $110.78
|
Most Recent Note - 11/27/2013 6:35:20 PM
Y - Still consolidating in a very tight range near its 50 DMA line with volume totals cooling. Recent lows in the $102 area define near-term support where subsequent violations may trigger technical sell signals. Recently reported earnings +24% on +74% sales revenues for the Sep '13 quarter, a notch below the +25% minimum guideline (C criteria).
>>> FEATURED STOCK ARTICLE : Recent Lows Define Support to Watch Below 50 Day Average - 11/15/2013
View all notes |
Set NEW NOTE alert |
CANSLIM.net Company Profile |
SEC
News |
Chart |
Request a new note
C
A N
S L
I M
|
Symbol/Exchange
Company Name
Industry Group |
PRICE |
CHANGE
(%Change) |
Day High |
Volume
(% DAV)
(% 50 day avg vol) |
52 Wk Hi
% From Hi |
Featured
Date |
Price
Featured |
Pivot Featured |
|
Max Buy |
YNDX
-
NASDAQ
Yandex N V Class A
INTERNET - Internet Information Providers
|
$40.07
|
+0.32
0.81% |
$40.42
|
2,441,375
94.99% of 50 DAV
50 DAV is 2,570,200
|
$42.00
-4.60%
|
11/27/2013
|
$39.61
|
PP = $42.10
|
|
MB = $44.21
|
Most Recent Note - 11/27/2013 6:27:05 PM
Y - Color code is changed to yellow with new pivot point cited based on its 10/22/13 high plus 10 cents. Subsequent volume-driven gains above the pivot point may trigger a new (or add-on) technical buy signal. Prior lows ($35.59 on 11/08/13 and $34.31 on 10/08/13) defines the next important chart support levels to watch. See the latest FSU analysis for more details and new annotated daily and weekly graphs.
>>> FEATURED STOCK ARTICLE : Forming New Base Pattern With Little Resistance Remaining - 11/27/2013
View all notes |
Set NEW NOTE alert |
CANSLIM.net Company Profile |
SEC
News |
Chart |
Request a new note
C
A N
S L
I M
|