***Last / Change / Volume data in this table is the closing quote data***
Symbol/Exchange
Company Name
Industry Group |
PRICE |
CHANGE
(%Change) |
Day High |
Volume
(% DAV)
(% 50 day avg vol) |
52 Wk Hi
% From Hi |
Featured
Date |
Price
Featured |
Pivot Featured |
|
Max Buy |
ABV
-
NYSE
Comp De Bebidas Adr
FOOD and BEVERAGE - Beverages - Brewers
|
$139.49
|
+2.52
1.84% |
$139.50
|
437,075
66.19% of 50 DAV
50 DAV is 660,300
|
$145.36
-4.04%
|
11/4/2010
|
$142.35
|
PP = $143.63
|
|
MB = $150.81
|
Most Recent Note - 12/1/2010 5:14:16 PM
G - Posted a gain on light volume today, finding support near its 50 DMA line. Color code was changed to green following recent distributional pressure after stalling.
>>> The latest Featured Stock Update with an annotated graph appeared on 10/11/2010. Click here.
View all notes |
Alert me of new notes |
CANSLIM.net Company Profile |
SEC |
Zacks Reports |
StockTalk |
News |
Chart |
Request a new note
C
A N
S L
I M


|
ARUN
-
NASDAQ
Aruba Networks Inc
COMPUTER HARDWARE - Networking andamp; Communication Dev
|
$23.00
|
+0.09
0.39% |
$23.10
|
2,275,032
87.50% of 50 DAV
50 DAV is 2,599,900
|
$24.28
-5.27%
|
8/30/2010
|
$18.12
|
PP = $18.51
|
|
MB = $19.44
|
Most Recent Note - 12/1/2010 5:14:56 PM
G - Considerable gain today with heavy volume promptly repaired the prior session's 50 DMA line violation, a sign of great institutional support. It made a stand near an upward trendline connecting May - November lows previously noted as support to watch.
>>> The latest Featured Stock Update with an annotated graph appeared on 10/26/2010. Click here.
View all notes |
Alert me of new notes |
CANSLIM.net Company Profile |
SEC |
Zacks Reports |
StockTalk |
News |
Chart |
Request a new note
C
A N
S L
I M
|
BIDU
-
NASDAQ
Baidu Inc Ads
INTERNET - Internet Information Providers
|
$106.37
|
-0.44
-0.41% |
$108.30
|
7,909,683
64.13% of 50 DAV
50 DAV is 12,334,000
|
$115.04
-7.54%
|
9/17/2010
|
$85.73
|
PP = $88.42
|
|
MB = $92.84
|
Most Recent Note - 12/1/2010 5:16:56 PM
G - Posted a small gain today with light volume, and volume totals have been cooling while consolidating near its 50 DMA line. Any damaging violation of its short-term average or recent chart low ($103.11 on 11/16/10) would raise greater concerns and trigger technical sell signals. BIDU has been noted as a riskier "late stage" candidate, yet could produce more climactic gains.
>>> The latest Featured Stock Update with an annotated graph appeared on 11/30/2010. Click here.
View all notes |
Alert me of new notes |
CANSLIM.net Company Profile |
SEC |
Zacks Reports |
StockTalk |
News |
Chart |
Request a new note
C
A N
S L
I M
|
CACC
-
NASDAQ
Credit Acceptance Corp
FINANCIAL SERVICES - Credit Services
|
$62.00
|
+0.11
0.18% |
$62.25
|
15,569
62.28% of 50 DAV
50 DAV is 25,000
|
$63.45
-2.28%
|
11/22/2010
|
$59.97
|
PP = $62.00
|
|
MB = $65.10
|
Most Recent Note - 12/1/2010 5:20:32 PM
Y - Another small loss today with light volume has its slumping slightly under its pivot point, yet the M criteria has now been reconfirmed by a solid follow-through day. Its 11/29/10 gain with +69% above average volume helped it rally above the pivot point of a "double bottom" type base pattern, meeting the guidelines for a new (or add-on) technical buy signal. Additional volume driven gains would be a reassuring sign.
>>> The latest Featured Stock Update with an annotated graph appeared on 10/29/2010. Click here.
View all notes |
Alert me of new notes |
CANSLIM.net Company Profile |
SEC |
Zacks Reports |
StockTalk |
News |
Chart |
Request a new note
C
A N
S L
I M
|
CIS
-
NYSE
Camelot Info Systems Ads
COMPUTER SOFTWARE andamp; SERVICES - Information Technology Service
|
$23.00
|
-1.68
-6.81% |
$24.88
|
622,191
214.40% of 50 DAV
50 DAV is 290,200
|
$24.89
-7.59%
|
11/26/2010
|
$18.93
|
PP = $19.72
|
|
MB = $20.71
|
 Most Recent Note - 12/2/2010 11:15:38 AM
G - Pulling back today, it quickly got extended from a sound base. Prior highs in the $19.50 area define chart support to watch following its recent streak of volume-driven gains.
>>> The latest Featured Stock Update with an annotated graph appeared on 11/26/2010. Click here.
View all notes |
Alert me of new notes |
CANSLIM.net Company Profile |
SEC |
Zacks Reports |
StockTalk |
News |
Chart |
Request a new note
C
A N
S L
I M
|
Symbol/Exchange
Company Name
Industry Group |
PRICE |
CHANGE
(%Change) |
Day High |
Volume
(% DAV)
(% 50 day avg vol) |
52 Wk Hi
% From Hi |
Featured
Date |
Price
Featured |
Pivot Featured |
|
Max Buy |
CMG
-
NYSE
Chipotle Mexican Grill
LEISURE - Restaurants
|
$250.96
|
-7.86
-3.04% |
$258.75
|
1,656,916
184.68% of 50 DAV
50 DAV is 897,200
|
$262.78
-4.50%
|
9/1/2010
|
$158.31
|
PP = $155.52
|
|
MB = $163.30
|
Most Recent Note - 12/2/2010 12:56:37 PM
G - Pulling back today after 8 consecutive gains. Recently inching higher with small gains while churning heavy volume, a sign of distributional pressure while it has been rising. It is extended from any sound base pattern. Its 50 DMA line (now $208) defines the nearest chart support level.
>>> The latest Featured Stock Update with an annotated graph appeared on 10/28/2010. Click here.
View all notes |
Alert me of new notes |
CANSLIM.net Company Profile |
SEC |
Zacks Reports |
StockTalk |
News |
Chart |
Request a new note
C
A N
S L
I M
|
DECK
-
NASDAQ
Deckers Outdoor Corp
CONSUMER NON-DURABLES - Textile - Apparel Footwear
|
$77.80
|
-2.14
-2.68% |
$79.85
|
3,946,379
290.86% of 50 DAV
50 DAV is 1,356,800
|
$80.00
-2.75%
|
10/27/2010
|
$54.16
|
PP = $54.86
|
|
MB = $57.60
|
Most Recent Note - 12/2/2010 1:14:48 PM
G - Holding its ground stubbornly after 10 consecutive gains to new all-time highs. It has been noted as extended from its latest sound base. Prior highs and its 50 DMA line define the nearest chart support.
>>> The latest Featured Stock Update with an annotated graph appeared on 10/27/2010. Click here.
View all notes |
Alert me of new notes |
CANSLIM.net Company Profile |
SEC |
Zacks Reports |
StockTalk |
News |
Chart |
Request a new note
C
A N
S L
I M
|
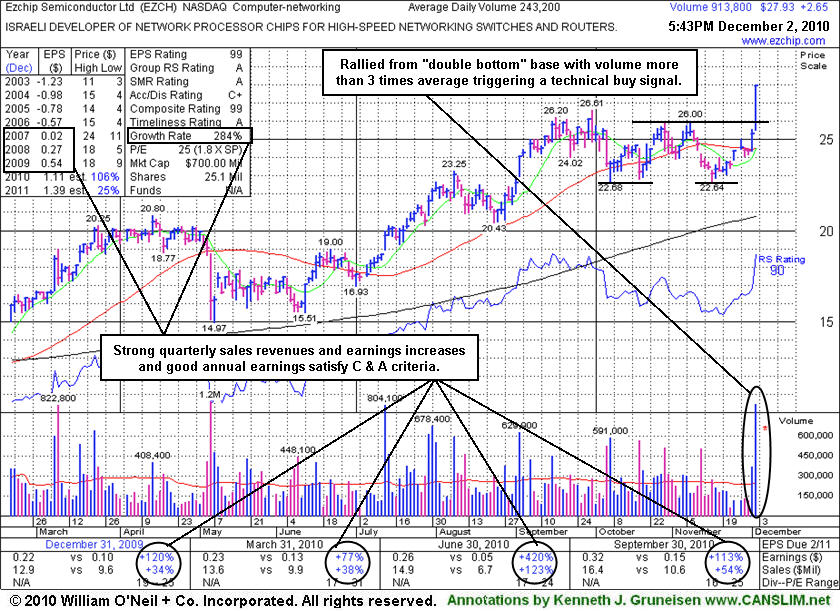
EZCH
-
NASDAQ
Ezchip Semiconductor Ltd
ELECTRONICS - Semiconductor - Specialized
|
$27.93
|
+2.65
10.48% |
$27.95
|
914,562
382.34% of 50 DAV
50 DAV is 239,200
|
$26.61
4.96%
|
12/2/2010
|
$27.53
|
PP = $26.00
|
|
MB = $27.30
|
Most Recent Note - 12/2/2010 1:19:08 PM
Y - Considerable gain with heavy volume today, breaking out of an orderly "double bottom" type base. Color code is changed to yellow with pivot point cited based on its 11/08/10 high. Sales and earnings increases have been strong.
>>> The latest Featured Stock Update with an annotated graph appeared on 12/2/2010. Click here.
View all notes |
Alert me of new notes |
CANSLIM.net Company Profile |
SEC |
Zacks Reports |
StockTalk |
News |
Chart |
Request a new note
C
A N
S L
I M
|
EZPW
-
NASDAQ
Ezcorp Inc Cl A
SPECIALTY RETAIL - Specialty Retail, Other
|
$27.27
|
+1.01
3.85% |
$27.67
|
757,051
251.93% of 50 DAV
50 DAV is 300,500
|
$26.42
3.22%
|
11/5/2010
|
$24.02
|
PP = $23.85
|
|
MB = $25.04
|
Most Recent Note - 12/2/2010 1:20:12 PM
G - Solid gain today for another new all-time high, getting extended from a sound base pattern. Prior highs in the $22-23 area define chart support to watch near its 50 DMA line.
>>> The latest Featured Stock Update with an annotated graph appeared on 11/6/2010. Click here.
View all notes |
Alert me of new notes |
CANSLIM.net Company Profile |
SEC |
Zacks Reports |
StockTalk |
News |
Chart |
Request a new note
C
A N
S L
I M
|
FFIV
-
NASDAQ
F 5 Networks Inc
INTERNET - Internet Software and Services
|
$137.15
|
-1.81
-1.30% |
$139.59
|
2,636,075
92.73% of 50 DAV
50 DAV is 2,842,700
|
$139.88
-1.95%
|
6/16/2010
|
$74.50
|
PP = $74.10
|
|
MB = $77.81
|
Most Recent Note - 12/1/2010 5:30:14 PM
G - Closed near the session high after another volume-driven gain for a new all-time high. Extended from any sound base pattern. Prior highs in the $112 area define initial chart support.
>>> The latest Featured Stock Update with an annotated graph appeared on 11/15/2010. Click here.
View all notes |
Alert me of new notes |
CANSLIM.net Company Profile |
SEC |
Zacks Reports |
StockTalk |
News |
Chart |
Request a new note
C
A N
S L
I M
|
Symbol/Exchange
Company Name
Industry Group |
PRICE |
CHANGE
(%Change) |
Day High |
Volume
(% DAV)
(% 50 day avg vol) |
52 Wk Hi
% From Hi |
Featured
Date |
Price
Featured |
Pivot Featured |
|
Max Buy |
FOSL
-
NASDAQ
Fossil Inc
CONSUMER DURABLES - Recreational Goods, Other
|
$72.78
|
+4.53
6.64% |
$73.01
|
2,011,066
247.27% of 50 DAV
50 DAV is 813,300
|
$70.07
3.87%
|
11/26/2010
|
$69.10
|
PP = $70.17
|
|
MB = $73.68
|
Most Recent Note - 12/2/2010 1:25:28 PM
Y - Hit a new all-time high and rising above its pivot point today with volume running at an above average pace behind its considerable gain. Color code was changed to yellow after an advanced "3-weeks tight" pattern was identified following a considerable rally from its prior base. An upward trendline connecting its July-October lows defines support to watch above its 50 DMA line.
>>> The latest Featured Stock Update with an annotated graph appeared on 11/29/2010. Click here.
View all notes |
Alert me of new notes |
CANSLIM.net Company Profile |
SEC |
Zacks Reports |
StockTalk |
News |
Chart |
Request a new note
C
A N
S L
I M
|
HMSY
-
NASDAQ
H M S Holdings Corp
COMPUTER SOFTWARE and SERVICES - Healthcare Information Service
|
$64.64
|
+0.26
0.40% |
$64.65
|
126,929
61.35% of 50 DAV
50 DAV is 206,900
|
$64.75
-0.17%
|
11/19/2010
|
$61.89
|
PP = $63.01
|
|
MB = $66.16
|
Most Recent Note - 12/1/2010 5:33:30 PM
Y - Volume total was light today as it traded further above its pivot point for another new 52-week high. Volume did not meet the guideline to trigger a proper new (or add-on) technical buy signal. Its 50 DMA line defines important support to watch.
>>> The latest Featured Stock Update with an annotated graph appeared on 11/19/2010. Click here.
View all notes |
Alert me of new notes |
CANSLIM.net Company Profile |
SEC |
Zacks Reports |
StockTalk |
News |
Chart |
Request a new note
C
A N
S L
I M
|
HS
-
NYSE
Healthspring Inc
HEALTH SERVICES - Health Care Plans
|
$28.23
|
+0.39
1.40% |
$28.29
|
461,563
70.18% of 50 DAV
50 DAV is 657,700
|
$29.80
-5.27%
|
8/27/2010
|
$19.91
|
PP = $19.75
|
|
MB = $20.74
|
Most Recent Note - 12/1/2010 5:35:55 PM
G - Gain today with below average volume helped it promptly repair a 50 DMA line violation. It tested that important short-term average for the first time since August, meanwhile any more damaging losses would raise concerns and trigger a technical sell signal.
>>> The latest Featured Stock Update with an annotated graph appeared on 10/22/2010. Click here.
View all notes |
Alert me of new notes |
CANSLIM.net Company Profile |
SEC |
Zacks Reports |
StockTalk |
News |
Chart |
Request a new note
C
A N
S L
I M
|
JOBS
-
NASDAQ
Fifty One Job Inc Ads
DIVERSIFIED SERVICES - Staffing and; Outsourcing Service
|
$52.17
|
-0.83
-1.57% |
$52.99
|
161,066
82.18% of 50 DAV
50 DAV is 196,000
|
$53.70
-2.85%
|
10/13/2010
|
$42.07
|
PP = $40.60
|
|
MB = $42.63
|
Most Recent Note - 12/1/2010 5:42:14 PM
G - Gapped up today for a new 52-week high. It is extended from a sound base, and its 50 DMA line defines important support to watch.
>>> The latest Featured Stock Update with an annotated graph appeared on 11/16/2010. Click here.
View all notes |
Alert me of new notes |
CANSLIM.net Company Profile |
SEC |
Zacks Reports |
StockTalk |
News |
Chart |
Request a new note
C
A N
S L
I M
|
LFT
-
NYSE
Longtop Financl Tech Ads
COMPUTER SOFTWARE and SERVICES - Business Software and Services
|
$39.49
|
-0.10
-0.25% |
$39.74
|
480,045
92.67% of 50 DAV
50 DAV is 518,000
|
$42.86
-7.86%
|
11/5/2010
|
$41.83
|
PP = $40.96
|
|
MB = $43.01
|
Most Recent Note - 12/1/2010 5:45:25 PM
Y - Perched -7.6% off its all-time high, it closed near today's session low while higher volume without meaningful price progress was indicative of more worrisome distributional pressure. Its latest slump below its pivot point raised concerns while it is still consolidating above support near its 50 DMA line.
>>> The latest Featured Stock Update with an annotated graph appeared on 10/14/2010. Click here.
View all notes |
Alert me of new notes |
CANSLIM.net Company Profile |
SEC |
Zacks Reports |
StockTalk |
News |
Chart |
Request a new note
C
A N
S L
I M
|
Symbol/Exchange
Company Name
Industry Group |
PRICE |
CHANGE
(%Change) |
Day High |
Volume
(% DAV)
(% 50 day avg vol) |
52 Wk Hi
% From Hi |
Featured
Date |
Price
Featured |
Pivot Featured |
|
Max Buy |
LULU
-
NASDAQ
Lululemon Athletica
MANUFACTURING - Textile Manufacturing
|
$53.37
|
-0.83
-1.53% |
$54.84
|
1,096,607
102.95% of 50 DAV
50 DAV is 1,065,200
|
$54.86
-2.72%
|
10/8/2010
|
$47.66
|
PP = $46.67
|
|
MB = $49.00
|
Most Recent Note - 12/1/2010 5:47:36 PM
G - Volume total was below average today as it touched a new 52-week high after a tight consolidation following volume-driven gains. Prior highs in the $46-48 area define chart support to watch along with its 50 DMA line.
>>> The latest Featured Stock Update with an annotated graph appeared on 12/1/2010. Click here.
View all notes |
Alert me of new notes |
CANSLIM.net Company Profile |
SEC |
Zacks Reports |
StockTalk |
News |
Chart |
Request a new note
C
A N
S L
I M
|
MWIV
-
NASDAQ
M W I Veterinary Supply
HEALTH SERVICES - Medical Instruments and; Supplies
|
$61.97
|
-0.27
-0.43% |
$62.14
|
17,869
32.02% of 50 DAV
50 DAV is 55,800
|
$63.94
-3.08%
|
11/4/2010
|
$61.79
|
PP = $59.60
|
|
MB = $62.58
|
Most Recent Note - 12/1/2010 5:49:05 PM
Y - Gap up gain today on below average volume for its best ever close. Its 50 DMA line has been repeatedly noted as a very important support level. It stalled after hitting its all-time high on 11/04/10, yet held its ground stubbornly above its short-term average.
>>> The latest Featured Stock Update with an annotated graph appeared on 11/2/2010. Click here.
View all notes |
Alert me of new notes |
CANSLIM.net Company Profile |
SEC |
Zacks Reports |
StockTalk |
News |
Chart |
Request a new note
C
A N
S L
I M
|
NEOG
-
NASDAQ
Neogen Corp
DRUGS - Diagnostic Substances
|
$38.30
|
-0.11
-0.29% |
$38.97
|
69,417
87.10% of 50 DAV
50 DAV is 79,700
|
$38.88
-1.49%
|
9/1/2010
|
$30.79
|
PP = $30.49
|
|
MB = $32.01
|
Most Recent Note - 12/1/2010 5:50:51 PM
G - Gapped up for a gain today with above average volume to a new all-time high. It is extended from any sound base, and its 50 DMA line recently has been a reliable support level.
>>> The latest Featured Stock Update with an annotated graph appeared on 10/13/2010. Click here.
View all notes |
Alert me of new notes |
CANSLIM.net Company Profile |
SEC |
Zacks Reports |
StockTalk |
News |
Chart |
Request a new note
C
A N
S L
I M
|
NFLX
-
NASDAQ
Netflix Inc
SPECIALTY RETAIL - Music and Video Stores
|
$193.42
|
-6.72
-3.36% |
$196.45
|
8,541,327
144.23% of 50 DAV
50 DAV is 5,922,100
|
$209.24
-7.56%
|
11/9/2010
|
$173.10
|
PP = $184.84
|
|
MB = $194.08
|
Most Recent Note - 12/2/2010 11:23:18 AM
G - Extended from its latest base, it gapped down today after a negative reversal from a new all-time high on the prior session. Prior highs near $184 define initial chart support to watch above its 50 DMA line.
>>> The latest Featured Stock Update with an annotated graph appeared on 11/24/2010. Click here.
View all notes |
Alert me of new notes |
CANSLIM.net Company Profile |
SEC |
Zacks Reports |
StockTalk |
News |
Chart |
Request a new note
C
A N
S L
I M
|
NTAP
-
NASDAQ
Netapp Inc
COMPUTER HARDWARE - Data Storage Devices
|
$53.84
|
+1.65
3.16% |
$53.99
|
7,408,387
102.44% of 50 DAV
50 DAV is 7,231,900
|
$57.96
-7.11%
|
9/8/2010
|
$46.98
|
PP = $44.99
|
|
MB = $47.24
|
Most Recent Note - 12/2/2010 4:20:28 PM
G - Rallying further above its 50 DMA line with a third consecutive gain on near average volume. It is not near a sound base pattern, but the gain above its short-term average improves its technical stance.
>>> The latest Featured Stock Update with an annotated graph appeared on 11/3/2010. Click here.
View all notes |
Alert me of new notes |
CANSLIM.net Company Profile |
SEC |
Zacks Reports |
StockTalk |
News |
Chart |
Request a new note
C
A N
S L
I M
|
Symbol/Exchange
Company Name
Industry Group |
PRICE |
CHANGE
(%Change) |
Day High |
Volume
(% DAV)
(% 50 day avg vol) |
52 Wk Hi
% From Hi |
Featured
Date |
Price
Featured |
Pivot Featured |
|
Max Buy |
ORCL
-
NASDAQ
Oracle Corp
COMPUTER SOFTWARE and SERVICES - Application Software
|
$28.10
|
+0.45
1.63% |
$28.18
|
32,115,140
91.87% of 50 DAV
50 DAV is 34,958,800
|
$29.82
-5.77%
|
9/20/2010
|
$27.32
|
PP = $26.73
|
|
MB = $28.07
|
Most Recent Note - 12/2/2010 4:22:08 PM
G - Gain on lighter volume today, rising near its 50 DMA line. A rally above its short-term average is needed for its outlook to improve, technically.
>>> The latest Featured Stock Update with an annotated graph appeared on 11/18/2010. Click here.
View all notes |
Alert me of new notes |
CANSLIM.net Company Profile |
SEC |
Zacks Reports |
StockTalk |
News |
Chart |
Request a new note
C
A N
S L
I M
|
PAY
-
NYSE
Verifone Systems Inc
COMPUTER HARDWARE - Transaction Automation Systems
|
$36.76
|
+0.86
2.40% |
$37.08
|
2,865,283
216.49% of 50 DAV
50 DAV is 1,323,500
|
$35.94
2.28%
|
11/29/2010
|
$33.96
|
PP = $36.04
|
|
MB = $37.84
|
Most Recent Note - 12/2/2010 4:24:45 PM
Y - Hit a new 52-week high today and rallied above the new pivot point cited. Its considerable gain on more than than 2 times average volume triggered a technical buy signal while rising from a previously noted advanced "ascending base" pattern.
>>> The latest Featured Stock Update with an annotated graph appeared on 10/25/2010. Click here.
View all notes |
Alert me of new notes |
CANSLIM.net Company Profile |
SEC |
Zacks Reports |
StockTalk |
News |
Chart |
Request a new note
C
A N
S L
I M
|
RAX
-
NYSE
Rackspace Hosting Inc
INTERNET - Internet Software and; Services
|
$29.61
|
-0.39
-1.30% |
$30.10
|
1,221,870
47.04% of 50 DAV
50 DAV is 2,597,700
|
$30.49
-2.89%
|
9/21/2010
|
$22.84
|
PP = $23.61
|
|
MB = $24.79
|
Most Recent Note - 12/1/2010 6:00:31 PM
G - Hit another new all-time high today. Volume totals have been below average in recent weeks. No resistance remains due to overhead supply, but it is extended from any sound base.
>>> The latest Featured Stock Update with an annotated graph appeared on 11/17/2010. Click here.
View all notes |
Alert me of new notes |
CANSLIM.net Company Profile |
SEC |
Zacks Reports |
StockTalk |
News |
Chart |
Request a new note
C
A N
S L
I M
|
ROVI
-
NASDAQ
Rovi Corp
COMPUTER SOFTWARE andamp; SERVICES - Security Software andamp; Services
|
$54.47
|
-0.48
-0.87% |
$55.07
|
757,863
54.58% of 50 DAV
50 DAV is 1,388,500
|
$56.10
-2.91%
|
10/29/2010
|
$49.99
|
PP = $53.10
|
|
MB = $55.76
|
Most Recent Note - 12/1/2010 6:03:17 PM
Y - Reversed for a small loss on average volume after a small gap up helped it touch another new 52-week high today. It has recently wedged higher without great volume conviction. Confirming gains on heavy volume could trigger new (or add-on) technical buy signals. Meanwhile, its 50 DMA line defines important support to watch.
>>> The latest Featured Stock Update with an annotated graph appeared on 10/20/2010. Click here.
View all notes |
Alert me of new notes |
CANSLIM.net Company Profile |
SEC |
Zacks Reports |
StockTalk |
News |
Chart |
Request a new note
C
A N
S L
I M
|
SHOO
-
NASDAQ
Steven Madden Limited
CONSUMER NON-DURABLES - Textile - Apparel Footwear
|
$45.81
|
-0.52
-1.12% |
$46.52
|
278,927
78.17% of 50 DAV
50 DAV is 356,800
|
$46.76
-2.03%
|
11/23/2010
|
$44.61
|
PP = $44.95
|
|
MB = $47.20
|
Most Recent Note - 12/1/2010 6:04:42 PM
Y - Touched another new 2010 high today with a gain on near average volume. Its 11/29/10 gain above the new pivot point cited with twice average volume met the guidelines for a new (or add-on) technical buy signal. No resistance remains due to overhead supply
>>> The latest Featured Stock Update with an annotated graph appeared on 11/23/2010. Click here.
View all notes |
Alert me of new notes |
CANSLIM.net Company Profile |
SEC |
Zacks Reports |
StockTalk |
News |
Chart |
Request a new note
C
A N
S L
I M
|
Symbol/Exchange
Company Name
Industry Group |
PRICE |
CHANGE
(%Change) |
Day High |
Volume
(% DAV)
(% 50 day avg vol) |
52 Wk Hi
% From Hi |
Featured
Date |
Price
Featured |
Pivot Featured |
|
Max Buy |
SLW
-
NYSE
Silver Wheaton Corp
METALS and; MINING - Silver
|
$38.29
|
+0.39
1.03% |
$38.57
|
9,833,613
102.60% of 50 DAV
50 DAV is 9,584,600
|
$38.20
0.24%
|
8/25/2010
|
$21.40
|
PP = $21.99
|
|
MB = $23.09
|
Most Recent Note - 12/1/2010 6:05:24 PM
G - Up today for 3rd consecutive gain and another new all-time high. It is extended from any sound base, and the recent low ($30.52 on 11/16/10) defines initial support above its 50 DMA line.
>>> The latest Featured Stock Update with an annotated graph appeared on 10/18/2010. Click here.
View all notes |
Alert me of new notes |
CANSLIM.net Company Profile |
SEC |
Zacks Reports |
StockTalk |
News |
Chart |
Request a new note
C
A N
S L
I M
|
UA
-
NYSE
Under Armour Inc Cl A
CONSUMER NON-DURABLES - Textile - Apparel Clothing
|
$58.09
|
+0.19
0.33% |
$58.59
|
477,759
66.19% of 50 DAV
50 DAV is 721,800
|
$59.08
-1.68%
|
9/9/2010
|
$39.99
|
PP = $40.10
|
|
MB = $42.11
|
Most Recent Note - 12/1/2010 6:06:04 PM
G - Hit yet another new 52-week high today, but closed near the session low. The high-ranked Apparel - Clothing firm is very extended from any sound base and well above support at its 50 DMA line.
>>> The latest Featured Stock Update with an annotated graph appeared on 11/4/2010. Click here.
View all notes |
Alert me of new notes |
CANSLIM.net Company Profile |
SEC |
Zacks Reports |
StockTalk |
News |
Chart |
Request a new note
C
A N
S L
I M
|
ULTA
-
NASDAQ
Ulta Salon Cosm & Frag
SPECIALTY RETAIL - Specialty Retail, Other
|
$35.72
|
-0.75
-2.06% |
$37.24
|
1,628,175
356.90% of 50 DAV
50 DAV is 456,200
|
$36.71
-2.70%
|
9/3/2010
|
$26.36
|
PP = $25.89
|
|
MB = $27.18
|
Most Recent Note - 12/2/2010 1:59:53 PM
G - Today's gain with even heavier volume helped it hit yet another new all-time high. It is extended from any recent base, meanwhile, its 50 DMA line defines initial support to watch.
>>> The latest Featured Stock Update with an annotated graph appeared on 11/1/2010. Click here.
View all notes |
Alert me of new notes |
CANSLIM.net Company Profile |
SEC |
Zacks Reports |
StockTalk |
News |
Chart |
Request a new note
C
A N
S L
I M
|
VIT
-
NYSE
Vanceinfo Tech Inc Ads
COMPUTER SOFTWARE and SERVICES - Business Software and Services
|
$40.33
|
+1.11
2.83% |
$40.64
|
691,059
109.34% of 50 DAV
50 DAV is 632,000
|
$39.44
2.26%
|
7/8/2010
|
$25.20
|
PP = $26.58
|
|
MB = $27.91
|
Most Recent Note - 12/2/2010 4:25:51 PM
G - Posted a 3rd consecutive gain today on near average volume for a new all-time high. Completed a Public Offering on 11/23/10. It 50 DMA line has acted as support recently, but it has not formed a sound base.
>>> The latest Featured Stock Update with an annotated graph appeared on 10/21/2010. Click here.
View all notes |
Alert me of new notes |
CANSLIM.net Company Profile |
SEC |
Zacks Reports |
StockTalk |
News |
Chart |
Request a new note
C
A N
S L
I M
|