You are not logged in.
This means you
CAN ONLY VIEW reports that were published prior to Wednesday, March 26, 2025.
You
MUST UPGRADE YOUR MEMBERSHIP if you want to see any current reports.
AFTER MARKET UPDATE - WEDNESDAY, DECEMBER 2ND, 2009
Previous After Market Report Next After Market Report >>>
|
|
|
|
DOW |
-18.90 |
10,452.68 |
-0.18% |
|
Volume |
1,031,923,910 |
-9% |
|
Volume |
2,098,257,110 |
-7% |
|
NASDAQ |
+9.22 |
2,185.03 |
+0.42% |
|
Advancers |
1,974 |
63% |
|
Advancers |
1,689 |
59% |
|
S&P 500 |
+0.38 |
1,109.24 |
+0.03% |
|
Decliners |
1,029 |
33% |
|
Decliners |
1,062 |
37% |
|
Russell 2000 |
+6.89 |
596.09 |
+1.17% |
|
52 Wk Highs |
223 |
|
|
52 Wk Highs |
106 |
|
|
S&P 600 |
+3.48 |
314.65 |
+1.12% |
|
52 Wk Lows |
4 |
|
|
52 Wk Lows |
17 |
|
|
 |
Better Leadership But Little Conviction Shown By Major Averages
Adam Sarhan, Contributing Writer,
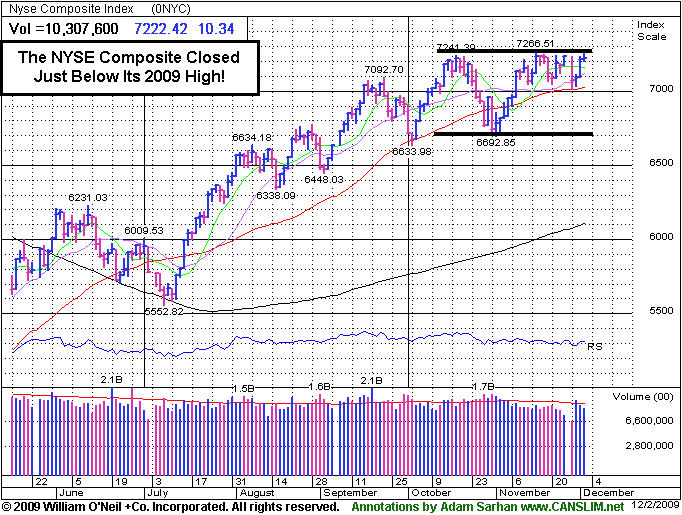
The major averages showed little conviction and ended mixed but in the lower half of their intra-day range as investors digested the latest round of economic data. Volume, an important indicator of institutional sponsorship, was lighter than Tuesday's levels on both major exchanges which helped offset the weak close. Advancers led decliners by almost a 2-to-1 ratio on the NYSE and by a 3-to-2 ratio on the Nasdaq exchange. There were 46 high-ranked companies from the CANSLIM.net Leaders List that made a new 52-week high and appeared on the CANSLIM.net BreakOuts Page, one more than the total of 45 issues that appeared on the prior session. Leadership among high-ranked growth stocks had dried up in recent weeks, so the expansion in new highs this week has been a welcome improvement. New 52-week highs solidly outnumbered new 52-week lows on the NYSE and on the Nasdaq exchange.
Before Wednesday's opening bell, futures fell when ADP Employer Services, the country's largest private payrolls company, said US employers slashed -169,000 jobs last month which topped the 150,000 expected by Wall Street. Investors use the ADP private report as a proxy for the government's official jobs report which is slated to be released on Friday. Analysts expect the government will show that -100,000 jobs were lost last month while the unemployment rate holds steady at 10.2%
The benchmark S&P 500 Index has traded up +64% since its March low. As a result valuations jumped to about 22 times its companies reported earnings which is the highest level since 2002. While on the topic of earnings, the latest estimates call for 2009 earnings to fall -11% before jumping +22% in 2010. Of course, these are only estimates and they will change as we make our way through the holiday shopping season.
PICTURED: The NYSE Composite Index closed in the lower half of its range as it remains perched just below its 2009 high.
|
|
|
 |
Gold & Silver Index Continues Rallying
Kenneth J. Gruneisen - Passed the CAN SLIM® Master's Exam
The Retail Index ($RLX +0.72%) and most tech areas traded with a positive bias on Wednesday. The Semiconductor Index ($SOX +1.61%) and Biotechnology Index ($BTK +1.19%) were among the standout group gainers as the Networking Index ($NWX +0.36%) and Internet Index ($IIX +0.30%) posted smaller gains. The financial group showed little conviction as the Broker/Dealer Index ($XBD -0.25%) edged lower and the Bank Index ($BKX +0.36%) edged higher - both influential indexes still sputtering below their respective 50-day moving average (DMA) lines. Energy-related shares lagged most other groups as the Oil Services Index ($OSX -0.99%) and Integrated Oil Index ($XOI -0.51%) finished the day with small losses.
Charts courtesy www.stockcharts.com
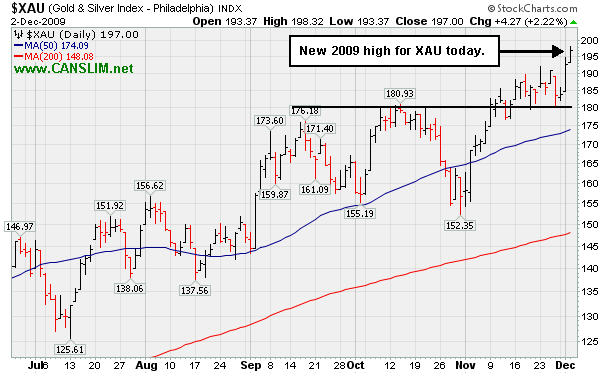
PICTURED: The Gold & Silver Index ($XAU +2.22%) continued rallying to new 2009 highs.
| Oil Services |
$OSX |
191.71 |
-1.92 |
-0.99% |
+57.93% |
| Healthcare |
$HMO |
1,376.09 |
+0.22 |
+0.02% |
+43.32% |
| Integrated Oil |
$XOI |
1,083.75 |
-5.52 |
-0.51% |
+10.62% |
| Semiconductor |
$SOX |
324.69 |
+5.15 |
+1.61% |
+53.03% |
| Networking |
$NWX |
224.81 |
+0.81 |
+0.36% |
+56.24% |
| Internet |
$IIX |
227.46 |
+0.69 |
+0.30% |
+70.04% |
| Broker/Dealer |
$XBD |
114.73 |
-0.29 |
-0.25% |
+48.10% |
| Retail |
$RLX |
412.41 |
+2.96 |
+0.72% |
+47.68% |
| Gold & Silver |
$XAU |
197.00 |
+4.27 |
+2.22% |
+59.06% |
| Bank |
$BKX |
44.64 |
+0.16 |
+0.36% |
+0.72% |
| Biotech |
$BTK |
910.53 |
+10.75 |
+1.19% |
+40.69% |
|
|
|
 |
Big +20% Gains In First 2-3 Weeks After Breakout
Kenneth J. Gruneisen - Passed the CAN SLIM® Master's Exam
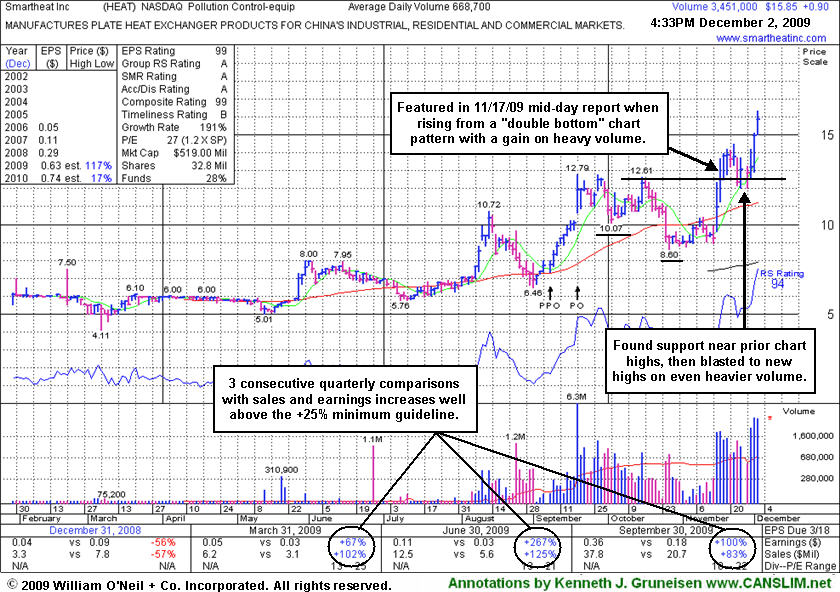
Smartheat Inc (HEAT +$0.92 or +6.15% to $15.87) posted a 3rd consecutive gain today on very heavy volume leaving it well beyond its "may buy" level at all-time highs. It found support near its pivot point during its recent consolidation, giving investors an opportunity to accumulate shares without chasing it and buying it "extended" from its latest base. Healthy stocks commonly retrace and test support before continuing higher, but they rarely fall under their pivot point by more than 7%. If ever a stock falls moire than 7% from your buy price, the investment system's rules say you should always limit the damage and sell the stock.
Since it rose more than 20% in the first 2-3 weeks there is another investment system rule which could now apply to investors who may have made recent buys within proper guidelines. The rule is designed to help investors capture exceptional gains from the market's biggest winners, and it says to hold a stock for a minimum of 8 weeks if it rises more than 20% from your buy price in the first 2-3 weeks.
The 11/17/09 Featured Stock Update write-up with an annotated graph under the headline "Close Near Pivot Point Equaled Best Ever" suggested that, "Pyramiding into the stock might allow careful investors to accumulate shares methodically without paying more than the $13.24 "max buy" price, which is 5% above its $12.61 pivot point." HEAT was first featured in yellow in the 11/17/09 mid-day report (read here) when technically rising from a "double bottom" base, reaching a new all-time high.
Note that on 9/18/09 it completed an additional share offering. There is limited history for this small Chinese firm in the Pollution Control - Equipment group, however its reported annual earnings (A criteria) history has been strong. The 3 latest quarters show sales revenues and earnings increases well above the +25% guideline, satisfying the C criteria.
|
|
|
Color Codes Explained :
Y - Better candidates highlighted by our
staff of experts.
G - Previously featured
in past reports as yellow but may no longer be buyable under the
guidelines.
***Last / Change / Volume quote data in this table corresponds with the timestamp on the note***
Symbol/Exchange
Company Name
Industry Group |
Last |
Chg. |
Vol
% DAV |
Date Featured |
Price Featured |
Latest Pivot Point
Featured |
Status |
| Latest Max Buy Price |
ARST
-
|
$24.49
|
+1.08
|
690,035
121% DAV
568,300
|
9/1/2009
(Date
Featured) |
$19.91
(Price
Featured) |
PP = $20.90 |
G |
| MB = $21.95 |
Most Recent Note - 12/2/2009 5:20:25 PM
G - Gapped up today and rallied for a gain on near average volume to close back above its 50 DMA line, helping its outlook improve after recently noted technical sell signals. ARST was first featured in yellow at $19.91 in the 9/01/09 mid-day report with an annotated daily graph (read here).
>>> The latest Featured Stock Update with an annotated graph appeared on 11/19/2009. click here.
|
|
C
A
S
I |
News |
Chart |
SEC
View all notes Alert
me of new notes
Company
Profile
|
ASIA
-
|
$27.55
|
+1.61
|
1,523,583
145% DAV
1,049,000
|
10/14/2009
(Date
Featured) |
$23.05
(Price
Featured) |
PP = $22.19 |
G |
| MB = $23.30 |
Most Recent Note - 12/2/2009 5:23:13 PM
G - Considerable gain today on higher volume for a new 52-week high following a brief consolidation. Featured 10/14/09 in the mid-day report (read here) as it gapped up for a new 52-week high with 5 times average volume, triggering a technical buy signal by blasting above its pivot point. First featured in the August 2009 CANSLIM.net News (read here).
>>> The latest Featured Stock Update with an annotated graph appeared on 11/24/2009. click here.
|
|
C
A
S
I |
News |
Chart |
SEC
View all notes Alert
me of new notes
Company
Profile
|
BIDU
- NASDAQ
Baidu Inc Ads
INTERNET - Internet Information Providers
|
$434.72
|
-0.83
|
1,321,206
61% DAV
2,153,900
|
9/8/2009
(Date
Featured) |
$351.80
(Price
Featured) |
PP = $368.59 |
G |
| MB = $387.02 |
Most Recent Note - 12/2/2009 5:24:37 PM
G - Consolidating in a very tight trading range for the past 4 weeks, still perched near all-time highs. Proved resilient near its 50 DMA line after its 10/27/09 gap down. As recently noted, "Choppy action has not allowed it to form a sound base in recent weeks." BIDU traded up as much as +23% from its price when featured in yellow in the 9/08/09 Mid-Day BreakOuts Report (read here).
>>> The latest Featured Stock Update with an annotated graph appeared on 11/25/2009. click here.
|
|
C
A
S
I |
News |
Chart |
SEC
View all notes Alert
me of new notes
Company
Profile
|
CAAS
- NASDAQ
China Automotive Systems
AUTOMOTIVE - Auto Parts
|
$20.92
|
+0.41
|
1,394,584
314% DAV
444,700
|
11/30/2009
(Date
Featured) |
$18.84
(Price
Featured) |
PP = $17.62 |
G |
| MB = $18.50 |
Most Recent Note - 12/2/2009 5:25:49 PM
G - Today was its 3rd consecutive gain on heavy volume. Perched at all-time highs now, it is too extended from a proper buy point under the investment system rules. The Chinese maker of power steering systems was rising from an advanced "3-weeks tight" type of chart pattern as it showed up in yellow in the 11/30/09 mid-day report (read here). Recent quarters show accelerating sales revenues and earnings increases, and it has a good annual earnings history.
>>> The latest Featured Stock Update with an annotated graph appeared on 11/30/2009. click here.
|
|
C
A
S
I |
News |
Chart |
SEC
View all notes Alert
me of new notes
Company
Profile
|
CACC
- NASDAQ
Credit Acceptance Corp
FINANCIAL SERVICES - Credit Services
|
$34.85
|
+0.32
|
18,554
50% DAV
37,200
|
9/29/2009
(Date
Featured) |
$33.48
(Price
Featured) |
PP = $37.10 |
Y |
| MB = $38.96 |
Most Recent Note - 12/2/2009 5:26:49 PM
Y - Small gain today on light volume after promptly repairing its prior 50 DMA line violation. Color code was changed to yellow with new pivot point and max buy levels noted. After a 6-week flat base it is continuing its consolidation above prior chart highs in the $32 area. The Finance - Consumer/Commercial Loans firm has maintained a great track record of annual and quarterly sales revenues and earnings increases. It was featured on 9/29/09 in yellow in the mid-day report (read here).
>>> The latest Featured Stock Update with an annotated graph appeared on 11/27/2009. click here.
|
|
C
A
S
I |
News |
Chart |
SEC
View all notes Alert
me of new notes
Company
Profile
|
CRM
- NYSE
Salesforce.com Inc
INTERNET - Internet Software & Services
|
$64.72
|
+0.40
|
884,274
53% DAV
1,667,000
|
8/16/2009
(Date
Featured) |
$47.12
(Price
Featured) |
PP = $45.59 |
G |
| MB = $47.87 |
Most Recent Note - 12/2/2009 5:27:58 PM
G - Gain today on lighter volume, consolidating above important support at its 50 DMA line. It has not formed any recent base, and distributional pressure has raised concerns.
>>> The latest Featured Stock Update with an annotated graph appeared on 11/23/2009. click here.
|
|
C
A
S
I |
News |
Chart |
SEC
View all notes Alert
me of new notes
Company
Profile
|
CTRP
- NASDAQ
Ctrip.com Intl Ltd Adr
LEISURE - Resorts & Casinos
|
$77.21
|
+1.66
|
1,428,145
134% DAV
1,064,900
|
12/1/2009
(Date
Featured) |
$75.38
(Price
Featured) |
PP = $73.91 |
Y |
| MB = $77.61 |
Most Recent Note - 12/2/2009 5:29:41 PM
Y - Gain today with above average volume while approaching its "max buy" level. Featured on 12/01/09 in yellow in the mid-day report (read here) as it hit a new all-time high. It triggered a technical buy signal as it rose with more than +50% above average volume from a brief consolidation resembling a "high-tight-flag" pattern which it formed after repairing a late-October breach of its 50 DMA line. Fundamentally, its sales revenues and earnings increases have shown acceleration in the 3 most recent quarterly comparisons and rose above the +25% guideline. Based on weak technical action it was dropped from the Featured Stocks list on 6/10/08, when it closed at $49.84, yet it has rebounded very impressively from subsequent lows in the $16 area.
>>> The latest Featured Stock Update with an annotated graph appeared on 12/1/2009. click here.
|
|
C
A
S
I |
News |
Chart |
SEC
View all notes Alert
me of new notes
Company
Profile
|
HEAT
-
|
$15.87
|
+0.92
|
3,456,848
517% DAV
668,700
|
11/17/2009
(Date
Featured) |
$12.00
(Price
Featured) |
PP = $12.61 |
G |
| MB = $13.24 |
Most Recent Note - 12/2/2009 5:35:29 PM
G - Today was a 3rd consecutive high-volume gain, leaving it well beyond its "may buy" level at all-time highs, having risen more than +20% in the first 2-3 weeks following its technical breakout. It found support near its pivot point during its recent consolidation, giving investors an opportunity to accumulate shares without chasing it and buying it "extended" from its latest base. First featured in yellow in the 11/17/09 mid-day report (read here) when technically rising from a "double bottom" base, reaching a new all-time high.
>>> The latest Featured Stock Update with an annotated graph appeared on 12/2/2009. click here.
|
|
C
A
S
I |
News |
Chart |
SEC
View all notes Alert
me of new notes
Company
Profile
|
LFT
-
|
$37.51
|
+0.74
|
347,854
72% DAV
482,400
|
11/17/2009
(Date
Featured) |
$31.77
(Price
Featured) |
PP = $33.04 |
G |
| MB = $34.69 |
Most Recent Note - 12/2/2009 5:36:07 PM
G - Gain today on lighter volume for another new all-time high, getting extended after recently rising from a choppy 14-week base. Prior chart highs in the $31 area are an initial support level to watch. A proposed offering of additional shares on 11/16/09 seems well received by the market. Its fundamentals remain strong.
>>> The latest Featured Stock Update with an annotated graph appeared on 11/18/2009. click here.
|
|
C
A
S
I |
News |
Chart |
SEC
View all notes Alert
me of new notes
Company
Profile
|
|
|
|
THESE ARE NOT BUY RECOMMENDATIONS!
Comments contained in the body of this report are technical
opinions only. The material herein has been obtained
from sources believed to be reliable and accurate, however,
its accuracy and completeness cannot be guaranteed.
This site is not an investment advisor, hence it does
not endorse or recommend any securities or other investments.
Any recommendation contained in this report may not
be suitable for all investors and it is not to be deemed
an offer or solicitation on our part with respect to
the purchase or sale of any securities. All trademarks,
service marks and trade names appearing in this report
are the property of their respective owners, and are
likewise used for identification purposes only.
This report is a service available
only to active Paid Premium Members.
You may opt-out of receiving report notifications
at any time. Questions or comments may be submitted
by writing to Premium Membership Services 665 S.E. 10 Street, Suite 201 Deerfield Beach, FL 33441-5634 or by calling 1-800-965-8307
or 954-785-1121.
|
|
|


