You are not logged in.
This means you
CAN ONLY VIEW reports that were published prior to Monday, April 14, 2025.
You
MUST UPGRADE YOUR MEMBERSHIP if you want to see any current reports.
AFTER MARKET UPDATE - TUESDAY, DECEMBER 1ST, 2009
Previous After Market Report Next After Market Report >>>
|
|
|
|
DOW |
+126.74 |
10,471.58 |
+1.23% |
|
Volume |
1,131,906,780 |
-16% |
|
Volume |
2,255,899,580 |
+3% |
|
NASDAQ |
+31.21 |
2,175.81 |
+1.46% |
|
Advancers |
2,431 |
78% |
|
Advancers |
1,903 |
66% |
|
S&P 500 |
+13.23 |
1,108.86 |
+1.21% |
|
Decliners |
616 |
20% |
|
Decliners |
863 |
30% |
|
Russell 2000 |
+9.47 |
589.20 |
+1.63% |
|
52 Wk Highs |
208 |
|
|
52 Wk Highs |
83 |
|
|
S&P 600 |
+4.55 |
311.17 |
+1.48% |
|
52 Wk Lows |
4 |
|
|
52 Wk Lows |
20 |
|
|
 |
Stocks Continue To Rally Higher Amid US Dollar's Slide
Adam Sarhan, Contributing Writer,
Stocks rallied across the globe as the dollar fell and the Dubai World concerns continued to ease. As the major indices rose, volume was lighter than Monday's total reported on the NYSE, yet the volume total was reported higher on the Nasdaq exchange. Advancers trumped decliners by almost a 4-to-1 ratio on the NYSE and by a 2-to-1 ratio on the Nasdaq exchange. There were 45 high-ranked companies from the CANSLIM.net Leaders List making a new 52-week high and appearing on the CANSLIM.net BreakOuts Page, more than triple the total of 13 issues that appeared on the prior session. Leadership among high-ranked growth stocks had dried up in recent weeks, so the expansion in new highs was a welcome improvement. New 52-week highs solidly outnumbered new 52-week lows on the NYSE and on the Nasdaq exchange.
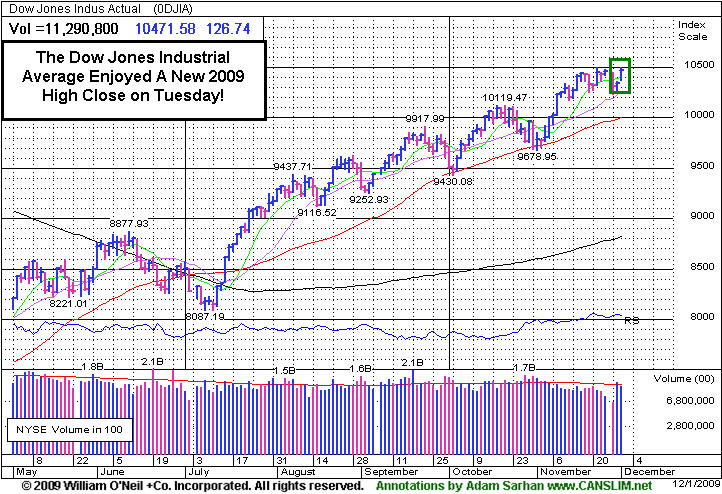
Stocks closed higher on the first trading day of the month as news spread that Dubai World entered talks to restructure nearly half its debt. Dubai World is trying to restructure $26 billion as a deadline for repayment nears. Last week, news broke that Dubai World might default on its debt and rattled capital markets around the globe. Currently, the financial world has lost over $1.7 trillion since the credit crisis began in 2007. If Dubai World defaults it will be the latest high profile default to hurt investors' psyche.
Elsewhere, HSBC said its index, which measures China’s manufacturing, rose in November and echoed the Institute for Supply Management (ISM)'s manufacturing index. The ISM said US manufacturing rose in November for a fourth consecutive month which is a healthy data point for the global recovery. Chinese manufacturing experienced its largest increase in five years as the global economy continues "recovering." The National Association of Realtors said the number of contracts to buy previously owned homes in the US unexpectedly rose +3.7% in October.
The weaker dollar sent stocks and a slew of commodities higher on Tuesday. Gold rallied for the 11th time in 12 sessions and hit a fresh all time high above $1,200 an ounce as investors continue buying the yellow metal. Gold stocks have benefited handsomely from gold's impressive rise in recent months, and the group of gold miners/producers continues to be an area of strength in this market. Other leadership can be found in Chinese stocks and large cap US technology names.
PICTURED: The Dow Jones Industrial Average enjoyed a fresh 2009 high close on Tuesday!
|
|
|
 |
Gold & Silver And Semiconductor Indexes Among Best Group Gainers
Kenneth J. Gruneisen - Passed the CAN SLIM® Master's Exam
The Gold & Silver Index ($XAU +4.91%) was a standout gainer on Tuesday while there were widespread gains across most industry groups. The Healthcare Index ($HMO +2.55%) rose and energy-related shares were solid defensive gainers as the Integrated Oil Index ($XOI +1.94%) and Oil Services Index ($OSX +1.47%) rose. The Semiconductor Index ($SOX +3.06%) led the tech sector indices unanimously higher, followed by gains from the Biotechnology Index ($BTK +1.31%), Networking Index ($NWX +1.33%), and Internet Index ($IIX +1.54%). Meanwhile the Bank Index ($BKX +0.00%) ended unchanged, yet the Broker/Dealer Index ($XBD +1.21%) and Retail Index ($RLX +1.81%) were also positive influences.
Charts courtesy www.stockcharts.com
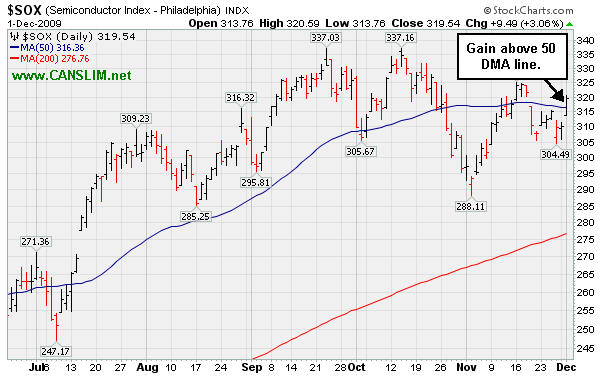
PICTURED: The Semiconductor Index ($SOX +3.06%) gapped and rallied above its 50-day moving average (DMA) line, leading the tech sector's widespread gains.
| Oil Services |
$OSX |
193.63 |
+2.80 |
+1.47% |
+59.51% |
| Healthcare |
$HMO |
1,375.87 |
+34.19 |
+2.55% |
+43.29% |
| Integrated Oil |
$XOI |
1,089.27 |
+20.70 |
+1.94% |
+11.19% |
| Semiconductor |
$SOX |
319.54 |
+9.49 |
+3.06% |
+50.61% |
| Networking |
$NWX |
224.00 |
+2.93 |
+1.33% |
+55.67% |
| Internet |
$IIX |
226.77 |
+3.45 |
+1.54% |
+69.52% |
| Broker/Dealer |
$XBD |
115.02 |
+1.38 |
+1.21% |
+48.47% |
| Retail |
$RLX |
409.45 |
+7.28 |
+1.81% |
+46.62% |
| Gold & Silver |
$XAU |
192.73 |
+9.02 |
+4.91% |
+55.62% |
| Bank |
$BKX |
44.48 |
+0.00 |
+0.00% |
+0.36% |
| Biotech |
$BTK |
899.78 |
+11.63 |
+1.31% |
+39.03% |
|
|
|
 |
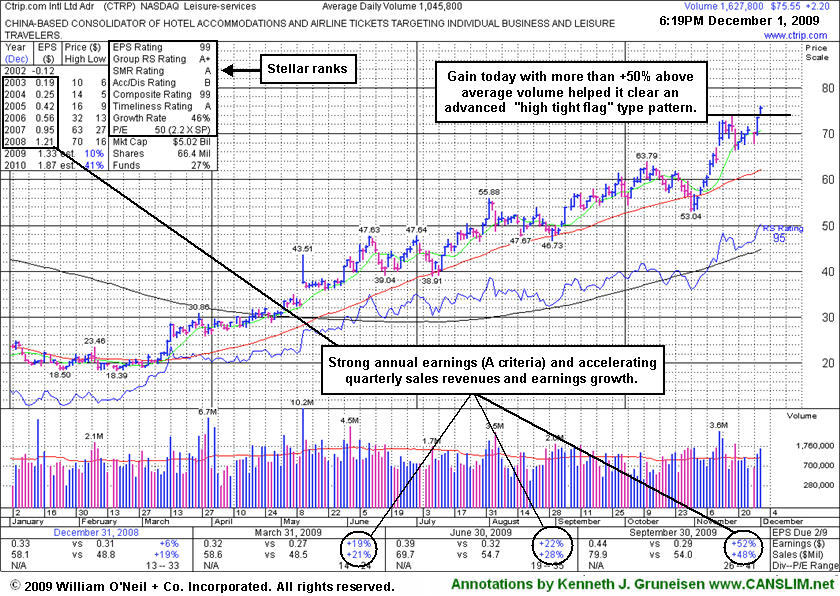
Strong Leader Makes Return Trip To Featured Stocks List
Kenneth J. Gruneisen - Passed the CAN SLIM® Master's Exam
Ctrip.com International (CTRP +$2.20 or +3.00% to $21.51) gapped up today and was highlighted in yellow in the mid-day report (read here) as it hit a new all-time high. It triggered a technical buy signal as it rose with more than +50% above average volume from a brief consolidation resembling a "high-tight-flag" pattern, an advanced chart pattern which it formed after repairing a late-October breach of its 50-day moving average (DMA) line and sprinting higher. Fundamentally, its sales revenues and earnings increases have shown acceleration in the 3 most recent quarterly comparisons and rose solidly above the +25% guideline in the latest period ended September 30, 2009.
The stock's last appearance in this section was actually a follow-up study on 12/29/08 that included an annotated graph under the headline "Disciplined Investors Avoided This Trip To The House Of Pain." That was well after if was dropped from the Featured Stocks list on 6/10/09 based on weak technical action when it closed at $49.84. Technically, it has rebounded very impressively from subsequent lows in the $16 area. It has maintained a strong and steady annual; earnings (A criteria) history. Fundamentals have shown greater sales revenues and earnings increases in the most current quarterly comparisons (C criteria), which is a very encouraging sign. The number of top-rated funds owning its shares increased from 52 in Mar '09 to 112 in Dec '09, which helps satisfy the I criteria.
|
|
|
Color Codes Explained :
Y - Better candidates highlighted by our
staff of experts.
G - Previously featured
in past reports as yellow but may no longer be buyable under the
guidelines.
***Last / Change / Volume quote data in this table corresponds with the timestamp on the note***
Symbol/Exchange
Company Name
Industry Group |
Last |
Chg. |
Vol
% DAV |
Date Featured |
Price Featured |
Latest Pivot Point
Featured |
Status |
| Latest Max Buy Price |
ARST
-
|
$23.41
|
+0.66
|
847,620
146% DAV
582,100
|
9/1/2009
(Date
Featured) |
$19.91
(Price
Featured) |
PP = $20.90 |
G |
| MB = $21.95 |
Most Recent Note - 12/1/2009 4:51:13 PM
G - Gain today on slightly higher and above average volume. Recent close below its 50 DMA line and violation of its 10/28/09 low raised concerns and triggered technical sell signals. ARST was first featured in yellow at $19.91 in the 9/01/09 mid-day report with an annotated daily graph (read here).
>>> The latest Featured Stock Update with an annotated graph appeared on 11/19/2009. click here.
|
|
C
A
S
I |
News |
Chart |
SEC
View all notes Alert
me of new notes
Company
Profile
|
ASIA
-
|
$25.94
|
+1.35
|
1,379,665
136% DAV
1,017,600
|
10/14/2009
(Date
Featured) |
$23.05
(Price
Featured) |
PP = $22.19 |
G |
| MB = $23.30 |
Most Recent Note - 12/1/2009 4:58:12 PM
G - Gapped up today, hitting and closing at a new 52-week high with a considerable gain on above average volume. Featured 10/14/09 in the mid-day report (read here) as it gapped up for a new 52-week high with 5 times average volume, triggering a technical buy signal by blasting above its pivot point. First featured in the August 2009 CANSLIM.net News (read here).
>>> The latest Featured Stock Update with an annotated graph appeared on 11/24/2009. click here.
|
|
C
A
S
I |
News |
Chart |
SEC
View all notes Alert
me of new notes
Company
Profile
|
BIDU
- NASDAQ
Baidu Inc Ads
INTERNET - Internet Information Providers
|
$435.55
|
+1.81
|
1,433,269
67% DAV
2,143,100
|
9/8/2009
(Date
Featured) |
$351.80
(Price
Featured) |
PP = $368.59 |
G |
| MB = $387.02 |
Most Recent Note - 12/1/2009 4:59:48 PM
G - Consolidating in a very tight trading range for nearly 4 weeks, perched near all-time highs. Proved resilient near its 50 DMA line after its 10/27/09 gap down. As recently noted, "Choppy action has not allowed it to form a sound base in recent weeks." BIDU traded up as much as +23% from its price when featured in yellow in the 9/08/09 Mid-Day BreakOuts Report (read here).
>>> The latest Featured Stock Update with an annotated graph appeared on 11/25/2009. click here.
|
|
C
A
S
I |
News |
Chart |
SEC
View all notes Alert
me of new notes
Company
Profile
|
CAAS
- NASDAQ
China Automotive Systems
AUTOMOTIVE - Auto Parts
|
$20.51
|
+1.16
|
2,317,186
661% DAV
350,400
|
11/30/2009
(Date
Featured) |
$18.84
(Price
Featured) |
PP = $17.62 |
G |
| MB = $18.50 |
Most Recent Note - 12/1/2009 5:05:27 PM
G - Considerable gains on heavy volume for the past 2 sessions helped it clear its 2004 all-time high while quickly trading more than +5% above its recent highs. Color code was changed to green as it got extended. The Chinese maker of power steering systems was rising from an advanced "3-weeks tight" type of chart pattern as it showed up in yellow in the 11/30/09 mid-day report (read here). Recent quarters show accelerating sales revenues and earnings increases, and it has a good annual earnings history.
>>> The latest Featured Stock Update with an annotated graph appeared on 11/30/2009. click here.
|
|
C
A
S
I |
News |
Chart |
SEC
View all notes Alert
me of new notes
Company
Profile
|
CACC
- NASDAQ
Credit Acceptance Corp
FINANCIAL SERVICES - Credit Services
|
$34.53
|
-0.06
|
65,522
178% DAV
36,800
|
9/29/2009
(Date
Featured) |
$33.48
(Price
Featured) |
PP = $37.10 |
Y |
| MB = $38.96 |
Most Recent Note - 12/1/2009 5:08:40 PM
Y - Held its ground today after promptly repairing its prior 50 DMA line violation. Color code was changed to yellow with new pivot point and max buy levels noted. After a 6-week flat base it is continuing its consolidation above prior chart highs in the $32 area. The Finance - Consumer/Commercial Loans firm has maintained a great track record of annual and quarterly sales revenues and earnings increases. It was featured on 9/29/09 in yellow in the mid-day report (read here).
>>> The latest Featured Stock Update with an annotated graph appeared on 11/27/2009. click here.
|
|
C
A
S
I |
News |
Chart |
SEC
View all notes Alert
me of new notes
Company
Profile
|
CRM
- NYSE
Salesforce.com Inc
INTERNET - Internet Software & Services
|
$64.32
|
+1.64
|
1,080,405
64% DAV
1,692,700
|
8/16/2009
(Date
Featured) |
$47.12
(Price
Featured) |
PP = $45.59 |
G |
| MB = $47.87 |
Most Recent Note - 12/1/2009 5:19:40 PM
G - Gain today on light volume, consolidating above important support at its 50 DMA line again. It has not formed any recent base, and distributional pressure has raised concerns.
>>> The latest Featured Stock Update with an annotated graph appeared on 11/23/2009. click here.
|
|
C
A
S
I |
News |
Chart |
SEC
View all notes Alert
me of new notes
Company
Profile
|
CTRP
- NASDAQ
Ctrip.com Intl Ltd Adr
LEISURE - Resorts & Casinos
|
$75.55
|
+2.20
|
1,628,724
157% DAV
1,038,900
|
12/1/2009
(Date
Featured) |
$75.38
(Price
Featured) |
PP = $73.91 |
Y |
| MB = $77.61 |
Most Recent Note - 12/1/2009 5:48:53 PM
Y - Gapped up today and appeared highlighted in yellow in the mid-day report (read here) as it hit a new all-time high. It triggered a technical buy signal as it rose with more than +50% above average volume from a brief consolidation resembling a "high-tight-flag" pattern which it formed after repairing a late-October breach of its 50 DMA line. Fundamentally, its sales revenues and earnings increases have shown acceleration in the 3 most recent quarterly comparisons and rose above the +25% guideline. Based on weak technical action it was dropped from the Featured Stocks list on 6/10/08, when it closed at $49.84, yet it has rebounded very impressively from subsequent lows in the $16 area.
>>> The latest Featured Stock Update with an annotated graph appeared on 12/1/2009. click here.
|
|
C
A
S
I |
News |
Chart |
SEC
View all notes Alert
me of new notes
Company
Profile
|
HEAT
-
|
$14.95
|
+1.73
|
3,468,295
500% DAV
693,400
|
11/17/2009
(Date
Featured) |
$12.00
(Price
Featured) |
PP = $12.61 |
G |
| MB = $13.24 |
Most Recent Note - 12/1/2009 5:57:27 PM
G - Gains for the past 2 sessions on very heavy volume helped it rally well beyond its "may buy" level, and today its color code is changed to green. It found support near its pivot point during its recent consolidation, giving investors an opportunity to accumulate shares without chasing it and buying it "extended" from its latest base. First featured in yellow in the 11/17/09 mid-day report (read here) when technically rising from a "double bottom" base, reaching a new all-time high. On 9/18/09 it completed an additional share offering. There is limited history for this small Chinese firm in the Pollution Control - Equipment group, however its reported annual earnings (A criteria) history has been strong, and the 3 latest quarters show sales revenues and earnings increases well above the +25% guideline.
>>> The latest Featured Stock Update with an annotated graph appeared on 11/17/2009. click here.
|
|
C
A
S
I |
News |
Chart |
SEC
View all notes Alert
me of new notes
Company
Profile
|
LFT
-
|
$36.77
|
+1.36
|
538,228
112% DAV
481,200
|
11/17/2009
(Date
Featured) |
$31.77
(Price
Featured) |
PP = $33.04 |
G |
| MB = $34.69 |
Most Recent Note - 12/1/2009 5:58:54 PM
G - Gain today on near average volume for a new all-time high, getting extended after recently rising from a choppy 14-week base. Prior chart highs in the $31 area are an initial support level to watch. A proposed offering of additional shares on 11/16/09 seems well received by the market. Its fundamentals remain strong.
>>> The latest Featured Stock Update with an annotated graph appeared on 11/18/2009. click here.
|
|
C
A
S
I |
News |
Chart |
SEC
View all notes Alert
me of new notes
Company
Profile
|
|
|
|
THESE ARE NOT BUY RECOMMENDATIONS!
Comments contained in the body of this report are technical
opinions only. The material herein has been obtained
from sources believed to be reliable and accurate, however,
its accuracy and completeness cannot be guaranteed.
This site is not an investment advisor, hence it does
not endorse or recommend any securities or other investments.
Any recommendation contained in this report may not
be suitable for all investors and it is not to be deemed
an offer or solicitation on our part with respect to
the purchase or sale of any securities. All trademarks,
service marks and trade names appearing in this report
are the property of their respective owners, and are
likewise used for identification purposes only.
This report is a service available
only to active Paid Premium Members.
You may opt-out of receiving report notifications
at any time. Questions or comments may be submitted
by writing to Premium Membership Services 665 S.E. 10 Street, Suite 201 Deerfield Beach, FL 33441-5634 or by calling 1-800-965-8307
or 954-785-1121.
|
|
|


