You are not logged in.
This means you
CAN ONLY VIEW reports that were published prior to Monday, April 14, 2025.
You
MUST UPGRADE YOUR MEMBERSHIP if you want to see any current reports.
AFTER MARKET UPDATE - MONDAY, NOVEMBER 30TH, 2009
Previous After Market Report Next After Market Report >>>
|
|
|
|
DOW |
+34.92 |
10,344.84 |
+0.34% |
|
Volume |
1,348,131,250 |
+106% |
|
Volume |
2,190,510,260 |
+122% |
|
NASDAQ |
+6.16 |
2,144.60 |
+0.29% |
|
Advancers |
1,750 |
56% |
|
Advancers |
1,396 |
49% |
|
S&P 500 |
+4.14 |
1,095.63 |
+0.38% |
|
Decliners |
1,277 |
41% |
|
Decliners |
1,336 |
47% |
|
Russell 2000 |
+2.52 |
579.73 |
+0.44% |
|
52 Wk Highs |
55 |
|
|
52 Wk Highs |
40 |
|
|
S&P 600 |
+1.24 |
306.62 |
+0.41% |
|
52 Wk Lows |
15 |
|
|
52 Wk Lows |
33 |
|
|
 |
Stocks Rally After Recent Ripples
Adam Sarhan, Contributing Writer,
The US stock market closed higher on the first full trading session after the Dubai news broke late last week. On Friday stocks sold off as investors unloaded their positions ahead of the the weekend. Monday's advancers led decliners by almost a 3-to-2 ratio on the NYSE awhile the mix was nearly even on the Nasdaq exchange. As expected, volume totals were heavier than Friday's holiday-shortened trading session. There were 13 high-ranked companies from the CANSLIM.net Leaders List making a new 52-week high and appearing on the CANSLIM.net BreakOuts Page. New 52-week highs reported outnumbered new 52-week lows on the NYSE and on the Nasdaq exchange.
Stocks spent most of the session in the red but buyers showed up in the final hour which helped the major averages close higher on the day. Monday was the first full trading session since the Dubai news spread late last week. It was encouraging to see the major averages rally despite concerns regarding the possible default of Dubai World. Dubai World said that it is currently engaged in “constructive” initial talks with its lenders to restructure about $26 billion of debt. At this point, the world is beginning to accept the notion that Dubai World is an isolated incident and it will most likely be bailed out by one of its wealthy neighbors. Since no one knows for sure exactly how much debt is at stake, most investors believe that the total debt is under $100 billion (highest estimates). If that is the case, it is only a "blip" on the world's economic radar. More importantly, if Dubai is bailed out then it will become a moot issue.
The US dollar fell on Monday which helped stocks and a slew of commodities. The Chinese government reiterated its stance regarding its stimulus package after India announced its economy grew at a very healthy rate of +7.9%, which topped estimates. The National Retail Federation released a report that showed that holiday traffic was up from the same period last year, but the average shopper spent $343.31 in stores and online over the Thanksgiving holiday weekend, less than the $372.57 spent last year. The group reaffirmed its forecast for a -1% decline in spending for this holiday season.
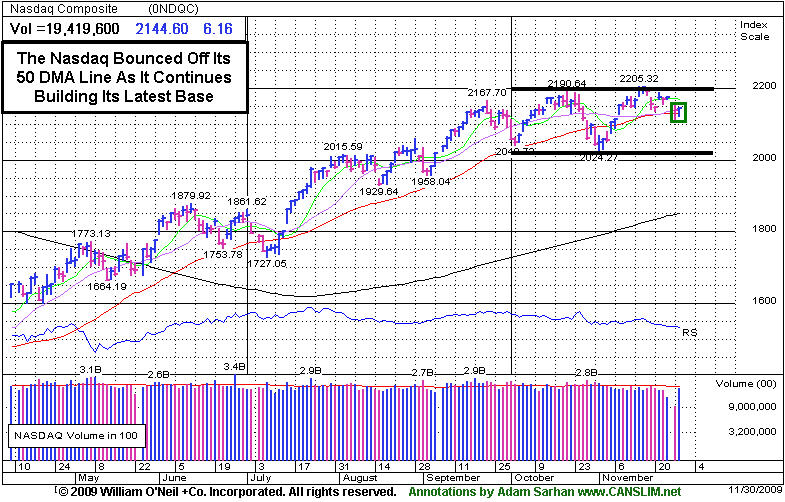
PICTURED: The Nasdaq Composite Index bounced off its 50-day moving average (DMA) line as it continues tracing out a new base. Further deterioration, however, would not bode well for the market outlook. Sustained rallies require a healthy crop of leaders making new highs, so an expansion of leadership is critical to the present rally.
|
|
|
 |
Internet Index Among Healthier Industry Group Charts
Kenneth J. Gruneisen - Passed the CAN SLIM® Master's Exam
Financial shares bounced on Monday and gains from the Broker/Dealer Index ($XBD +2.38%) and Bank Index ($BKX +3.35%) assisted the major averages substantially in following up the Thanksgiving holiday with a positive session. The Retail Index ($RLX -0.52%) lost ground, however there were small gains from the Biotechnology Index ($BTK +0.29%) and Internet Index ($IIX +0.29%) while the Networking Index ($NWX +0.03%) and Semiconductor Index ($SOX +0.07%) fought to hold their ground. The Oil Services Index ($OSX +0.83%) posted a modest gain, meanwhile defensive areas mostly lagged and the Healthcare Index ($HMO -0.99%) and Integrated Oil Index ($XOI -0.62%) ended lower. The Gold & Silver Index ($XAU +0.10%) barely edged higher.
Charts courtesy www.stockcharts.com
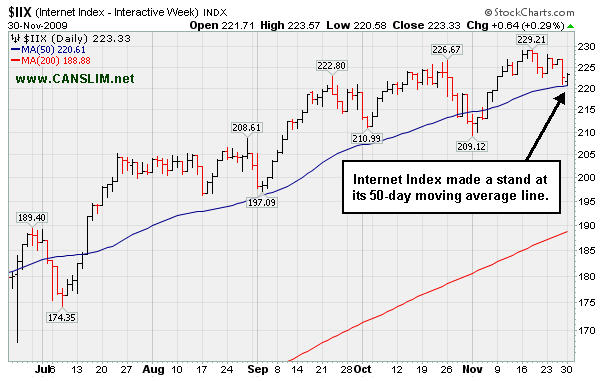
PICTURED: The Internet Index made a stand at its 50-day moving average (DMA) line, a sign of healthy support in the group. It is healthy compared to the financial indexes shown in last Friday's IGW section (read here), both of which are below their respective 50 DMA lines.
| Oil Services |
$OSX |
190.83 |
+1.58 |
+0.83% |
+57.20% |
| Healthcare |
$HMO |
1,341.68 |
-13.38 |
-0.99% |
+39.73% |
| Integrated Oil |
$XOI |
1,068.57 |
-6.63 |
-0.62% |
+9.07% |
| Semiconductor |
$SOX |
310.05 |
+0.23 |
+0.07% |
+46.13% |
| Networking |
$NWX |
221.07 |
+0.07 |
+0.03% |
+53.64% |
| Internet |
$IIX |
223.33 |
+0.64 |
+0.29% |
+66.95% |
| Broker/Dealer |
$XBD |
113.64 |
+2.64 |
+2.38% |
+46.69% |
| Retail |
$RLX |
402.17 |
-2.09 |
-0.52% |
+44.01% |
| Gold & Silver |
$XAU |
183.71 |
+0.19 |
+0.10% |
+48.33% |
| Bank |
$BKX |
44.48 |
+1.44 |
+3.35% |
+0.36% |
| Biotech |
$BTK |
888.15 |
+2.54 |
+0.29% |
+37.24% |
|
|
|
 |
Chinese Small-Cap Rises From Advanced Chart Pattern
Kenneth J. Gruneisen - Passed the CAN SLIM® Master's Exam
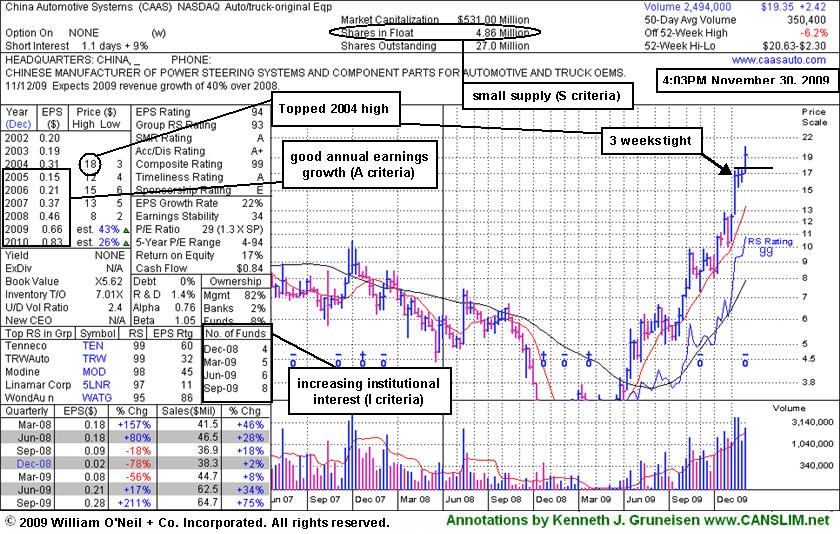
China Automotive Systems (CAAS +$2.42 or +14.29% to $19.35) finished the session with a considerable gain on heavy volume. The Chinese maker of power steering systems was rising from an advanced "3-weeks tight" type of chart pattern as it showed up in yellow in today's mid-day report (read here). Today it is also cleared its 2004 all-time high while quickly trading more than +5% above its recent highs. It may be considered risky and unwise to be undisciplined about buying and chase it, yet the high-ranked leader may go on to produce more climactic gains. Caution and discipline are especially critical for investors since it is already up more than 8-fold from its March lows.
Recent quarters show accelerating sales revenues and earnings increases, and it has a good annual earnings history (A criteria). The weekly chart below shows a small number, but increasing ownership from a handful top-rated funds. That is encouraging news concerning the I criteria of the investment system. Meanwhile, the small supply of shares (S criteria) in its publicly traded float could contribute to great volatility in the event of more abrupt maneuvering by large and highly influential fund managers.
|
|
|
Color Codes Explained :
Y - Better candidates highlighted by our
staff of experts.
G - Previously featured
in past reports as yellow but may no longer be buyable under the
guidelines.
***Last / Change / Volume quote data in this table corresponds with the timestamp on the note***
Symbol/Exchange
Company Name
Industry Group |
Last |
Chg. |
Vol
% DAV |
Date Featured |
Price Featured |
Latest Pivot Point
Featured |
Status |
| Latest Max Buy Price |
ARST
-
|
$22.75
|
-0.69
|
661,337
114% DAV
582,100
|
9/1/2009
(Date
Featured) |
$19.91
(Price
Featured) |
PP = $20.90 |
G |
| MB = $21.95 |
Most Recent Note - 11/30/2009 5:13:03 PM
G - Loss today on heavier and slightly above average volume led to more technical damage. The prior gap down and close below its 50 DMA line, and violation of its 10/28/09 low, may be considered technical sell signals. ARST was first featured in yellow at $19.91 in the 9/01/09 mid-day report with an annotated daily graph (read here).
>>> The latest Featured Stock Update with an annotated graph appeared on 11/19/2009. click here.
|
|
C
A
S
I |
News |
Chart |
SEC
View all notes Alert
me of new notes
Company
Profile
|
ASIA
-
|
$24.59
|
+0.21
|
751,152
74% DAV
1,017,600
|
10/14/2009
(Date
Featured) |
$23.05
(Price
Featured) |
PP = $22.19 |
G |
| MB = $23.30 |
Most Recent Note - 11/30/2009 5:14:31 PM
G - Held its ground today after a gap down on the prior session and intra-day lows below its "max buy" level. Featured 10/14/09 in the mid-day report (read here) as it gapped up for a new 52-week high with 5 times average volume, triggering a technical buy signal by blasting above its pivot point. First featured in the August 2009 CANSLIM.net News (read here).
>>> The latest Featured Stock Update with an annotated graph appeared on 11/24/2009. click here.
|
|
C
A
S
I |
News |
Chart |
SEC
View all notes Alert
me of new notes
Company
Profile
|
BIDU
- NASDAQ
Baidu Inc Ads
INTERNET - Internet Information Providers
|
$433.74
|
-5.98
|
1,887,918
88% DAV
2,143,100
|
9/8/2009
(Date
Featured) |
$351.80
(Price
Featured) |
PP = $368.59 |
G |
| MB = $387.02 |
Most Recent Note - 11/30/2009 5:16:23 PM
G - Perched near all-time highs. Proved resilient near its 50 DMA line after its 10/27/09 gap down. As recently noted, "Choppy action has not allowed it to form a sound base in recent weeks." BIDU traded up as much as +23% from its price when featured in yellow in the 9/08/09 Mid-Day BreakOuts Report (read here).
>>> The latest Featured Stock Update with an annotated graph appeared on 11/25/2009. click here.
|
|
C
A
S
I |
News |
Chart |
SEC
View all notes Alert
me of new notes
Company
Profile
|
CAAS
- NASDAQ
China Automotive Systems
AUTOMOTIVE - Auto Parts
|
$19.35
|
+2.42
|
2,504,935
715% DAV
350,400
|
11/30/2009
(Date
Featured) |
$18.84
(Price
Featured) |
PP = $17.62 |
Y |
| MB = $18.50 |
Most Recent Note - 11/30/2009 5:18:19 PM
Y - Finished the session with a considerable gain on heavy volume. The Chinese maker of power steering systems was rising from an advanced "3-weeks tight" type of chart pattern as it showed up in yellow in today's mid-day report (read here). Today it is also cleared its 2004 all-time high while quickly trading more than +5% above its recent highs. Recent quarters show accelerating sales revenues and earnings increases, and it has a good annual earnings history.
>>> The latest Featured Stock Update with an annotated graph appeared on 11/30/2009. click here.
|
|
C
A
S
I |
News |
Chart |
SEC
View all notes Alert
me of new notes
Company
Profile
|
CACC
- NASDAQ
Credit Acceptance Corp
FINANCIAL SERVICES - Credit Services
|
$34.59
|
+0.96
|
49,125
133% DAV
36,800
|
9/29/2009
(Date
Featured) |
$33.48
(Price
Featured) |
PP = $37.10 |
Y |
| MB = $38.96 |
Most Recent Note - 11/30/2009 5:19:54 PM
Y - Gain today with above average volume promptly repaired its prior 50 DMA line violation. Color code was changed to yellow with new pivot point and max buy levels noted. After a 6-week flat base it is continuing its consolidation above prior chart highs in the $32 area. The Finance - Consumer/Commercial Loans firm has maintained a great track record of annual and quarterly sales revenues and earnings increases. It was featured on 9/29/09 in yellow in the mid-day report (read here).
>>> The latest Featured Stock Update with an annotated graph appeared on 11/27/2009. click here.
|
|
C
A
S
I |
News |
Chart |
SEC
View all notes Alert
me of new notes
Company
Profile
|
CRM
- NYSE
Salesforce.com Inc
INTERNET - Internet Software & Services
|
$62.68
|
-0.57
|
1,437,988
85% DAV
1,692,700
|
8/16/2009
(Date
Featured) |
$47.12
(Price
Featured) |
PP = $45.59 |
G |
| MB = $47.87 |
Most Recent Note - 11/30/2009 5:21:23 PM
G - Gapped down again today for a small loss on light volume, consolidating near important support at its 50 DMA line again. It has not formed any recent base, and distributional pressure has raised concerns.
>>> The latest Featured Stock Update with an annotated graph appeared on 11/23/2009. click here.
|
|
C
A
S
I |
News |
Chart |
SEC
View all notes Alert
me of new notes
Company
Profile
|
GMCR
- NASDAQ
Green Mtn Coffee Roastrs
FOOD & BEVERAGE - Processed & Packaged Goods
|
$62.98
|
+0.03
|
1,198,269
86% DAV
1,388,000
|
10/5/2009
(Date
Featured) |
$71.11
(Price
Featured) |
PP = $75.89 |
G |
| MB = $79.68 |
Most Recent Note - 11/30/2009 5:22:53 PM
G - Small gain on near average volume today. It has failed to rally back after recent distributional pressure, and it recently triggered a sell signal by its 50 DMA line violation. Gapped down on 11/12/09 after reporting strong quarterly results for the period ended Sept 30, 2009. As recently noted, "Its choppy action in recent weeks has not allowed for a sound new base to form."
>>> The latest Featured Stock Update with an annotated graph appeared on 11/20/2009. click here.
|
|
C
A
S
I |
News |
Chart |
SEC
View all notes Alert
me of new notes
Company
Profile
|
HEAT
-
|
$13.22
|
+0.37
|
2,328,728
336% DAV
693,400
|
11/17/2009
(Date
Featured) |
$12.00
(Price
Featured) |
PP = $12.61 |
Y |
| MB = $13.24 |
Most Recent Note - 11/30/2009 5:24:30 PM
Y - Gain today on very heavy volume, closing near its max buy level. Consolidated last week after the prior week's gains on heavy volume drew attention. It was first featured in yellow in the 11/17/09 mid-day report (read here) when technically rising from a "double bottom" base, reaching a new all-time high. On 9/18/09 it completed an additional share offering. There is limited history for this small Chinese firm in the Pollution Control - Equipment group, however its reported annual earnings (A criteria) history has been strong, and the 3 latest quarters show sales revenues and earnings increases well above the +25% guideline.
>>> The latest Featured Stock Update with an annotated graph appeared on 11/17/2009. click here.
|
|
C
A
S
I |
News |
Chart |
SEC
View all notes Alert
me of new notes
Company
Profile
|
LFT
-
|
$35.41
|
+0.04
|
333,176
69% DAV
481,200
|
11/17/2009
(Date
Featured) |
$31.77
(Price
Featured) |
PP = $33.04 |
G |
| MB = $34.69 |
Most Recent Note - 11/30/2009 5:25:56 PM
G - Holding its ground near all-time highs after recently rising from a choppy 14-week base. Prior chart highs in the $31 area are an initial support level to watch. A proposed offering of additional shares on 11/16/09 seems well received by the market. Its fundamentals remain strong.
>>> The latest Featured Stock Update with an annotated graph appeared on 11/18/2009. click here.
|
|
C
A
S
I |
News |
Chart |
SEC
View all notes Alert
me of new notes
Company
Profile
|
|
|
|
THESE ARE NOT BUY RECOMMENDATIONS!
Comments contained in the body of this report are technical
opinions only. The material herein has been obtained
from sources believed to be reliable and accurate, however,
its accuracy and completeness cannot be guaranteed.
This site is not an investment advisor, hence it does
not endorse or recommend any securities or other investments.
Any recommendation contained in this report may not
be suitable for all investors and it is not to be deemed
an offer or solicitation on our part with respect to
the purchase or sale of any securities. All trademarks,
service marks and trade names appearing in this report
are the property of their respective owners, and are
likewise used for identification purposes only.
This report is a service available
only to active Paid Premium Members.
You may opt-out of receiving report notifications
at any time. Questions or comments may be submitted
by writing to Premium Membership Services 665 S.E. 10 Street, Suite 201 Deerfield Beach, FL 33441-5634 or by calling 1-800-965-8307
or 954-785-1121.
|
|
|


