***Last / Change / Volume data in this table is the closing quote data***
Symbol/Exchange
Company Name
Industry Group |
PRICE |
CHANGE
(%Change) |
Day High |
Volume
(% DAV)
(% 50 day avg vol) |
52 Wk Hi
% From Hi |
Featured
Date |
Price
Featured |
Pivot Featured |
|
Max Buy |
BITA
-
NYSE
Bitauto Hldgs Ltd Ads
INTERNET - Internet Information Providers
|
$31.50
|
-0.36
-1.13% |
$32.29
|
730,554
64.74% of 50 DAV
50 DAV is 1,128,500
|
$35.04
-10.10%
|
9/24/2013
|
$16.40
|
PP = $17.31
|
|
MB = $18.18
|
 Most Recent Note - 11/29/2013 10:53:00 AM
G - Hovering near its 52-week high, very extended from any sound base. Its prior high in the $28 area define initial support to watch on pullbacks.
>>> FEATURED STOCK ARTICLE : Consolidating After Getting Extended From Prior Base - 11/11/2013
View all notes |
Set NEW NOTE alert |
CANSLIM.net Company Profile |
SEC
News |
Chart |
Request a new note
C
A N
S L
I M


|
BLOX
-
NYSE
Infoblox Inc
COMPUTER HARDWARE - Networking and Communication Dev
|
$31.78
|
-0.30
-0.94% |
$32.47
|
1,925,679
195.74% of 50 DAV
50 DAV is 983,800
|
$48.97
-35.10%
|
10/11/2013
|
$43.02
|
PP = $45.60
|
|
MB = $47.88
|
Most Recent Note - 11/29/2013 12:37:49 PM
It may likely find support at its 200 DMA line, but it is being dropped from the Featured Stocks list tonight. A damaging gap down and volume-driven loss on the prior session triggered another worrisome technical sell signal, and prior reports repeatedly reminded members - "Disciplined investors always limit losses by selling any stock that falls more than -7% from their purchase price."
>>> FEATURED STOCK ARTICLE : Volume Driven Losses Violated 50-Day Moving Average Line - 11/19/2013
View all notes |
Set NEW NOTE alert |
CANSLIM.net Company Profile |
SEC
News |
Chart |
Request a new note
C
A N
S L
I M
|
CELG
-
NASDAQ
Celgene Corp
DRUGS - Drug Manufacturers - Major
|
$161.77
|
+0.25
0.15% |
$162.57
|
1,065,066
35.78% of 50 DAV
50 DAV is 2,976,700
|
$165.74
-2.40%
|
9/12/2013
|
$149.50
|
PP = $150.02
|
|
MB = $157.52
|
Most Recent Note - 11/29/2013 2:54:45 PM
G - Hovering near its 52-week and all-time highs with volume totals cooling after volume-driven gains to new highs. Earnings +21% on +18% sales revenues for the Sep '13 quarter were below the +25% minimum guideline (C criteria) raising fundamental concerns.
>>> FEATURED STOCK ARTICLE : Testing 50-Day Average Following Sub Par Earnings Increase - 11/1/2013
View all notes |
Set NEW NOTE alert |
CANSLIM.net Company Profile |
SEC
News |
Chart |
Request a new note
C
A N
S L
I M
|
EGOV
-
NASDAQ
N I C Inc
INTERNET - Internet Software and Services
|
$24.38
|
+0.40
1.67% |
$24.68
|
133,921
43.91% of 50 DAV
50 DAV is 305,000
|
$25.99
-6.19%
|
10/18/2013
|
$25.17
|
PP = $23.66
|
|
MB = $24.84
|
Most Recent Note - 11/25/2013 5:36:24 PM
G - Posted a small gain today with light volume after recent distributional pressure. Disciplined investors always limit losses by selling any stock that falls more than -7% from their purchase price. See the latest FSU analysis for more details and new annotated daily and weekly graphs.
>>> FEATURED STOCK ARTICLE : Finding Support Near 50-Day Average During Distributional Pressure - 11/25/2013
View all notes |
Set NEW NOTE alert |
CANSLIM.net Company Profile |
SEC
News |
Chart |
Request a new note
C
A N
S L
I M
|
FLT
-
NYSE
Fleetcor Technologies
DIVERSIFIED SERVICES - Business/Management Services
|
$121.78
|
+0.58
0.48% |
$122.79
|
245,892
29.33% of 50 DAV
50 DAV is 838,400
|
$122.34
-0.46%
|
8/19/2013
|
$99.01
|
PP = $100.97
|
|
MB = $106.02
|
Most Recent Note - 11/26/2013 7:23:39 PM
G - Churned heavy volume today while perched at its all-time high, extended from any sound base. Its 50 DMA line ($112.43 now) defines near-term support to watch on pullbacks.
>>> FEATURED STOCK ARTICLE : Perched Near All-Time High Tallying Quiet Gains - 11/13/2013
View all notes |
Set NEW NOTE alert |
CANSLIM.net Company Profile |
SEC
News |
Chart |
Request a new note
C
A N
S L
I M
|
Symbol/Exchange
Company Name
Industry Group |
PRICE |
CHANGE
(%Change) |
Day High |
Volume
(% DAV)
(% 50 day avg vol) |
52 Wk Hi
% From Hi |
Featured
Date |
Price
Featured |
Pivot Featured |
|
Max Buy |
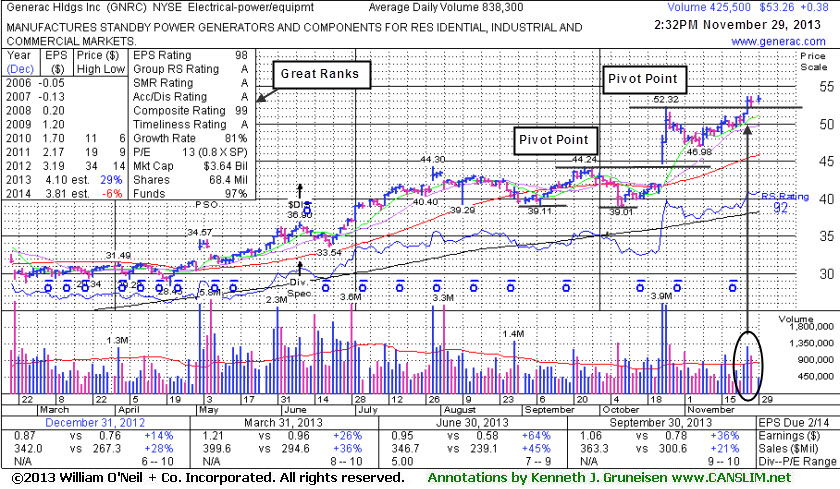
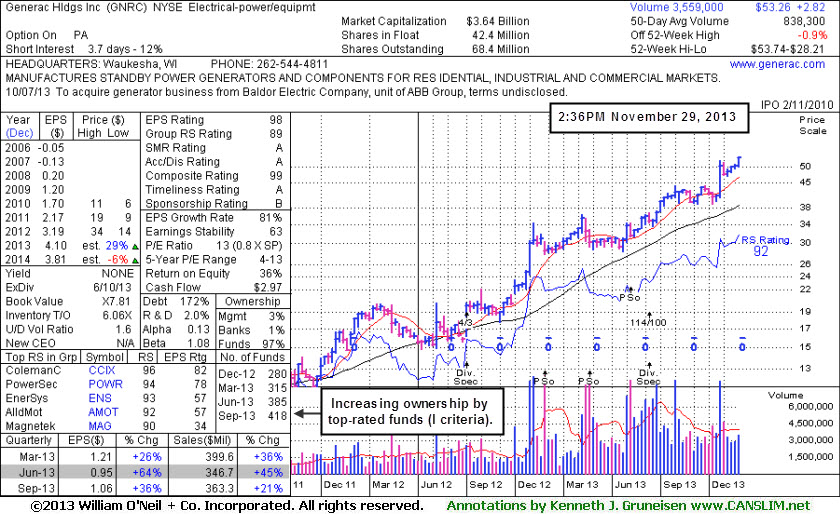
GNRC
-
NYSE
Generac Hldgs Inc
CONSUMER DURABLES - Electronic Equipment
|
$53.26
|
+0.38
0.72% |
$53.74
|
460,684
54.95% of 50 DAV
50 DAV is 838,300
|
$53.68
-0.78%
|
11/26/2013
|
$53.02
|
PP = $52.42
|
|
MB = $55.04
|
Most Recent Note - 11/29/2013 2:46:49 PM
Y - Perched at its 52-week high today. Prior highs in the $52 area define initial support to watch after its breakout from a short flat base with +59% above average volume triggered a new (or-add on) technical buy signal. See the latest FSU analysis for more details and new annotated daily and weekly graphs.
>>> FEATURED STOCK ARTICLE : Following Latest Breakout Prior Highs Define Support - 11/29/2013
View all notes |
Set NEW NOTE alert |
CANSLIM.net Company Profile |
SEC
News |
Chart |
Request a new note
C
A N
S L
I M
|
HLF
-
NYSE
Herbalife Ltd
DRUGS - Nutrition and Weight Management
|
$69.68
|
+0.00
0.00% |
$70.25
|
624,772
24.59% of 50 DAV
50 DAV is 2,540,400
|
$74.94
-7.02%
|
11/22/2013
|
$72.21
|
PP = $75.04
|
|
MB = $78.79
|
Most Recent Note - 11/29/2013 2:48:44 PM
Y - Subsequent volume-driven gains for new highs may trigger a technical buy signal. Volume totals have been cooling while consolidating above its 50 DMA line and within close striking distance of its 52-week high.
>>> FEATURED STOCK ARTICLE : Perched Near Highs Following Rebound - 11/22/2013
View all notes |
Set NEW NOTE alert |
CANSLIM.net Company Profile |
SEC
News |
Chart |
Request a new note
C
A N
S L
I M
|
JAZZ
-
NASDAQ
Jazz Pharmaceuticals Plc
DRUGS - Biotechnology
|
$116.92
|
+1.27
1.10% |
$117.38
|
243,503
31.97% of 50 DAV
50 DAV is 761,600
|
$118.80
-1.58%
|
9/30/2013
|
$93.20
|
PP = $89.10
|
|
MB = $93.56
|
Most Recent Note - 11/27/2013 6:29:34 PM
G- Hovering near its 52-week high, extended from any sound base. Prior notes reminded members - "Disciplined investors avoid chasing stocks more than +5% above prior highs and always limit losses by selling any stock that falls more than -7% from their purchase price."
>>> FEATURED STOCK ARTICLE : Hovering Near All-Time Highs Following Volume-Driven Gains - 11/7/2013
View all notes |
Set NEW NOTE alert |
CANSLIM.net Company Profile |
SEC
News |
Chart |
Request a new note
C
A N
S L
I M
|
KORS
-
NYSE
Michael Kors Hldgs Ltd
RETAIL - Apparel Stores
|
$81.55
|
-0.29
-0.35% |
$82.50
|
1,129,343
24.67% of 50 DAV
50 DAV is 4,578,600
|
$83.13
-1.91%
|
8/6/2013
|
$69.66
|
PP = $66.28
|
|
MB = $69.59
|
Most Recent Note - 11/27/2013 6:31:02 PM
G - Volume totals have still been cooling while hovering in a tight range near all-time highs, stubbornly holding its ground. Prior highs in the $78 area define near-term support above its 50 DMA line.
>>> FEATURED STOCK ARTICLE : Hitting New Highs After Choppy Consolidation - 11/6/2013
View all notes |
Set NEW NOTE alert |
CANSLIM.net Company Profile |
SEC
News |
Chart |
Request a new note
C
A N
S L
I M
|
LOPE
-
NASDAQ
Grand Canyon Education
DIVERSIFIED SERVICES - Education and; Training Services
|
$45.54
|
+0.69
1.54% |
$45.73
|
221,166
52.60% of 50 DAV
50 DAV is 420,500
|
$50.48
-9.79%
|
6/19/2013
|
$31.47
|
PP = $34.17
|
|
MB = $35.88
|
Most Recent Note - 11/26/2013 7:15:11 PM
G - Its 50 DMA line defines support. See the latest FSU analysis for more details and new annotated daily and weekly graphs. Repeatedly noted - "Fundamental concerns remain while technical action has been reassuring."
>>> FEATURED STOCK ARTICLE : Fundamental Concerns Noted While Consolidating Above 50-Day Moving Average - 11/26/2013
View all notes |
Set NEW NOTE alert |
CANSLIM.net Company Profile |
SEC
News |
Chart |
Request a new note
C
A N
S L
I M
|
Symbol/Exchange
Company Name
Industry Group |
PRICE |
CHANGE
(%Change) |
Day High |
Volume
(% DAV)
(% 50 day avg vol) |
52 Wk Hi
% From Hi |
Featured
Date |
Price
Featured |
Pivot Featured |
|
Max Buy |
MRLN
-
NASDAQ
Marlin Business Services
DIVERSIFIED SERVICES - Rental and Leasing Services
|
$24.85
|
-0.31
-1.23% |
$24.93
|
8,070
34.64% of 50 DAV
50 DAV is 23,300
|
$28.64
-13.23%
|
9/9/2013
|
$23.75
|
PP = $24.03
|
|
MB = $25.23
|
Most Recent Note - 11/25/2013 1:32:37 PM
G - Gains have lacked volume conviction while it is still sputtering below its 50 DMA line. After damaging losses triggered worrisome technical sell signals it halted its slide near prior resistance in the $24 area. Needs gains above its 50 DMA line for its outlook to improve.
>>> FEATURED STOCK ARTICLE : Violated 50-Day Moving Average Line Raising Concerns - 11/14/2013
View all notes |
Set NEW NOTE alert |
CANSLIM.net Company Profile |
SEC
News |
Chart |
Request a new note
C
A N
S L
I M
|
NOAH
-
NYSE
Noah Holdings Ltd Ads
FINANCIAL SERVICES - Asset Management
|
$20.09
|
-0.20
-0.99% |
$20.50
|
154,262
18.27% of 50 DAV
50 DAV is 844,400
|
$25.51
-21.25%
|
10/15/2013
|
$19.10
|
PP = $18.33
|
|
MB = $19.25
|
Most Recent Note - 11/26/2013 7:25:39 PM
G - Posted a gain today with light volume halting its slide at its 50 DMA line which acted as support throughout its choppy ascent. A violation may trigger a technical sell signal. Caution is called for after a worrisome "negative reversal" occurred at its 52-week high, and it is extended from its latest base.
>>> FEATURED STOCK ARTICLE : 50-Day Average And Prior Highs Define Important Support - 11/20/2013
View all notes |
Set NEW NOTE alert |
CANSLIM.net Company Profile |
SEC
News |
Chart |
Request a new note
C
A N
S L
I M
|
PCLN
-
NASDAQ
Priceline.Com Inc
INTERNET - Internet Software and Services
|
$1,192.33
|
+5.14
0.43% |
$1,198.75
|
320,178
49.41% of 50 DAV
50 DAV is 648,000
|
$1,193.47
-0.10%
|
9/13/2013
|
$966.82
|
PP = $995.08
|
|
MB = $1,044.83
|
Most Recent Note - 11/27/2013 6:32:45 PM
G - Wedged to yet another new 52-week high with today's 3rd consecutive gain backed by below average volume. Found support at its 50 DMA line on prior pullbacks, however it has not formed any recent sound base pattern. Reported earnings +40% on +33% sales revenues for the Sep '13 quarter versus the year-ago period, improving after a slightly sub par Jun '13 report.
>>> FEATURED STOCK ARTICLE : Rallied to New Highs Following Pullback to 50-day Average - 10/29/2013
View all notes |
Set NEW NOTE alert |
CANSLIM.net Company Profile |
SEC
News |
Chart |
Request a new note
C
A N
S L
I M
|
PRAA
-
NASDAQ
Portfolio Recovery Assoc
DIVERSIFIED SERVICES - Business/Management Services
|
$58.40
|
+0.38
0.65% |
$58.84
|
147,079
33.13% of 50 DAV
50 DAV is 443,900
|
$63.96
-8.70%
|
10/17/2013
|
$60.75
|
PP = $61.70
|
|
MB = $64.79
|
Most Recent Note - 11/29/2013 2:51:39 PM
G - Its Relative Strength rating has improved to 83 while still consolidating below its 50 DMA line. The 50 DMA line is now downward sloping and may act as resistance. A rebound above that short-term average is needed for its outlook to improve.
>>> FEATURED STOCK ARTICLE : Near 50-Day Moving Average Enduring Distributional Pressure - 11/5/2013
View all notes |
Set NEW NOTE alert |
CANSLIM.net Company Profile |
SEC
News |
Chart |
Request a new note
C
A N
S L
I M
|
PRLB
-
NYSE
Proto Labs Inc
MANUFACTURING - Small Tools and Accessories
|
$74.30
|
-0.55
-0.73% |
$75.19
|
185,416
38.87% of 50 DAV
50 DAV is 477,000
|
$89.97
-17.42%
|
7/29/2013
|
$64.86
|
PP = $67.50
|
|
MB = $70.88
|
Most Recent Note - 11/26/2013 7:28:12 PM
G - Down again today with above average volume. A rebound above its 50 DMA line is needed to help its outlook improve. Its prior low of $68.29 on 10/09/13 defines support above its 200 DMA line.
>>> FEATURED STOCK ARTICLE : Undercut 50-Day Moving Average Yet Found Prompt Support - 11/4/2013
View all notes |
Set NEW NOTE alert |
CANSLIM.net Company Profile |
SEC
News |
Chart |
Request a new note
C
A N
S L
I M
|
Symbol/Exchange
Company Name
Industry Group |
PRICE |
CHANGE
(%Change) |
Day High |
Volume
(% DAV)
(% 50 day avg vol) |
52 Wk Hi
% From Hi |
Featured
Date |
Price
Featured |
Pivot Featured |
|
Max Buy |
SFUN
-
NYSE
Soufun Hldgs Ltd Ads A
INTERNET - Internet Information Providers
|
$64.95
|
-0.55
-0.84% |
$66.20
|
455,906
30.57% of 50 DAV
50 DAV is 1,491,200
|
$71.62
-9.31%
|
10/17/2013
|
$58.02
|
PP = $53.87
|
|
MB = $56.56
|
Most Recent Note - 11/25/2013 1:34:48 PM
G - Pulling back from its all-time high with light volume behind today's loss. Volume totals have recently been cooling. Disciplined investors avoid chasing extended stocks. Prior highs in the $59 area define initial support to watch on pullbacks.
>>> FEATURED STOCK ARTICLE : Perched Near All-Time High After Testing Support - 11/8/2013
View all notes |
Set NEW NOTE alert |
CANSLIM.net Company Profile |
SEC
News |
Chart |
Request a new note
C
A N
S L
I M
|
SSNC
-
NASDAQ
S S & C Technologies
COMPUTER SOFTWARE and SERVICES - Application Software
|
$43.11
|
-0.22
-0.51% |
$43.62
|
100,244
24.68% of 50 DAV
50 DAV is 406,100
|
$43.63
-1.19%
|
10/22/2013
|
$39.17
|
PP = $40.04
|
|
MB = $42.04
|
Most Recent Note - 11/27/2013 6:38:18 PM
G - Color code is changed to green after rallying beyond its "max buy" level with gains backed by below average volume. Prior highs near $41 define initial support to watch above its 50 DMA line on pullbacks.
>>> FEATURED STOCK ARTICLE : Volume Totals Cooling Following Recent Volume-Driven Breakout - 11/12/2013
View all notes |
Set NEW NOTE alert |
CANSLIM.net Company Profile |
SEC
News |
Chart |
Request a new note
C
A N
S L
I M
|
SSYS
-
NASDAQ
Stratasys Ltd
COMPUTER HARDWARE - Computer Peripherals
|
$117.77
|
-0.80
-0.67% |
$119.75
|
386,041
32.01% of 50 DAV
50 DAV is 1,206,100
|
$134.00
-12.11%
|
10/11/2013
|
$102.94
|
PP = $105.38
|
|
MB = $110.65
|
Most Recent Note - 11/29/2013 2:52:53 PM
G - Consolidating above support at its 50 DMA line and prior highs with volume totals cooling. More damaging losses would raise greater concerns and trigger worrisome technical sell signals. Reported earnings +13% on +153% sales revenues, below the +25% minimum earnings guideline (C criteria) raising fundamental concerns.
>>> FEATURED STOCK ARTICLE : Rallying For New Highs Despite Fundamental Flaw Raising Concern - 11/18/2013
View all notes |
Set NEW NOTE alert |
CANSLIM.net Company Profile |
SEC
News |
Chart |
Request a new note
C
A N
S L
I M
|
STMP
-
NASDAQ
Stamps.Com Inc
INTERNET - Internet Software and Services
|
$46.07
|
+0.04
0.09% |
$46.68
|
83,308
75.05% of 50 DAV
50 DAV is 111,000
|
$49.40
-6.74%
|
9/24/2013
|
$45.54
|
PP = $46.57
|
|
MB = $48.90
|
Most Recent Note - 11/27/2013 5:44:22 PM
G - Slumped today with slightly higher than average volume, testing its 50 DMA line which recently acted as support. More damaging losses would raise greater concerns. Earnings were +24% on +7% sales revenues for the Sep '13 quarter, just below the +25% minimum earnings guideline (C criteria).
>>> FEATURED STOCK ARTICLE : Fundamental Flaw May Prompt Disciplined Investors to Look Elsewhere - 10/31/2013
View all notes |
Set NEW NOTE alert |
CANSLIM.net Company Profile |
SEC
News |
Chart |
Request a new note
C
A N
S L
I M
|
ULTI
-
NASDAQ
Ultimate Software Group
INTERNET - Internet Software and Services
|
$156.69
|
-0.24
-0.15% |
$157.82
|
67,967
45.89% of 50 DAV
50 DAV is 148,100
|
$162.88
-3.80%
|
10/16/2013
|
$142.95
|
PP = $151.18
|
|
MB = $158.74
|
Most Recent Note - 11/27/2013 6:34:35 PM
Y - Volume totals have still been cooling while holding its ground near its 52-week high yet below its "max buy" level. Prior highs and its 50 DMA line define near-term support near the $151 area.
>>> FEATURED STOCK ARTICLE : Consolidating Above 50 DMA Line and Prior Highs Defining Support - 11/21/2013
View all notes |
Set NEW NOTE alert |
CANSLIM.net Company Profile |
SEC
News |
Chart |
Request a new note
C
A N
S L
I M
|
Symbol/Exchange
Company Name
Industry Group |
PRICE |
CHANGE
(%Change) |
Day High |
Volume
(% DAV)
(% 50 day avg vol) |
52 Wk Hi
% From Hi |
Featured
Date |
Price
Featured |
Pivot Featured |
|
Max Buy |
VRX
-
NYSE
Valeant Pharmaceuticals
DRUGS - Drug Manufacturers - Other
|
$109.63
|
+1.28
1.18% |
$110.74
|
398,543
34.12% of 50 DAV
50 DAV is 1,167,900
|
$115.40
-5.00%
|
9/11/2013
|
$100.26
|
PP = $105.50
|
|
MB = $110.78
|
Most Recent Note - 11/27/2013 6:35:20 PM
Y - Still consolidating in a very tight range near its 50 DMA line with volume totals cooling. Recent lows in the $102 area define near-term support where subsequent violations may trigger technical sell signals. Recently reported earnings +24% on +74% sales revenues for the Sep '13 quarter, a notch below the +25% minimum guideline (C criteria).
>>> FEATURED STOCK ARTICLE : Recent Lows Define Support to Watch Below 50 Day Average - 11/15/2013
View all notes |
Set NEW NOTE alert |
CANSLIM.net Company Profile |
SEC
News |
Chart |
Request a new note
C
A N
S L
I M
|
YNDX
-
NASDAQ
Yandex N V Class A
INTERNET - Internet Information Providers
|
$39.75
|
+0.14
0.35% |
$40.47
|
944,293
36.03% of 50 DAV
50 DAV is 2,621,100
|
$42.00
-5.36%
|
11/27/2013
|
$39.61
|
PP = $42.10
|
|
MB = $44.21
|
Most Recent Note - 11/27/2013 6:27:05 PM
Y - Color code is changed to yellow with new pivot point cited based on its 10/22/13 high plus 10 cents. Subsequent volume-driven gains above the pivot point may trigger a new (or add-on) technical buy signal. Prior lows ($35.59 on 11/08/13 and $34.31 on 10/08/13) defines the next important chart support levels to watch. See the latest FSU analysis for more details and new annotated daily and weekly graphs.
>>> FEATURED STOCK ARTICLE : Forming New Base Pattern With Little Resistance Remaining - 11/27/2013
View all notes |
Set NEW NOTE alert |
CANSLIM.net Company Profile |
SEC
News |
Chart |
Request a new note
C
A N
S L
I M
|