You are not logged in.
This means you
CAN ONLY VIEW reports that were published prior to Thursday, March 20, 2025.
You
MUST UPGRADE YOUR MEMBERSHIP if you want to see any current reports.
AFTER MARKET UPDATE - FRIDAY, NOVEMBER 28TH, 2014
Previous After Market Report Next After Market Report >>>
|
|
|
|
DOW |
+0.49 |
17,828.24 |
+0.00% |
|
Volume |
635,717,500 |
-7% |
|
Volume |
916,367,410 |
-28% |
|
NASDAQ |
+4.31 |
4,791.63 |
+0.09% |
|
Advancers |
1,149 |
37% |
|
Advancers |
903 |
32% |
|
S&P 500 |
-5.27 |
2,067.56 |
-0.25% |
|
Decliners |
1,858 |
59% |
|
Decliners |
1,805 |
65% |
|
Russell 2000 |
-17.39 |
1,173.23 |
-1.46% |
|
52 Wk Highs |
322 |
|
|
52 Wk Highs |
176 |
|
|
S&P 600 |
-9.66 |
676.82 |
-1.41% |
|
52 Wk Lows |
168 |
|
|
52 Wk Lows |
89 |
|
|
 |
Major Averages Rallied Further on Shortened Session
Kenneth J. Gruneisen - Passed the CAN SLIM® Master's Exam
On Friday's shortened trading session the Dow rose less than a point but closed at a fresh record high of 17,828. The S&P 500 fell 5 points to 2,067. The NASDAQ Composite gained 4 points to 4,791. There were lighter volume totals on the NYSE and on the Nasdaq exchange. Decliners led advancers by a 3-2 margin on the NYSE and 2-1 on the Nasdaq exchange. There were 128 high-ranked companies from the CANSLIM.net Leaders List that made new 52-week highs and appeared on the CANSLIM.net BreakOuts Page, up from the prior session total of 65 stocks. New 52-week highs expanded and easily outnumbered new 52-week lows on the NYSE and on the Nasdaq exchange. There were gains for 5 of the 12 high-ranked companies currently on the Featured Stocks Page. A "confirmed uptrend" for the market (M criteria) has been repeatedly noted in this daily Market Commentary since large gains were noted on 10/21/14 backed by higher volume totals as leadership (stocks hitting new 52-week highs) expanded.
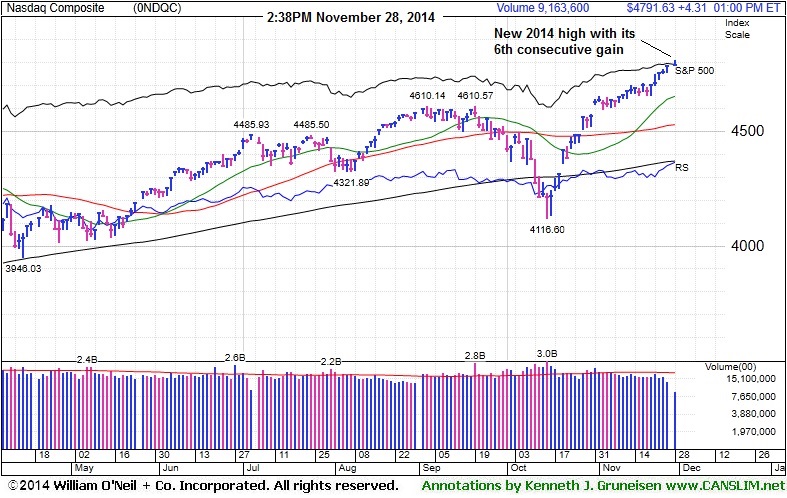
PICTURED: The Nasdaq Composite Index hit a new 2014 high with its 6th consecutive gain.
Seven of the 10 sectors in the S&P 500 advanced. Consumer stocks gained the most ground as Black Friday kicked off the holiday shopping season on a positive note. Wal-Mart (WMT +3%) and Amazon.com (AMZN +1.5%) rose. The more defensive sectors of telecom and utilities were also among the best performing groups. Duke Energy (DUK +1.5%) and Verizon (VZ +1%) rose. A drop in energy weighed on the market as OPEC's decision to leave its output target unchanged prompted WTI crude to fall -8.6% to a nine-year low of $67.33 a barrel. Exxon Mobil (XOM -4.5%) and Schlumberger (SLB -7.5%).
Treasuries were higher before fixed-income markets closed early at 2:00 p.m. ET. The 10-year note was up 17/32 to yield 2.18%
Disciplined investors know that new buying efforts may be made under the fact-based investment system only in stocks meeting all key criteria. The Featured Stocks Page shows the most action-worthy candidates and their latest notes and a Headline Link directs members to the latest detailed analysis with data-packed graphs annotated by a Certified expert along with links to additional resources. The Premium Member Homepage includes "dynamic archives" to all prior pay reports published.
|
 Kenneth J. Gruneisen started out as a licensed stockbroker in August 1987, a couple of months prior to the historic stock market crash that took the Dow Jones Industrial Average down -22.6% in a single day. He has published daily fact-based fundamental and technical analysis on high-ranked stocks online for two decades. Through FACTBASEDINVESTING.COM, Kenneth provides educational articles, news, market commentary, and other information regarding proven investment systems that work in good times and bad.
Comments contained in the body of this report are technical opinions only and are not necessarily those of Gruneisen Growth Corp. The material herein has been obtained from sources believed to be reliable and accurate, however, its accuracy and completeness cannot be guaranteed. Our firm, employees, and customers may effect transactions, including transactions contrary to any recommendation herein, or have positions in the securities mentioned herein or options with respect thereto. Any recommendation contained in this report may not be suitable for all investors and it is not to be deemed an offer or solicitation on our part with respect to the purchase or sale of any securities. |
|
 |
Retail Index Rose; Commodity-Linked Groups Fell Hard
Kenneth J. Gruneisen - Passed the CAN SLIM® Master's Exam
The Retail Index ($RLX +1.37%) was a standout gainer while commodity-linked groups created a drag on the market on Friday with big losses for the Oil Services Index ($OSX -8.48%), Integrated Oil Index ($XOI -7.28%) and the Gold & Silver Index ($XAU -8.11%). The Bank Index ($BKX -0.75%) and Broker/Dealer Index ($XBD -0.33%) both ended modestly lower. The Networking Index ($NWX -0.23%) edged lower and the Biotechnology Index ($BTK +0.05%) finished flat, yet the Semiconductor Index ($SOX +0.33%) posted a small gain.
Charts courtesy www.stockcharts.com
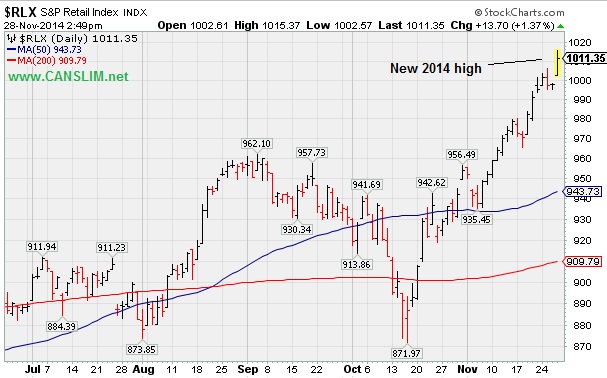
PICTURED: The Retail Index ($RLX +1.37%) hit a new 2014 high.
| Oil Services |
$OSX |
215.72 |
-20.00 |
-8.48% |
-23.24% |
| Integrated Oil |
$XOI |
1,335.90 |
-104.89 |
-7.28% |
-11.13% |
| Semiconductor |
$SOX |
685.74 |
+2.26 |
+0.33% |
+28.17% |
| Networking |
$NWX |
349.59 |
-0.82 |
-0.23% |
+7.92% |
| Broker/Dealer |
$XBD |
176.81 |
-0.59 |
-0.33% |
+10.12% |
| Retail |
$RLX |
1,011.35 |
+13.70 |
+1.37% |
+7.61% |
| Gold & Silver |
$XAU |
68.40 |
-6.04 |
-8.11% |
-18.72% |
| Bank |
$BKX |
72.68 |
-0.55 |
-0.75% |
+4.94% |
| Biotech |
$BTK |
3,437.72 |
+1.73 |
+0.05% |
+47.51% |
|
|
|
 |
Quietly Consolidating Near All-Time High
Kenneth J. Gruneisen - Passed the CAN SLIM® Master's Exam
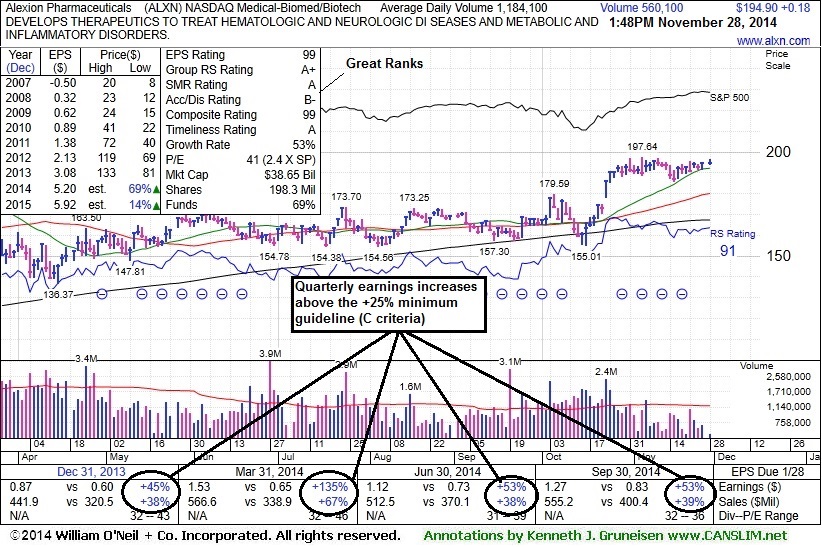
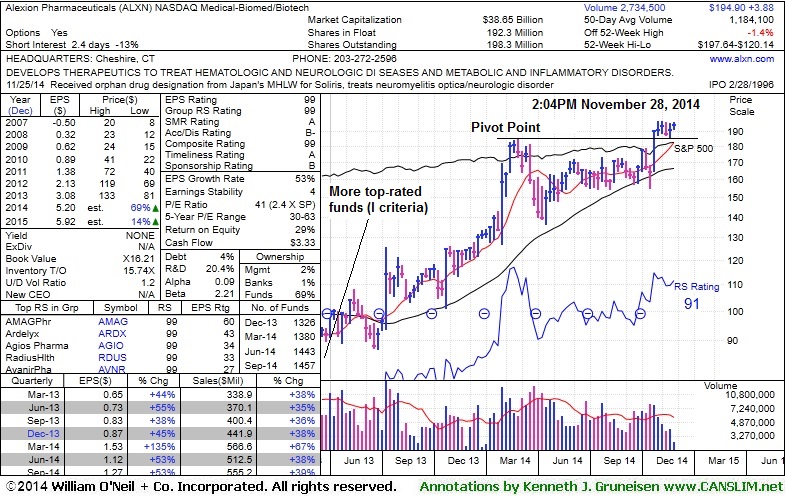
Alexion Pharmaceuticals Inc (ALXN +$0.18 or +0.09% to $194.90) is hovering just above its "max buy" level and perched only -1.4% off its 52-week and all-time highs. Disciplined investors avoid chasing stocks more than +5% above prior highs and always limit losses by selling any stock which falls more than -7% from its purchase price. Recent lows near $185 define initial support to watch above its 50-day moving average (DMA) line. It was last shown in this FSU section on 11/10/14 with annotated graphs under the headline, "New High Close With Gain on Light Volume", as it wedged higher for its best-ever close.
No resistance remains due to overhead supply. Prior highs in the $180 area define initial support to watch on pullbacks. It was highlighted in yellow with a pivot point based on its 2/25/14 high plus 10 cents in the 10/23/14 mid-day report (read here). The Medical - Biomed/Biotech industry group has demonstrated leadership and earned a 99 for its Group Relative Strength Rating, a reassuring sign concerning the L criteria. It reported earnings +53% on +38% sales revenues for the Sep '14 quarter, continuing its strong earnings history. Its Relative Strength Rank (93) remains high. It easily satisfies the C and A criteria with a very strong quarterly and annual earnings history which has earned it a highest possible 99 Earnings Per Share rank. The number of top-rated funds owning its shares rose from 1,325 in Dec '13 to 1,457 in Sep '14, a reassuring sign concerning the I criteria of the fact-based investment system. ALXN completed a new Public Offering on 5/25/12.
|
|
|
Color Codes Explained :
Y - Better candidates highlighted by our
staff of experts.
G - Previously featured
in past reports as yellow but may no longer be buyable under the
guidelines.
***Last / Change / Volume data in this table is the closing quote data***
Symbol/Exchange
Company Name
Industry Group |
PRICE |
CHANGE
(%Change) |
Day High |
Volume
(% DAV)
(% 50 day avg vol) |
52 Wk Hi
% From Hi |
Featured
Date |
Price
Featured |
Pivot Featured |
|
Max Buy |
ACT
-
NYSE
Actavis plc
Medical-Generic Drugs
|
$270.61
|
+0.14
0.05% |
$272.29
|
1,175,407
36.24% of 50 DAV
50 DAV is 3,243,000
|
$272.75
-0.78%
|
6/20/2014
|
$216.53
|
PP = $230.87
|
|
MB = $242.41
|
Most Recent Note - 11/24/2014 12:12:07 PM
G - Its 50 DMA line and prior highs define support where violations would raise concerns. Consolidating after spiking to new 52-week highs with volume-driven gains following news it plans to acquire Allergan (AGN) for $66 Billion. Did not form a sound base, and it is extended from prior highs.
>>> FEATURED STOCK ARTICLE : Perched at Highs Following Spike on Acquisition Plans - 11/24/2014
View all notes |
Set NEW NOTE alert |
CANSLIM.net Company Profile |
SEC
News |
Chart |
Request a new note
C
A N
S L
I M


|
AFSI
-
NASDAQ
Amtrust Financial Svcs
INSURANCE - Property and; Casualty Insurance
|
$51.32
|
-0.32
-0.62% |
$52.24
|
811,431
78.25% of 50 DAV
50 DAV is 1,037,000
|
$53.80
-4.61%
|
10/17/2014
|
$45.24
|
PP = $46.02
|
|
MB = $48.32
|
Most Recent Note - 11/26/2014 1:28:31 PM
G - Encountered distributional pressure yet it is still holding its ground near its 52-week high. Recent lows near $42 and its 50 DMA line define important near-term support.
>>> FEATURED STOCK ARTICLE : No Sound Base Formed, Yet Little Resistance Remains - 11/21/2014
View all notes |
Set NEW NOTE alert |
CANSLIM.net Company Profile |
SEC
News |
Chart |
Request a new note
C
A N
S L
I M
|
ALXN
-
NASDAQ
Alexion Pharmaceuticals
DRUGS - Drug Manufacturers - Other
|
$194.90
|
+0.18
0.09% |
$196.49
|
576,612
48.70% of 50 DAV
50 DAV is 1,184,000
|
$197.64
-1.39%
|
10/23/2014
|
$184.01
|
PP = $185.53
|
|
MB = $194.81
|
 Most Recent Note - 11/28/2014 2:13:55 PM
G - Color code is changed to green while quietly trading above its "max buy" level and near all-time highs. Recent lows near $185 define initial support to watch above its 50 DMA line. See the latest FSU analysis for more details and new annotated graphs.
>>> FEATURED STOCK ARTICLE : Quietly Consolidating Near All-Time High - 11/28/2014
View all notes |
Set NEW NOTE alert |
CANSLIM.net Company Profile |
SEC
News |
Chart |
Request a new note
C
A N
S L
I M
|
BIDU
-
NASDAQ
Baidu Inc Ads
INTERNET - Internet Information Providers
|
$245.11
|
-0.92
-0.37% |
$247.34
|
1,338,106
34.70% of 50 DAV
50 DAV is 3,856,000
|
$251.99
-2.73%
|
10/30/2014
|
$234.08
|
PP = $231.51
|
|
MB = $243.09
|
Most Recent Note - 11/26/2014 1:33:19 PM
G - Consolidating above its "max buy" level with recent volume totals cooling. Prior highs near $230 define near-term support to watch above its 50 DMA line.
>>> FEATURED STOCK ARTICLE : Consolidating Back Below "Max Buy" Level - 11/17/2014
View all notes |
Set NEW NOTE alert |
CANSLIM.net Company Profile |
SEC
News |
Chart |
Request a new note
C
A N
S L
I M
|
EPAM
-
NYSE
Epam Systems Inc
COMPUTER SOFTWARE and SERVICES - Information Technology Service
|
$51.03
|
+0.54
1.07% |
$52.29
|
271,484
63.88% of 50 DAV
50 DAV is 425,000
|
$50.50
1.05%
|
10/23/2014
|
$45.21
|
PP = $46.09
|
|
MB = $48.39
|
Most Recent Note - 11/25/2014 5:31:11 PM
G - Still stubbornly holding its ground above its "max buy" level with volume totals cooling. Prior highs in the $44 area defining initial support above its 50 DMA line.
>>> FEATURED STOCK ARTICLE : Quiet Gain For New High Close - 11/26/2014
View all notes |
Set NEW NOTE alert |
CANSLIM.net Company Profile |
SEC
News |
Chart |
Request a new note
C
A N
S L
I M
|
Symbol/Exchange
Company Name
Industry Group |
PRICE |
CHANGE
(%Change) |
Day High |
Volume
(% DAV)
(% 50 day avg vol) |
52 Wk Hi
% From Hi |
Featured
Date |
Price
Featured |
Pivot Featured |
|
Max Buy |
FB
-
NASDAQ
Facebook Inc Cl A
INTERNET
|
$77.70
|
+0.08
0.10% |
$78.27
|
15,973,502
42.17% of 50 DAV
50 DAV is 37,883,000
|
$81.16
-4.26%
|
9/9/2014
|
$76.67
|
PP = $76.84
|
|
MB = $80.68
|
Most Recent Note - 11/26/2014 1:25:21 PM
Y - It has not formed a sound base, yet its color code is changed to yellow after quietly rebounding above the 50 DMA line helping its outlook to improve.
>>> FEATURED STOCK ARTICLE : Following Violation 50-Day Average Acted as Resistance - 11/14/2014
View all notes |
Set NEW NOTE alert |
CANSLIM.net Company Profile |
SEC
News |
Chart |
Request a new note
C
A N
S L
I M
|
FLT
-
NYSE
Fleetcor Technologies
DIVERSIFIED SERVICES - Business/Management Services
|
$151.89
|
-3.32
-2.14% |
$156.38
|
461,662
62.64% of 50 DAV
50 DAV is 737,000
|
$160.40
-5.31%
|
10/31/2014
|
$148.50
|
PP = $146.29
|
|
MB = $153.60
|
Most Recent Note - 11/25/2014 5:34:51 PM
G - Holding its ground above its "max buy level" following recent volume-driven gains. Prior highs in the $146-149 area define initial support to watch on pullbacks.
>>> FEATURED STOCK ARTICLE : Consolidation Continues Above Prior Highs - 11/18/2014
View all notes |
Set NEW NOTE alert |
CANSLIM.net Company Profile |
SEC
News |
Chart |
Request a new note
C
A N
S L
I M
|
ILMN
-
NASDAQ
Illumina Inc
DRUGS - Biotechnology
|
$190.89
|
-1.01
-0.53% |
$192.87
|
626,258
49.78% of 50 DAV
50 DAV is 1,258,000
|
$197.37
-3.28%
|
10/22/2014
|
$188.77
|
PP = $182.27
|
|
MB = $191.38
|
Most Recent Note - 11/25/2014 5:28:23 PM
Y - Encountered distributional pressure today while consolidating well above prior highs near $182 and above its 50 DMA line. Damaging losses below those levels would raise concerns and trigger technical sell signals. See the latest FSU analysis for more details and new annotated graphs.
>>> FEATURED STOCK ARTICLE : Quietly Consolidating Back Below "Max Buy" Level - 11/25/2014
View all notes |
Set NEW NOTE alert |
CANSLIM.net Company Profile |
SEC
News |
Chart |
Request a new note
C
A N
S L
I M
|
NBCB
-
NASDAQ
First N B C Bank Hldg
Banks-Southeast
|
$36.40
|
-0.93
-2.49% |
$37.35
|
32,269
39.84% of 50 DAV
50 DAV is 81,000
|
$38.18
-4.66%
|
10/31/2014
|
$36.31
|
PP = $35.93
|
|
MB = $37.73
|
Most Recent Note - 11/25/2014 12:38:53 PM
Y - Trading below its "max buy" level today following a volume-driven gain on the prior session. Prior highs near $34 define near-term support to watch on pullbacks.
>>> FEATURED STOCK ARTICLE : Fifth Consecutive Loss While Retreating From Highs - 11/19/2014
View all notes |
Set NEW NOTE alert |
CANSLIM.net Company Profile |
SEC
News |
Chart |
Request a new note
C
A N
S L
I M
|
PANW
-
NYSE
Palo Alto Networks
Computer Sftwr-Security
|
$123.00
|
+2.40
1.99% |
$123.22
|
966,724
48.05% of 50 DAV
50 DAV is 2,012,000
|
$120.70
1.91%
|
7/30/2014
|
$84.21
|
PP = $85.88
|
|
MB = $90.17
|
Most Recent Note - 11/25/2014 12:43:43 PM
G - Hitting new all-time highs with today's 2nd consecutive volume-driven gain. It did not form a sound base, and the 50 DMA line defines near-term support to watch. Reported earnings +88% on +50% sales revenues for the Oct '14 quarter.
>>> FEATURED STOCK ARTICLE : Finished Near Session Low With Small Gain on Light Volume - 11/13/2014
View all notes |
Set NEW NOTE alert |
CANSLIM.net Company Profile |
SEC
News |
Chart |
Request a new note
C
A N
S L
I M
|
Symbol/Exchange
Company Name
Industry Group |
PRICE |
CHANGE
(%Change) |
Day High |
Volume
(% DAV)
(% 50 day avg vol) |
52 Wk Hi
% From Hi |
Featured
Date |
Price
Featured |
Pivot Featured |
|
Max Buy |
SNCR
-
NASDAQ
Synchronoss Technologies
COMPUTER SOFTWARE andamp; SERVICES - Application Software
|
$42.83
|
-1.04
-2.37% |
$44.17
|
342,300
51.71% of 50 DAV
50 DAV is 662,000
|
$54.05
-20.76%
|
10/27/2014
|
$46.40
|
PP = $47.81
|
|
MB = $50.20
|
Most Recent Note - 11/24/2014 1:01:51 PM
G - Halted its slide but remains below its 50 DMA line following a damaging volume-driven loss that triggered a technical sell signal. Prior lows in the $41 area acted as support, but a rebound above the 50 DMA line is needed for its outlook to improve.
>>> FEATURED STOCK ARTICLE : Loss on Heavy Volume a Sign of Distributional Pressure - 11/12/2014
View all notes |
Set NEW NOTE alert |
CANSLIM.net Company Profile |
SEC
News |
Chart |
Request a new note
C
A N
S L
I M
|
STRT
-
NASDAQ
Strattec Security Corp
AUTOMOTIVE - Auto Parts
|
$103.76
|
-1.15
-1.10% |
$106.76
|
7,337
28.22% of 50 DAV
50 DAV is 26,000
|
$110.96
-6.49%
|
11/20/2014
|
$105.76
|
PP = $109.54
|
|
MB = $115.02
|
Most Recent Note - 11/25/2014 5:36:40 PM
Y - Hovering near its all-time high after forming an advanced "3-weeks tight" base. Volume-driven gains for new highs may trigger a new (or add-on) technical buy signal. Prior highs coincide with its 50 DMA line defining important near-term support to watch on pullbacks.
>>> FEATURED STOCK ARTICLE : Formed New Advanced "3-Weeks Tight" Base - 11/20/2014
View all notes |
Set NEW NOTE alert |
CANSLIM.net Company Profile |
SEC
News |
Chart |
Request a new note
C
A N
S L
I M
|
|
|
|
THESE ARE NOT BUY RECOMMENDATIONS!
Comments contained in the body of this report are technical
opinions only. The material herein has been obtained
from sources believed to be reliable and accurate, however,
its accuracy and completeness cannot be guaranteed.
This site is not an investment advisor, hence it does
not endorse or recommend any securities or other investments.
Any recommendation contained in this report may not
be suitable for all investors and it is not to be deemed
an offer or solicitation on our part with respect to
the purchase or sale of any securities. All trademarks,
service marks and trade names appearing in this report
are the property of their respective owners, and are
likewise used for identification purposes only.
This report is a service available
only to active Paid Premium Members.
You may opt-out of receiving report notifications
at any time. Questions or comments may be submitted
by writing to Premium Membership Services 665 S.E. 10 Street, Suite 201 Deerfield Beach, FL 33441-5634 or by calling 1-800-965-8307
or 954-785-1121.
|
|
|

