You are not logged in.
This means you
CAN ONLY VIEW reports that were published prior to Monday, April 14, 2025.
You
MUST UPGRADE YOUR MEMBERSHIP if you want to see any current reports.
AFTER MARKET UPDATE - TUESDAY, NOVEMBER 27TH, 2012
Previous After Market Report Next After Market Report >>>
|
|
|
|
DOW |
-89.24 |
12,878.13 |
-0.69% |
|
Volume |
689,389,200 |
+9% |
|
Volume |
1,688,572,090 |
+9% |
|
NASDAQ |
-8.99 |
2,967.79 |
-0.30% |
|
Advancers |
1,339 |
42% |
|
Advancers |
1,114 |
43% |
|
S&P 500 |
-7.35 |
1,398.94 |
-0.52% |
|
Decliners |
1,711 |
54% |
|
Decliners |
1,342 |
52% |
|
Russell 2000 |
-1.28 |
807.74 |
-0.16% |
|
52 Wk Highs |
98 |
|
|
52 Wk Highs |
56 |
|
|
S&P 600 |
-0.22 |
455.75 |
-0.05% |
|
52 Wk Lows |
13 |
|
|
52 Wk Lows |
27 |
|
|
 |
Indices Encountering Distributional Pressure Early in Nascent Rally
Kenneth J. Gruneisen - Passed the CAN SLIM® Master's Exam
On Tuesday the major averages slumped again and ended near their worst levels of the session. Volume totals were reported higher than the prior session totals on both the NYSE and on the Nasdaq exchange marking a distribution day very early in the nascent rally. Decliners led advancers by nearly a 3-2 margin on the NYSE, meanwhile decliners led advancers by a narrower margin on the Nasdaq exchange. The total number of stocks hitting new 52-week highs outnumbered new 52-week lows for the 3rd consecutive session on both the NYSE and the Nasdaq exchange. Leadership was fair as there were 50 high-ranked companies from the CANSLIM.net Leaders List making new 52-week highs and appearing on the CANSLIM.net BreakOuts Page, up from the prior session total of 47 stocks. Meanwhile, there were gains for only 4 of the 11 high-ranked companies currently included on the Featured Stocks Page.
The market found no motivation to rally while investors digested mixed economic reports amid ongoing concerns over the fiscal cliff. Stocks traded in a narrow range throughout the session before decisively moving lower in the final hour of trading. Looking at the data, October durable goods orders showed no improvement and the Case-Shiller Index showed the expected +0.4% increase in home prices. On the upside, consumer confidence rose more than projected in the November reading.
Nine of the 10 sectors on the S&P ended the day lower after most had tallied early gains. Among the leading declines were the financials as shares of Bank of America Corp (BAC -1.78%) and Citigroup Inc (C -1.49%) fell. Energy stocks also showed weakness with Exxon Mobil Corp (XOM -1.43%) ended lower. On the earnings front, The ADT Corp (ADT +1.09%) rose after the company topped analysts' expectations and announced a $2 billion share repurchasing program. On the M&A front, Ralcorp Holdings Inc (RAH +26.44%) gapped up on news that the company was being acquired by ConAgra Foods Inc (CAG +4.74%) for $90 per share in cash.
Fiscal cliff concerns were renewed after Senator Harry Reid said little progress had been made in discussions to avert $600 billion in tax increases and spending cuts. Despite the bearish tone, the Senate Majority Leader said he was hopeful that Republicans wouldn't allow the fiscal cliff to occur.
Turning to fixed income markets, Treasuries were higher along the curve with the benchmark 10-year note up 1/4 of a point to yield 1.65%.
The market direction (M criteria) has shifted to a "confirmed uptrend" following Friday's gain of +1.4% by the Nasdaq Composite Index. The gain was recognized as a "follow-through day" on Day 5 of the rally attempt while writers for the newspaper stated that it was sufficient that the abbreviated session's volume was running at a higher pace. New buying efforts may now be justified in worthy high-ranked leaders as a result of last week's constructive gains coupled with healthy leadership and a respectable number of stocks hitting new 52-week highs. See the noteworthy companies included on the Featured Stocks Page.
Watch for an announcement via email concerning the next WEBCAST. The webcast will also be available via an updated link highlighted at the top of the Premium Member Homepage.
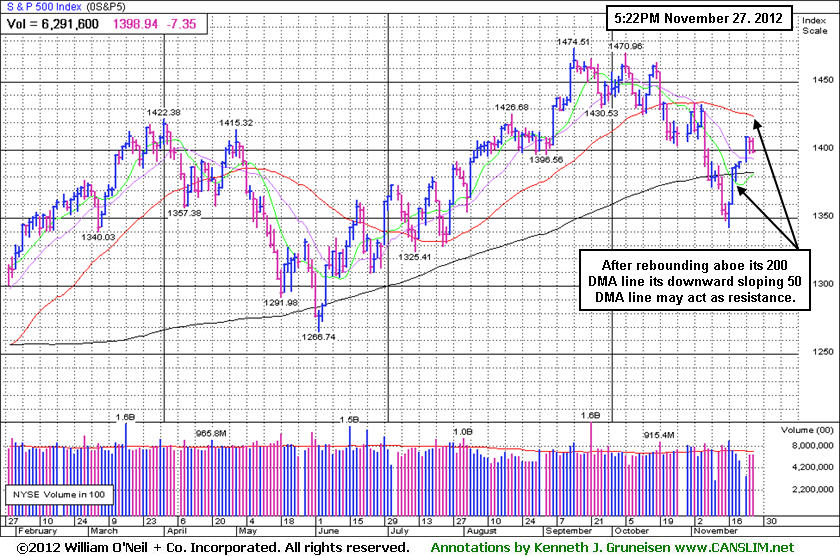
PICTURED: The S&P 500 Index recently rebounded back above its 200-day moving average (DMA) line. Its downward sloping 50 DMA line may now act as a resistance level. Distributional action so soon after the major averages produced a new confirmed rally with a "follow-through day" is cause for some concern, especially since the Nasdaq Composite Index and Dow Industrial Average (not shown) both ran into resistance near their 200 DMA line and they each remain below their respective long-term averages.
|
 Kenneth J. Gruneisen started out as a licensed stockbroker in August 1987, a couple of months prior to the historic stock market crash that took the Dow Jones Industrial Average down -22.6% in a single day. He has published daily fact-based fundamental and technical analysis on high-ranked stocks online for two decades. Through FACTBASEDINVESTING.COM, Kenneth provides educational articles, news, market commentary, and other information regarding proven investment systems that work in good times and bad.
Comments contained in the body of this report are technical opinions only and are not necessarily those of Gruneisen Growth Corp. The material herein has been obtained from sources believed to be reliable and accurate, however, its accuracy and completeness cannot be guaranteed. Our firm, employees, and customers may effect transactions, including transactions contrary to any recommendation herein, or have positions in the securities mentioned herein or options with respect thereto. Any recommendation contained in this report may not be suitable for all investors and it is not to be deemed an offer or solicitation on our part with respect to the purchase or sale of any securities. |
|
 |
Defensive, Energy, and Most Tech Groups Fell
Kenneth J. Gruneisen - Passed the CAN SLIM® Master's Exam
Defensive groups gave cautious investors no reward as the Gold & Silver Index ($XAU -2.18%) and the Healthcare Index ($HMO -1.23%) fell harder than other groups on Tuesday. The Integrated Oil Index ($XOI -0.90%) and the Oil Services Index ($OSX -0.76%) edged lower. The Retail Index ($RLX -0.40%) also had a negative bias, and the Biotechnology Index ($BTK -0.79%), Internet Index ($IIX -0.68%), and Semiconductor Index ($SOX -0.22%) ended with small losses. A small gain from the Networking Index ($NWX +0.35%) and a tiny gain for the Broker/Dealer Index ($XBD +0.09%) made them standouts.
Charts courtesy www.stockcharts.com
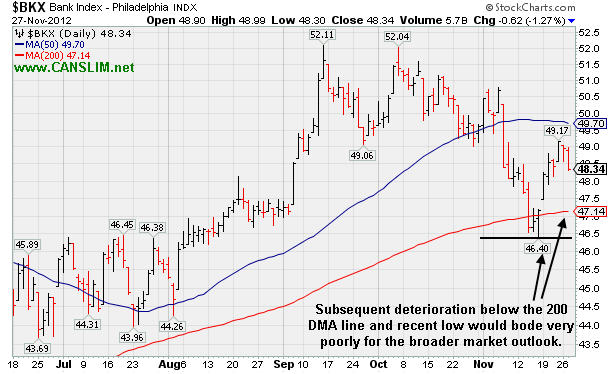
PICTURED: The Bank Index ($BKX -1.27%) pulled back for a second consecutive session. Subsequent deterioration below its 200-day moving average (DMA) line and the recent low would bode very poorly for the broader market outlook.
| Oil Services |
$OSX |
214.57 |
-1.64 |
-0.76% |
-0.79% |
| Healthcare |
$HMO |
2,448.88 |
-30.38 |
-1.23% |
+7.33% |
| Integrated Oil |
$XOI |
1,202.00 |
-10.93 |
-0.90% |
-2.21% |
| Semiconductor |
$SOX |
369.81 |
-0.82 |
-0.22% |
+1.47% |
| Networking |
$NWX |
206.71 |
+0.72 |
+0.35% |
-3.93% |
| Internet |
$IIX |
314.78 |
-2.15 |
-0.68% |
+11.73% |
| Broker/Dealer |
$XBD |
85.10 |
+0.08 |
+0.09% |
+2.20% |
| Retail |
$RLX |
666.28 |
-2.69 |
-0.40% |
+27.35% |
| Gold & Silver |
$XAU |
170.20 |
-3.79 |
-2.18% |
-5.78% |
| Bank |
$BKX |
48.34 |
-0.62 |
-1.27% |
+22.75% |
| Biotech |
$BTK |
1,515.80 |
-12.10 |
-0.79% |
+38.88% |
|
|
|
 |
Set-Up Awaiting Confirming Gains Above New Pivot Point
Kenneth J. Gruneisen - Passed the CAN SLIM® Master's Exam
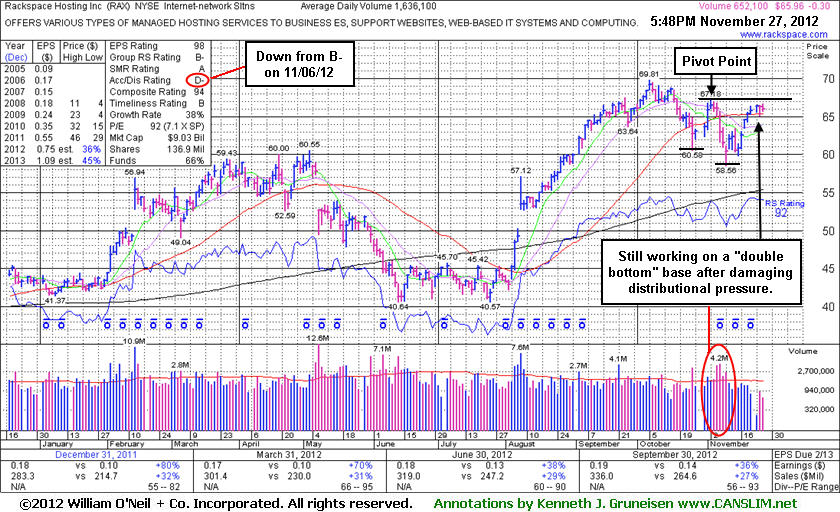
Rackspace Hosting Inc (RAX -$0.30 or -0.45% to $65.96) is quietly consolidating after rebounding just above its 50-day moving average (DMA) line. Its color code was recently changed to yellow while working on a "double bottom" base with new pivot point cited based on its 11/02/12 high. A subsequent volume-driven gain above its pivot point may trigger a new technical buy signal. The M criteria improved with recent confirming gains marking the start of a new rally for the broader market, however it makes sense to wait and watch for proof of fresh institutional buying demand to trigger a proper technical buy signal rather than jumping in "early". Its Accumulation/Distribution Rating has slumped from B- to a D- (see red circle) since last shown in this FSU section on 11/06/12 with an annotated graph under the headline, "Resilient Tech Firm Posted Good Earnings After Close". There is no assurance that it will go on to produce great gains, but volume-driven gains above the pivot would be a convincing sign that it may be capable of a more substantial rally in the weeks and months ahead.
RAX found support near prior highs in the $60 area recently after undercutting its 50 DMA line more substantially. It reported earnings +36% on +27% sales revenues for the quarter ended September 30, 2012 versus the year ago period and its fundamentals remain strong. The past 11 quarterly earnings comparisons have shown better than +25% increases. Its annual earnings history (A criteria) since trading began in 2008 has been good. Increasing institutional ownership (I criteria) is a reassuring sign, as the number of top-rated funds owning its shares rose from 408 in Dec '10 to 634 in Sep '12. A recent streak of 10 consecutive weekly gains helped it rebound impressively from below its 200 DMA line following a deep consolidation since dropped from the Featured Stocks list on 5/14/12.
|
|
|
Color Codes Explained :
Y - Better candidates highlighted by our
staff of experts.
G - Previously featured
in past reports as yellow but may no longer be buyable under the
guidelines.
***Last / Change / Volume data in this table is the closing quote data***
Symbol/Exchange
Company Name
Industry Group |
PRICE |
CHANGE
(%Change) |
Day High |
Volume
(% DAV)
(% 50 day avg vol) |
52 Wk Hi
% From Hi |
Featured
Date |
Price
Featured |
Pivot Featured |
|
Max Buy |
CFNL
-
NASDAQ
Cardinal Financial Corp
BANKING - Regional - Southeast Banks
|
$15.07
|
-0.03
-0.20% |
$15.22
|
311,311
192.64% of 50 DAV
50 DAV is 161,600
|
$16.21
-7.03%
|
8/17/2012
|
$12.84
|
PP = $13.31
|
|
MB = $13.98
|
 Most Recent Note - 11/27/2012 11:58:27 AM
G - It remains extended from its prior base, consolidating, and above average volume in recent weeks without meaningful upward price progress has been noted as a sign of distributional pressure. Prior highs and its 50 DMA line define near-term chart support to watch.
>>> The latest Featured Stock Update with an annotated graph appeared on 11/20/2012. Click here.
View all notes |
Alert me of new notes |
CANSLIM.net Company Profile |
SEC |
Zacks Reports |
StockTalk |
News |
Chart |
Request a new note
C
A N
S L
I M


|
CMCSA
-
NASDAQ
Comcast Corp Cl A
MEDIA - CATV Systems
|
$36.29
|
-0.34
-0.93% |
$36.65
|
8,589,095
68.73% of 50 DAV
50 DAV is 12,497,100
|
$37.96
-4.40%
|
6/11/2012
|
$29.94
|
PP = $30.98
|
|
MB = $32.53
|
Most Recent Note - 11/26/2012 5:51:11 PM
G - Consolidating above its 50 DMA line, however its latest consolidation is too brief to be considered a sound new base pattern.
>>> The latest Featured Stock Update with an annotated graph appeared on 11/19/2012. Click here.
View all notes |
Alert me of new notes |
CANSLIM.net Company Profile |
SEC |
Zacks Reports |
StockTalk |
News |
Chart |
Request a new note
C
A N
S L
I M
|
DVA
-
NYSE
Davita Healthcare Prtns
HEALTH SERVICES - Specialized Health Services
|
$109.29
|
-0.71
-0.65% |
$110.42
|
2,327,071
258.65% of 50 DAV
50 DAV is 899,700
|
$116.50
-6.19%
|
9/5/2012
|
$102.92
|
PP = $100.62
|
|
MB = $105.65
|
Most Recent Note - 11/27/2012 11:17:34 AM
G - Consolidating -6.4% off its 52-week high and near its 50 DMA line today. Fundamental concerns were raised after it reported earnings +3% on +12% sales for the Sep '12 quarter, below the guidelines of the fact-based system.
>>> The latest Featured Stock Update with an annotated graph appeared on 11/8/2012. Click here.
View all notes |
Alert me of new notes |
CANSLIM.net Company Profile |
SEC |
Zacks Reports |
StockTalk |
News |
Chart |
Request a new note
C
A N
S L
I M
|
GPX
-
NYSE
G P Strategies Corp
DIVERSIFIED SERVICES - Education and Training Services
|
$20.41
|
-0.33
-1.59% |
$20.75
|
33,508
55.66% of 50 DAV
50 DAV is 60,200
|
$21.44
-4.80%
|
10/8/2012
|
$20.00
|
PP = $20.77
|
|
MB = $21.81
|
Most Recent Note - 11/27/2012 11:18:41 AM
G - Still holding its ground stubbornly with volume totals cooling while hovering near its 52-week high. Earnings +0% on +12% sales revenues for the Sep '12 quarter, below the +25% minimum earnings guideline (C criteria) raised fundamental concerns. Deterioration leading to a close below its old high close ($20.27 on 8/17/12) would negate the recent technical breakout, and a violation of its 50 DMA line would be a more worrisome sell signal.
>>> The latest Featured Stock Update with an annotated graph appeared on 11/15/2012. Click here.
View all notes |
Alert me of new notes |
CANSLIM.net Company Profile |
SEC |
Zacks Reports |
StockTalk |
News |
Chart |
Request a new note
C
A N
S L
I M
|
LKQ
-
NASDAQ
L K Q Corp
WHOLESALE - Auto Parts
|
$21.50
|
-0.13
-0.58% |
$22.13
|
7,699,618
431.40% of 50 DAV
50 DAV is 1,784,800
|
$22.29
-3.52%
|
8/9/2012
|
$18.97
|
PP = $18.72
|
|
MB = $19.66
|
Most Recent Note - 11/27/2012 12:13:09 PM
G - Holding its ground near its 52-week high today following a worrisome "negative reversal" and finish near the session low with a loss on above average volume. Results below the +25% minimum earnings guideline (C criteria) for Sep '12 recently raised fundamental concerns.
>>> The latest Featured Stock Update with an annotated graph appeared on 11/14/2012. Click here.
View all notes |
Alert me of new notes |
CANSLIM.net Company Profile |
SEC |
Zacks Reports |
StockTalk |
News |
Chart |
Request a new note
C
A N
S L
I M
|
Symbol/Exchange
Company Name
Industry Group |
PRICE |
CHANGE
(%Change) |
Day High |
Volume
(% DAV)
(% 50 day avg vol) |
52 Wk Hi
% From Hi |
Featured
Date |
Price
Featured |
Pivot Featured |
|
Max Buy |
MIDD
-
NASDAQ
Middleby Corp
MANUFACTURING - Diversified Machinery
|
$127.73
|
+1.24
0.98% |
$128.83
|
85,254
117.92% of 50 DAV
50 DAV is 72,300
|
$128.96
-0.96%
|
10/8/2012
|
$118.46
|
PP = $122.67
|
|
MB = $128.80
|
Most Recent Note - 11/26/2012 5:55:09 PM
Y - Consolidating in a tight trading range near its all-time high. Recently reported earnings +23% on +18% sales for the Sep '12 quarter, below the +25% minimum earnings guideline (C criteria), raising fundamental concerns.
>>> The latest Featured Stock Update with an annotated graph appeared on 11/16/2012. Click here.
View all notes |
Alert me of new notes |
CANSLIM.net Company Profile |
SEC |
Zacks Reports |
StockTalk |
News |
Chart |
Request a new note
C
A N
S L
I M
|
RAX
-
NYSE
Rackspace Hosting Inc
INTERNET - Internet Software and; Services
|
$65.96
|
-0.30
-0.45% |
$66.65
|
652,580
39.89% of 50 DAV
50 DAV is 1,636,100
|
$69.81
-5.51%
|
11/26/2012
|
$66.26
|
PP = $67.18
|
|
MB = $70.54
|
Most Recent Note - 11/27/2012 6:13:40 PM
Y - Quietly consolidating just above its 50 DMA line and its color code was changed to yellow while working on a "double bottom" base with new pivot point cited based on its 11/02/12 high. See latest FSU analysis for more details and a new annotated graph.
>>> The latest Featured Stock Update with an annotated graph appeared on 11/27/2012. Click here.
View all notes |
Alert me of new notes |
CANSLIM.net Company Profile |
SEC |
Zacks Reports |
StockTalk |
News |
Chart |
Request a new note
C
A N
S L
I M
|
RGR
-
NYSE
Sturm Ruger & Co Inc
CONSUMER DURABLES - Sporting Goods
|
$56.99
|
+1.98
3.60% |
$57.21
|
759,685
176.22% of 50 DAV
50 DAV is 431,100
|
$58.42
-2.45%
|
11/20/2012
|
$52.23
|
PP = $52.65
|
|
MB = $55.28
|
Most Recent Note - 11/26/2012 12:45:20 PM
Y - Reversed into the red after trading up beyond its "max buy" level earlier. Rallied and closed above its pivot point on the prior session with +75% above average volume behind its gain while breaking out of a cup-with-handle base. Faces little resistance up through the $58 level. The M criteria has shifted to a "confirmed uptrend" following Friday's gain of +1.4% by the Nasdaq Composite Index, recognized as a follow-through day while writers for the newspaper stated that the abbreviated session's volume was running at a higher pace.
>>> The latest Featured Stock Update with an annotated graph appeared on 11/21/2012. Click here.
View all notes |
Alert me of new notes |
CANSLIM.net Company Profile |
SEC |
Zacks Reports |
StockTalk |
News |
Chart |
Request a new note
C
A N
S L
I M
|
RNF
-
NYSE
Rentech Nitrogen Ptnr Lp
CHEMICALS - Agricultural Chemicals
|
$38.65
|
+0.16
0.42% |
$38.97
|
202,424
51.12% of 50 DAV
50 DAV is 396,000
|
$41.15
-6.08%
|
11/1/2012
|
$39.11
|
PP = $40.15
|
|
MB = $42.16
|
Most Recent Note - 11/26/2012 7:12:48 PM
Y - Color code is changed to yellow while no new pivot point is cited, yet subsequent volume driven gains for a new high close may trigger a technical buy signal. Rebounded above its 50 DMA line following the previously noted "negative reversal", and an improving market environment (M criteria) is an encouraging sign. See the latest FSU analysis for more details and a new annotated graph.
>>> The latest Featured Stock Update with an annotated graph appeared on 11/26/2012. Click here.
View all notes |
Alert me of new notes |
CANSLIM.net Company Profile |
SEC |
Zacks Reports |
StockTalk |
News |
Chart |
Request a new note
C
A N
S L
I M
|
VSI
-
NYSE
Vitamin Shoppe Inc
SPECIALTY RETAIL - Specialty Retail, Other
|
$58.56
|
-0.58
-0.98% |
$59.42
|
145,551
57.87% of 50 DAV
50 DAV is 251,500
|
$61.89
-5.38%
|
10/15/2012
|
$57.82
|
PP = $60.08
|
|
MB = $63.08
|
Most Recent Note - 11/23/2012 3:43:35 PM
Y -Posted a gain today with light volume for its 3rd best close. The $61 area has been a stubborn resistance level in recent months. It released better than expected earnings +35% on +14% sales revenues for the Sep '12 quarter.
>>> The latest Featured Stock Update with an annotated graph appeared on 11/12/2012. Click here.
View all notes |
Alert me of new notes |
CANSLIM.net Company Profile |
SEC |
Zacks Reports |
StockTalk |
News |
Chart |
Request a new note
C
A N
S L
I M
|
Symbol/Exchange
Company Name
Industry Group |
PRICE |
CHANGE
(%Change) |
Day High |
Volume
(% DAV)
(% 50 day avg vol) |
52 Wk Hi
% From Hi |
Featured
Date |
Price
Featured |
Pivot Featured |
|
Max Buy |
WPI
-
NYSE
Watson Pharmaceuticals
DRUGS - Drugs - Generic
|
$87.53
|
+1.04
1.20% |
$87.70
|
957,042
119.84% of 50 DAV
50 DAV is 798,600
|
$90.00
-2.74%
|
8/24/2012
|
$82.90
|
PP = $81.10
|
|
MB = $85.16
|
Most Recent Note - 11/23/2012 3:44:41 PM
G - Wedged above its 50 DMA line today. See the latest FSU analysis for more details and a new annotated graph.
>>> The latest Featured Stock Update with an annotated graph appeared on 11/23/2012. Click here.
View all notes |
Alert me of new notes |
CANSLIM.net Company Profile |
SEC |
Zacks Reports |
StockTalk |
News |
Chart |
Request a new note
C
A N
S L
I M
|
|
|
|
THESE ARE NOT BUY RECOMMENDATIONS!
Comments contained in the body of this report are technical
opinions only. The material herein has been obtained
from sources believed to be reliable and accurate, however,
its accuracy and completeness cannot be guaranteed.
This site is not an investment advisor, hence it does
not endorse or recommend any securities or other investments.
Any recommendation contained in this report may not
be suitable for all investors and it is not to be deemed
an offer or solicitation on our part with respect to
the purchase or sale of any securities. All trademarks,
service marks and trade names appearing in this report
are the property of their respective owners, and are
likewise used for identification purposes only.
This report is a service available
only to active Paid Premium Members.
You may opt-out of receiving report notifications
at any time. Questions or comments may be submitted
by writing to Premium Membership Services 665 S.E. 10 Street, Suite 201 Deerfield Beach, FL 33441-5634 or by calling 1-800-965-8307
or 954-785-1121.
|
|
|

