You are not logged in.
This means you
CAN ONLY VIEW reports that were published prior to Monday, April 14, 2025.
You
MUST UPGRADE YOUR MEMBERSHIP if you want to see any current reports.
AFTER MARKET UPDATE - FRIDAY, NOVEMBER 27TH, 2009
Previous After Market Report Next After Market Report >>>
|
|
|
|
DOW |
-154.48 |
10,309.92 |
-1.48% |
|
Volume |
654,825,610 |
-18% |
|
Volume |
986,556,260 |
-31% |
|
NASDAQ |
-37.61 |
2,138.44 |
-1.73% |
|
Advancers |
425 |
14% |
|
Advancers |
481 |
17% |
|
S&P 500 |
-19.14 |
1,091.49 |
-1.72% |
|
Decliners |
2,528 |
84% |
|
Decliners |
2,156 |
78% |
|
Russell 2000 |
-14.98 |
577.21 |
-2.53% |
|
52 Wk Highs |
36 |
|
|
52 Wk Highs |
35 |
|
|
S&P 600 |
-7.39 |
305.38 |
-2.36% |
|
52 Wk Lows |
13 |
|
|
52 Wk Lows |
29 |
|
|
 |
Black Friday's Shortened Trading Session Ends Clearly In Red
Adam Sarhan, Contributing Writer,
Stocks plunged around the world on Thursday as the US took off in observance of the Thanksgiving day holiday. On Friday stocks sold off as investors unloaded their positions ahead of the the weekend. Decliners outnumbered advancers by nearly 6-to-1 on the NYSE and by more than 4-to-1 on the Nasdaq exchange. Volume totals were lighter than average, which was expected due to the holiday-shortened trading session's 1PM close.
The catalyst which shocked the world was when Dubai World, the most indebted of Dubai’s state-sponsored companies, had trouble restructuring their debt. The company currently owes $60 billion of which $22 billion must be refinanced by 2011. The fact that Dubai World is struggling with their existing obligations led many to question how other, less solvent, emerging market companies will fare. Since March emerging markets have enjoyed some of the largest gains as the global economy recovers from the worst financial crisis since the great depression.
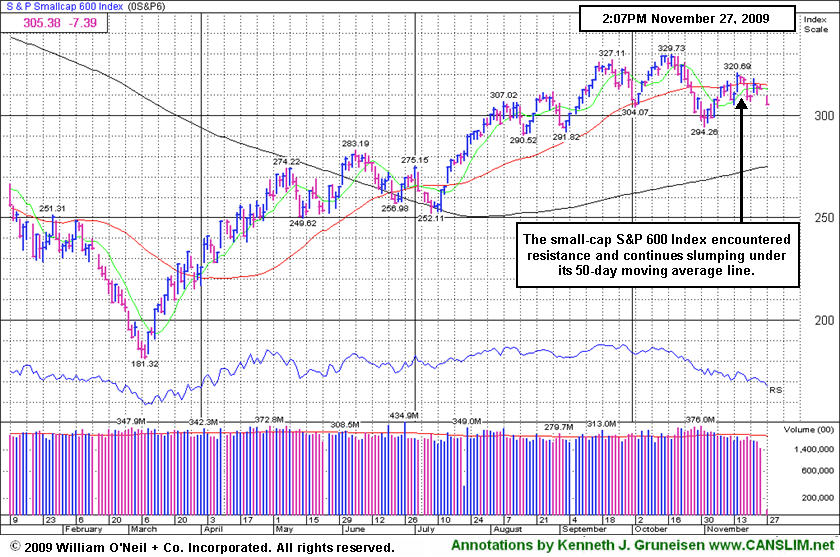
From our perspective, the current rally is under pressure as investors struggle for direction. Leadership has narrowed considerably in recent weeks as the major averages edge higher on lighter volume. It is also worrisome to see the small-cap Russell 2000 and S&P 600 indexes continue to woefully under perform their peers. The one saving grace has been the weak dollar. This column has repeatedly mentioned the inverse relationship between the US dollar and dollar denominated assets (i.e. stocks and commodities). This relationship remains critical as this rally continues.
PICTURED: The Small Cap S&P 600 Index has encountered resistance and struggled below its 50-day moving average line.
|
|
|
 |
Commodity, Tech, and Financial Weakness Hurts Outlook
Kenneth J. Gruneisen - Passed the CAN SLIM® Master's Exam
Widespread losses on Friday were led by commodity-linked groups as the Gold & Silver Index ($XAU -3.82%) outpaced the Oil Services Index ($OSX -2.72%) and Integrated Oil Index ($XOI -2.42%). Financial shares are were a big influence creating a negative drag on the major averages as the Bank Index ($BKX -2.67%) and Broker/Dealer Index ($XBD -2.38%) continued sputtering below their respective 50-day moving average lines (see below). Tech shares also slumped as the Networking Index ($NWX -2.23%), Internet Index ($IIX -1.83%), Semiconductor Index ($SOX -1.67%), and Biotechnology Index ($BTK -0.75%) suffered unanimous losses. The Healthcare Index ($HMO -1.51%) and Retail Index ($RLX -1.32%) also ended with losses, rounding out a solidly negative post-holiday session.
Charts courtesy www.stockcharts.com
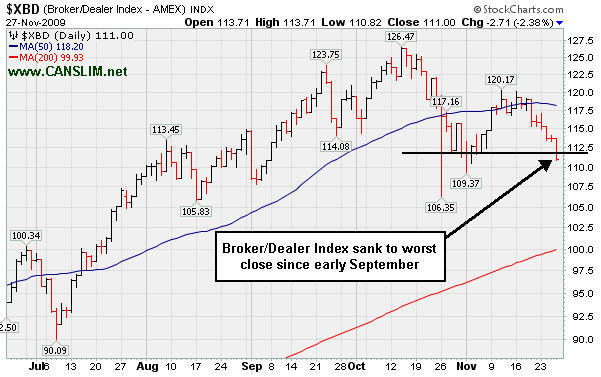
PICTURED 1: The Broker/Dealer Index ($XBD -2.38%) sank to its worst close since early September. Weak action in financial shares raises concerns because the financial group is a "leading indicator" that has proven reliable.
Charts courtesy www.stockcharts.com
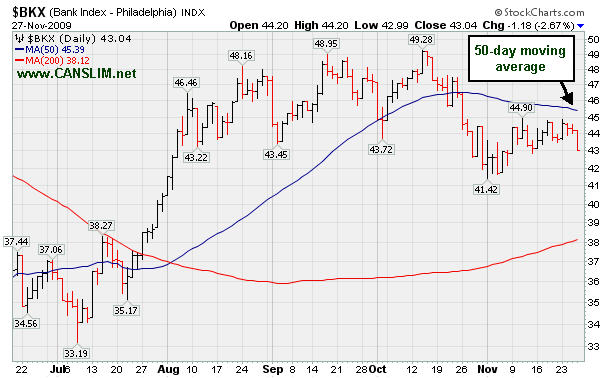
PICTURED 2: The Bank Index ($BKX -2.67%) continues to struggle below its 50-day moving average (DMA) line.
| Oil Services |
$OSX |
189.25 |
-5.29 |
-2.72% |
+55.90% |
| Healthcare |
$HMO |
1,355.06 |
-20.80 |
-1.51% |
+41.13% |
| Integrated Oil |
$XOI |
1,075.20 |
-26.71 |
-2.42% |
+9.75% |
| Semiconductor |
$SOX |
309.82 |
-5.27 |
-1.67% |
+46.02% |
| Networking |
$NWX |
221.00 |
-5.05 |
-2.23% |
+53.59% |
| Internet |
$IIX |
222.69 |
-4.14 |
-1.83% |
+66.47% |
| Broker/Dealer |
$XBD |
111.00 |
-2.71 |
-2.38% |
+43.28% |
| Retail |
$RLX |
404.26 |
-5.42 |
-1.32% |
+44.76% |
| Gold & Silver |
$XAU |
183.52 |
-7.28 |
-3.82% |
+48.18% |
| Bank |
$BKX |
43.04 |
-1.18 |
-2.67% |
-2.89% |
| Biotech |
$BTK |
885.61 |
-6.70 |
-0.75% |
+36.84% |
|
|
|
 |
50 DMA Breach Raises Concern While Base-On-Base Forms
Kenneth J. Gruneisen - Passed the CAN SLIM® Master's Exam
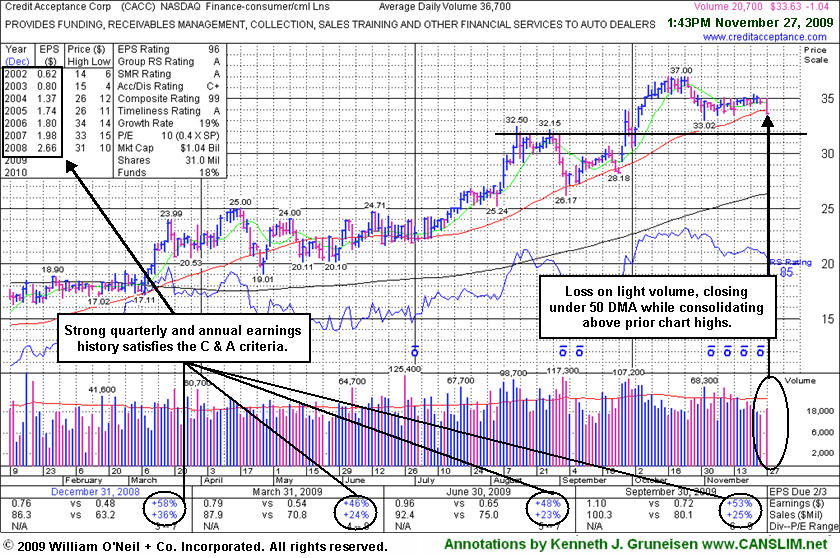
Credit Acceptance Corp (CACC -$1.04 or -3.00% to $33.63) gapped down today amid widespread market weakness and closed just under its 50-day moving average (DMA) line and also under recent low closes with a loss on light volume. Its color code was changed to yellow recently with new pivot point and max buy levels noted. After a 6-week flat base it is continuing its consolidation above prior chart highs in the $32 area, building a base-on-base pattern. The Finance - Consumer/Commercial Loans firm has maintained a great track record of annual and quarterly sales revenues and earnings increases that satisfy the C and A criteria of the investment system. The high-ranked leader's 9/29/09 breakout gain was backed by more than 2 times average volume. Since featured it has also risen above its 2006-2007 highs ($33-34) to new all-time highs, which is a very reassuring sign of strength. CACC was featured in yellow in the 9/29/09 mid-day report (read here).
Investors might be concerned about the weakness and wait for signs of support while considering the current consolidation an opportunity to accumulate shares on the stock's first pullback to its 50 DMA line since its bullish breakout. However, it has met the definition of a new "flat base" which could eventually be followed by a fresh technical buy signal. In fact, a base-on-base pattern is considered to be a very solid set-up pattern. Patience may allow investors to see more proof of institutional buying demand (the I criteria), and make initial buys or add-on buying efforts in the event of a powerful breakout above its $37 high with volume. Meanwhile, further weakness would raise more serious concerns, especially if volume expands behind more damaging losses.
|
|
|
Color Codes Explained :
Y - Better candidates highlighted by our
staff of experts.
G - Previously featured
in past reports as yellow but may no longer be buyable under the
guidelines.
***Last / Change / Volume quote data in this table corresponds with the timestamp on the note***
Symbol/Exchange
Company Name
Industry Group |
Last |
Chg. |
Vol
% DAV |
Date Featured |
Price Featured |
Latest Pivot Point
Featured |
Status |
| Latest Max Buy Price |
ARST
-
|
$23.44
|
-0.99
|
249,535
43% DAV
584,300
|
9/1/2009
(Date
Featured) |
$19.91
(Price
Featured) |
PP = $20.90 |
G |
| MB = $21.95 |
Most Recent Note - 11/27/2009 1:12:41 PM
G - Gapped down today and closed below its 50 DMA line, and although volume was light the loss led to a technical violation of its short-term average line, raising concerns. ARST was first featured in yellow at $19.91 in the 9/01/09 mid-day report with an annotated daily graph (read here).
>>> The latest Featured Stock Update with an annotated graph appeared on 11/19/2009. click here.
|
|
C
A
S
I |
News |
Chart |
SEC
View all notes Alert
me of new notes
Company
Profile
|
ASIA
-
|
$24.38
|
-1.27
|
695,941
69% DAV
1,013,400
|
10/14/2009
(Date
Featured) |
$23.05
(Price
Featured) |
PP = $22.19 |
G |
| MB = $23.30 |
Most Recent Note - 11/27/2009 1:14:58 PM
G - Gapped down today yet closed in the upper half of its trading range with a loss on below average volume after intra-day lows below its "max buy" level. Featured 10/14/09 in the mid-day report (read here) as it gapped up for a new 52-week high with 5 times average volume, triggering a technical buy signal by blasting above its pivot point. First featured in the August 2009 CANSLIM.net News (read here).
>>> The latest Featured Stock Update with an annotated graph appeared on 11/24/2009. click here.
|
|
C
A
S
I |
News |
Chart |
SEC
View all notes Alert
me of new notes
Company
Profile
|
BIDU
- NASDAQ
Baidu Inc Ads
INTERNET - Internet Information Providers
|
$439.72
|
-2.46
|
1,326,133
61% DAV
2,160,700
|
9/8/2009
(Date
Featured) |
$351.80
(Price
Featured) |
PP = $368.59 |
G |
| MB = $387.02 |
Most Recent Note - 11/27/2009 1:16:41 PM
G - Gapped down and then rallied to close the session near its high with a small loss, perched near all-time highs. Proved resilient near its 50 DMA line after its 10/27/09 gap down. As recently noted, "Choppy action has not allowed it to form a sound base in recent weeks." BIDU traded up as much as +23% from its price when featured in yellow in the 9/08/09 Mid-Day BreakOuts Report (read here).
>>> The latest Featured Stock Update with an annotated graph appeared on 11/25/2009. click here.
|
|
C
A
S
I |
News |
Chart |
SEC
View all notes Alert
me of new notes
Company
Profile
|
CACC
- NASDAQ
Credit Acceptance Corp
FINANCIAL SERVICES - Credit Services
|
$33.63
|
-1.04
|
19,953
54% DAV
36,700
|
9/29/2009
(Date
Featured) |
$33.48
(Price
Featured) |
PP = $37.10 |
Y |
| MB = $38.96 |
Most Recent Note - 11/27/2009 1:19:34 PM
Y - Gapped down and closed just under its 50 DMA line and under recent low closes with a loss on light volume. Color code was changed to yellow with new pivot point and max buy levels noted. After a 6-week flat base it is continuing its consolidation above prior chart highs in the $32 area. The Finance - Consumer/Commercial Loans firm has maintained a great track record of annual and quarterly sales revenues and earnings increases. It was featured on 9/29/09 in yellow in the mid-day report (read here).
>>> The latest Featured Stock Update with an annotated graph appeared on 11/27/2009. click here.
|
|
C
A
S
I |
News |
Chart |
SEC
View all notes Alert
me of new notes
Company
Profile
|
CRM
- NYSE
Salesforce.com Inc
INTERNET - Internet Software & Services
|
$63.25
|
-1.84
|
1,214,838
70% DAV
1,725,000
|
8/16/2009
(Date
Featured) |
$47.12
(Price
Featured) |
PP = $45.59 |
G |
| MB = $47.87 |
Most Recent Note - 11/27/2009 1:21:17 PM
G - Gapped down today and then rebounded to close with a smaller loss near the session high after early lows nearly tested important support at its 50 DMA line again. It has not formed any recent base, and distributional pressure has raised concerns.
>>> The latest Featured Stock Update with an annotated graph appeared on 11/23/2009. click here.
|
|
C
A
S
I |
News |
Chart |
SEC
View all notes Alert
me of new notes
Company
Profile
|
GMCR
- NASDAQ
Green Mtn Coffee Roastrs
FOOD & BEVERAGE - Processed & Packaged Goods
|
$62.95
|
-0.41
|
753,904
54% DAV
1,393,900
|
10/5/2009
(Date
Featured) |
$71.11
(Price
Featured) |
PP = $75.89 |
G |
| MB = $79.68 |
Most Recent Note - 11/27/2009 1:22:38 PM
G - Down again on light volume today. It has failed to rally back after recent distributional pressure, and it recently triggered a sell signal by its 50 DMA line violation. Gapped down on 11/12/09 after reporting strong quarterly results for the period ended Sept 30, 2009. As recently noted, "Its choppy action in recent weeks has not allowed for a sound new base to form."
>>> The latest Featured Stock Update with an annotated graph appeared on 11/20/2009. click here.
|
|
C
A
S
I |
News |
Chart |
SEC
View all notes Alert
me of new notes
Company
Profile
|
HEAT
-
|
$12.85
|
-0.22
|
522,758
76% DAV
689,200
|
11/17/2009
(Date
Featured) |
$12.00
(Price
Featured) |
PP = $12.61 |
Y |
| MB = $13.24 |
Most Recent Note - 11/27/2009 1:24:12 PM
Y - Consolidated this week after the prior week's gains on heavy volume drew attention. It was first featured in yellow in the 11/17/09 mid-day report (read here) when technically rising from a "double bottom" base, reaching a new all-time high. On 9/18/09 it completed an additional share offering. There is limited history for this small Chinese firm in the Pollution Control - Equipment group, however its reported annual earnings (A criteria) history has been strong, and the 3 latest quarters show sales revenues and earnings increases well above the +25% guideline.
>>> The latest Featured Stock Update with an annotated graph appeared on 11/17/2009. click here.
|
|
C
A
S
I |
News |
Chart |
SEC
View all notes Alert
me of new notes
Company
Profile
|
LFT
-
|
$35.61
|
+0.24
|
263,710
54% DAV
486,400
|
11/17/2009
(Date
Featured) |
$31.77
(Price
Featured) |
PP = $33.04 |
G |
| MB = $34.69 |
Most Recent Note - 11/27/2009 1:25:41 PM
G -Gapped down then rebounded today for a gain on light volume and a new all-time high close. Last week it rose from a choppy 14-week base. Recent highs in the $31 area are an initial support level to watch. A proposed offering of additional shares on 11/16/09 seems well received by the market. Its fundamentals remain strong.
>>> The latest Featured Stock Update with an annotated graph appeared on 11/18/2009. click here.
|
|
C
A
S
I |
News |
Chart |
SEC
View all notes Alert
me of new notes
Company
Profile
|
|
|
|
THESE ARE NOT BUY RECOMMENDATIONS!
Comments contained in the body of this report are technical
opinions only. The material herein has been obtained
from sources believed to be reliable and accurate, however,
its accuracy and completeness cannot be guaranteed.
This site is not an investment advisor, hence it does
not endorse or recommend any securities or other investments.
Any recommendation contained in this report may not
be suitable for all investors and it is not to be deemed
an offer or solicitation on our part with respect to
the purchase or sale of any securities. All trademarks,
service marks and trade names appearing in this report
are the property of their respective owners, and are
likewise used for identification purposes only.
This report is a service available
only to active Paid Premium Members.
You may opt-out of receiving report notifications
at any time. Questions or comments may be submitted
by writing to Premium Membership Services 665 S.E. 10 Street, Suite 201 Deerfield Beach, FL 33441-5634 or by calling 1-800-965-8307
or 954-785-1121.
|
|
|


