You are not logged in.
This means you
CAN ONLY VIEW reports that were published prior to Monday, April 14, 2025.
You
MUST UPGRADE YOUR MEMBERSHIP if you want to see any current reports.
AFTER MARKET UPDATE - WEDNESDAY, NOVEMBER 26TH, 2014
Previous After Market Report Next After Market Report >>>
|
|
|
|
DOW |
+12.81 |
17,827.75 |
+0.07% |
|
Volume |
685,601,030 |
-17% |
|
Volume |
1,268,209,190 |
-17% |
|
NASDAQ |
+29.07 |
4,787.32 |
+0.61% |
|
Advancers |
1,912 |
60% |
|
Advancers |
1,683 |
59% |
|
S&P 500 |
+5.80 |
2,072.83 |
+0.28% |
|
Decliners |
1,166 |
37% |
|
Decliners |
1,060 |
37% |
|
Russell 2000 |
+4.29 |
1,190.62 |
+0.36% |
|
52 Wk Highs |
196 |
|
|
52 Wk Highs |
122 |
|
|
S&P 600 |
+1.91 |
686.48 |
+0.28% |
|
52 Wk Lows |
35 |
|
|
52 Wk Lows |
44 |
|
|
 |
Major Averages Rose to New Records at Thanksgiving
Kenneth J. Gruneisen - Passed the CAN SLIM® Master's Exam
The major averages edged higher on Wednesday. The Dow closed at an all-time high of 17,827 as it climbed 12 points. The S&P 500 gained 5 points to a record high of 2,072. The NASDAQ Composite rose 29 points to 4,787. There were lighter volume totals on the NYSE and on the Nasdaq exchange. Advancers led decliners by an 3-2 margin on the NYSE and on the Nasdaq exchange. There were 65 high-ranked companies from the CANSLIM.net Leaders List that made new 52-week highs and appeared on the CANSLIM.net BreakOuts Page, down from the prior session total of 90 stocks. New 52-week highs still easily outnumbered new 52-week lows on the NYSE and on the Nasdaq exchange. There were gains for 9 of the 12 high-ranked companies currently on the Featured Stocks Page. A "confirmed uptrend" for the market (M criteria) has been repeatedly noted in this daily Market Commentary since large gains were noted on 10/21/14 backed by higher volume totals as leadership (stocks hitting new 52-week highs) expanded.
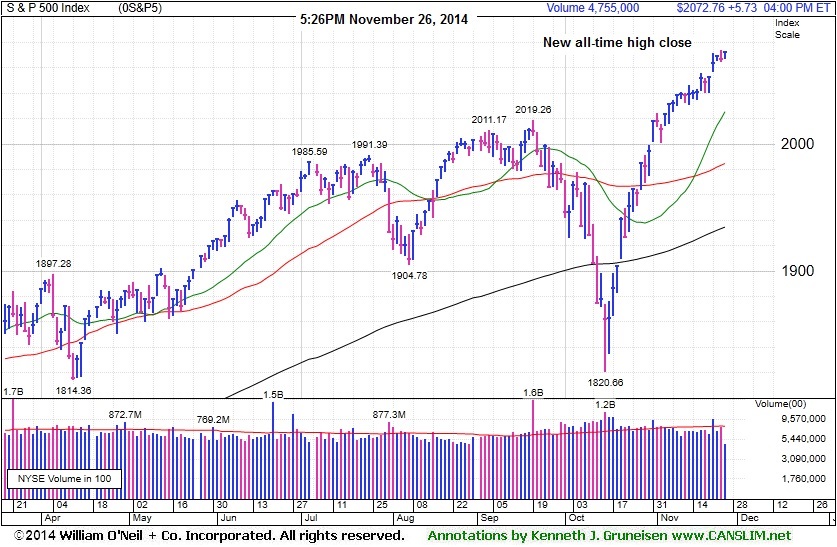
PICTURED: The S&P 500 Index gained 5 points to a record high of 2,072.
The spotlight was on a large batch of mixed economic data. Pending and new home sales for October failed to top analyst expectations while jobless claims unexpectedly rose to a near three-month high of 313,000. Other data revealed durable goods orders increased last month for the first time since July while consumer spending and income rose at the same pace. In addition, the University of Michigan’s consumer confidence index improved this month to the highest level since December 2001 and a gauge on Midwest manufacturing unexpectedly declined from a one-year high.
Eight of the 10 sectors in the S&P 500 finished higher. Verizon (VZ +1.4%) rose while telecom and tech were among the best performing groups. Hewlett-Packard (HPQ +4.1%) rallied after reporting earnings results in-line with analyst estimates. Losses in energy dragged on the market as WTI crude fell -0.7% to a four-year low of $73.59 a barrel ahead of tomorrow’s OPEC meeting. Schlumberger (SLB -2.4%) fell.
Treasuries rose and a government auction of seven-year notes received above average demand. The 10-year note gained 3/32 to yield 2.24%.
Disciplined investors know that new buying efforts may be made under the fact-based investment system only in stocks meeting all key criteria. The Featured Stocks Page shows the most action-worthy candidates and their latest notes and a Headline Link directs members to the latest detailed analysis with data-packed graphs annotated by a Certified expert along with links to additional resources. The Premium Member Homepage includes "dynamic archives" to all prior pay reports published.
|
 Kenneth J. Gruneisen started out as a licensed stockbroker in August 1987, a couple of months prior to the historic stock market crash that took the Dow Jones Industrial Average down -22.6% in a single day. He has published daily fact-based fundamental and technical analysis on high-ranked stocks online for two decades. Through FACTBASEDINVESTING.COM, Kenneth provides educational articles, news, market commentary, and other information regarding proven investment systems that work in good times and bad.
Comments contained in the body of this report are technical opinions only and are not necessarily those of Gruneisen Growth Corp. The material herein has been obtained from sources believed to be reliable and accurate, however, its accuracy and completeness cannot be guaranteed. Our firm, employees, and customers may effect transactions, including transactions contrary to any recommendation herein, or have positions in the securities mentioned herein or options with respect thereto. Any recommendation contained in this report may not be suitable for all investors and it is not to be deemed an offer or solicitation on our part with respect to the purchase or sale of any securities. |
|
 |
Tech Sector Rose While Commodity-Liniked Groups Fell
Kenneth J. Gruneisen - Passed the CAN SLIM® Master's Exam
The Semiconductor Index ($SOX +2.11%) led the tech sector higher while the Biotechnology Index ($BTK +1.09%) and the Networking Index ($NWX +0.61%) posted smaller gains. The Bank Index ($BKX +0.15%) inched higher and the Retail Index ($RLX +0.04%) finished flat while the Broker/Dealer Index ($XBD -0.20%) edged lower. Commodity-Linked groups lagged as the Oil Services Index ($OSX -2.77%) and the Integrated Oil Index ($XOI -0.67%) both lost ground and the Gold & Silver Index ($XAU -1.30%) also slumped.
Charts courtesy www.stockcharts.com
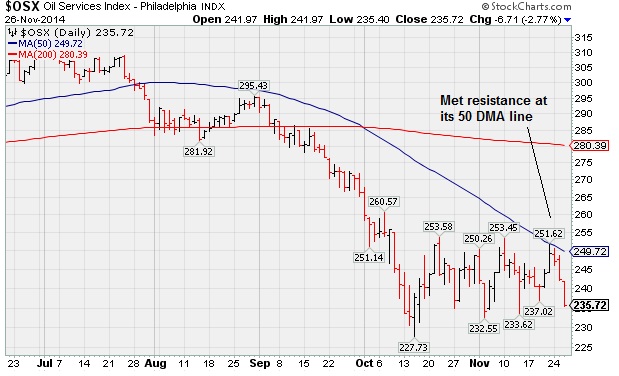
PICTURED: The Oil Services Index ($OSX -2.77%) is slumping after recently meeting resistance at its 50-day moving average (DMA) line.
| Oil Services |
$OSX |
235.72 |
-6.71 |
-2.77% |
-16.12% |
| Integrated Oil |
$XOI |
1,440.78 |
-9.75 |
-0.67% |
-4.15% |
| Semiconductor |
$SOX |
683.48 |
+14.12 |
+2.11% |
+27.75% |
| Networking |
$NWX |
350.41 |
+2.14 |
+0.61% |
+8.17% |
| Broker/Dealer |
$XBD |
177.40 |
-0.36 |
-0.20% |
+10.49% |
| Retail |
$RLX |
997.65 |
+0.35 |
+0.04% |
+6.16% |
| Gold & Silver |
$XAU |
74.44 |
-0.98 |
-1.30% |
-11.54% |
| Bank |
$BKX |
73.23 |
+0.11 |
+0.15% |
+5.73% |
| Biotech |
$BTK |
3,435.98 |
+37.05 |
+1.09% |
+47.44% |
|
|
|
 |
Quiet Gain For New High Close
Kenneth J. Gruneisen - Passed the CAN SLIM® Master's Exam
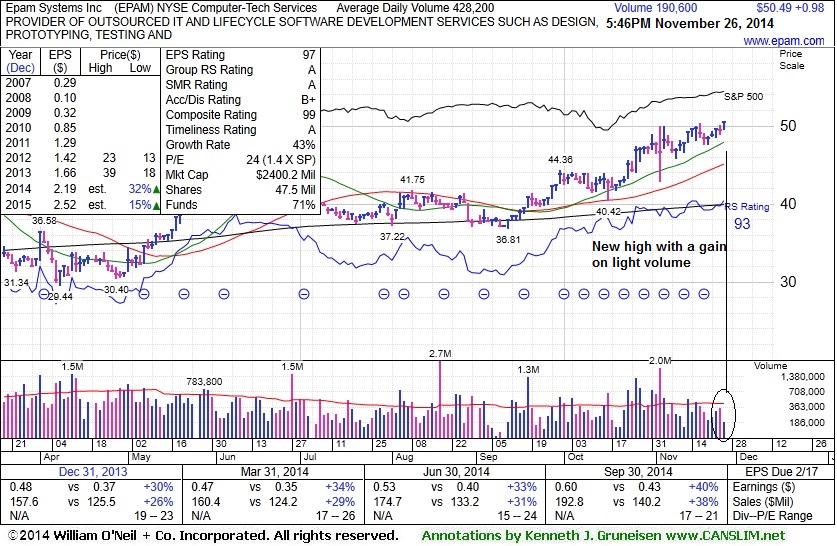
Epam Systems Inc (EPAM +$0.98 or +1.98% to $50.49) quietly rose for a new high close. It has been stubbornly holding its ground above its "max buy" level with volume totals cooling. Prior highs in the $44 area define initial support above its 50-day moving average (DMA) line.
It was last shown in this FSU section on 11/11/14 with annotated graphs under the headline, "Consolidating Above Prior Highs Following Technical Breakout". The high-ranked Computer - Tech Services firm reported earnings for the Sep '14 quarter above views (not yet shown on the chart as of today) and also gave upbeat sales guidance for the current quarter. It had previously reported earnings +33% on +31% sales revenues for the Jun '14 quarter, a 3rd consecutive quarter with earnings above the +25% guideline, making it a better match concerning the C criteria. Annual earnings growth (A criteria) has been strong.
It completed Secondary Offerings 8/30/13 and 9/17/13. Its current Up/Down Volume Ratio of 1.6 is an unbiased indication its shares have been under accumulation in the past 50 days. The number of top-rated funds owning its shares rose from 254 in Dec '13 to 288 in Sep '14, a reassuring sign concerning the I criteria. Its small supply of only 36.1 million shares (S criteria) can contribute to greater volatility in the event of institutional buying or selling.
|
|
|
Color Codes Explained :
Y - Better candidates highlighted by our
staff of experts.
G - Previously featured
in past reports as yellow but may no longer be buyable under the
guidelines.
***Last / Change / Volume data in this table is the closing quote data***
Symbol/Exchange
Company Name
Industry Group |
PRICE |
CHANGE
(%Change) |
Day High |
Volume
(% DAV)
(% 50 day avg vol) |
52 Wk Hi
% From Hi |
Featured
Date |
Price
Featured |
Pivot Featured |
|
Max Buy |
ACT
-
NYSE
Actavis plc
Medical-Generic Drugs
|
$270.47
|
+0.16
0.06% |
$272.75
|
2,087,626
64.31% of 50 DAV
50 DAV is 3,246,000
|
$271.51
-0.38%
|
6/20/2014
|
$216.53
|
PP = $230.87
|
|
MB = $242.41
|
Most Recent Note - 11/24/2014 12:12:07 PM
G - Its 50 DMA line and prior highs define support where violations would raise concerns. Consolidating after spiking to new 52-week highs with volume-driven gains following news it plans to acquire Allergan (AGN) for $66 Billion. Did not form a sound base, and it is extended from prior highs.
>>> FEATURED STOCK ARTICLE : Perched at Highs Following Spike on Acquisition Plans - 11/24/2014
View all notes |
Set NEW NOTE alert |
CANSLIM.net Company Profile |
SEC
News |
Chart |
Request a new note
C
A N
S L
I M


|
AFSI
-
NASDAQ
Amtrust Financial Svcs
INSURANCE - Property and; Casualty Insurance
|
$51.64
|
-0.29
-0.56% |
$52.97
|
757,758
73.07% of 50 DAV
50 DAV is 1,037,000
|
$53.80
-4.01%
|
10/17/2014
|
$45.24
|
PP = $46.02
|
|
MB = $48.32
|
 Most Recent Note - 11/26/2014 1:28:31 PM
G - Encountered distributional pressure yet it is still holding its ground near its 52-week high. Recent lows near $42 and its 50 DMA line define important near-term support.
>>> FEATURED STOCK ARTICLE : No Sound Base Formed, Yet Little Resistance Remains - 11/21/2014
View all notes |
Set NEW NOTE alert |
CANSLIM.net Company Profile |
SEC
News |
Chart |
Request a new note
C
A N
S L
I M
|
ALXN
-
NASDAQ
Alexion Pharmaceuticals
DRUGS - Drug Manufacturers - Other
|
$194.72
|
+1.95
1.01% |
$194.99
|
704,468
59.25% of 50 DAV
50 DAV is 1,189,000
|
$197.64
-1.48%
|
10/23/2014
|
$184.01
|
PP = $185.53
|
|
MB = $194.81
|
Most Recent Note - 11/26/2014 1:31:51 PM
Y - Still quietly trading just below its "max buy" level and perched only -2% off its 52-week and all-time highs. Recent lows near $185 define initial support to watch above its 50 DMA line.
>>> FEATURED STOCK ARTICLE : New High Close With Gain on Light Volume - 11/10/2014
View all notes |
Set NEW NOTE alert |
CANSLIM.net Company Profile |
SEC
News |
Chart |
Request a new note
C
A N
S L
I M
|
BIDU
-
NASDAQ
Baidu Inc Ads
INTERNET - Internet Information Providers
|
$246.03
|
+1.69
0.69% |
$248.74
|
2,920,695
75.41% of 50 DAV
50 DAV is 3,873,000
|
$251.99
-2.37%
|
10/30/2014
|
$234.08
|
PP = $231.51
|
|
MB = $243.09
|
Most Recent Note - 11/26/2014 1:33:19 PM
G - Consolidating above its "max buy" level with recent volume totals cooling. Prior highs near $230 define near-term support to watch above its 50 DMA line.
>>> FEATURED STOCK ARTICLE : Consolidating Back Below "Max Buy" Level - 11/17/2014
View all notes |
Set NEW NOTE alert |
CANSLIM.net Company Profile |
SEC
News |
Chart |
Request a new note
C
A N
S L
I M
|
EPAM
-
NYSE
Epam Systems Inc
COMPUTER SOFTWARE and SERVICES - Information Technology Service
|
$50.49
|
+0.98
1.98% |
$50.50
|
190,629
44.54% of 50 DAV
50 DAV is 428,000
|
$50.34
0.30%
|
10/23/2014
|
$45.21
|
PP = $46.09
|
|
MB = $48.39
|
Most Recent Note - 11/25/2014 5:31:11 PM
G - Still stubbornly holding its ground above its "max buy" level with volume totals cooling. Prior highs in the $44 area defining initial support above its 50 DMA line.
>>> FEATURED STOCK ARTICLE : Quiet Gain For New High Close - 11/26/2014
View all notes |
Set NEW NOTE alert |
CANSLIM.net Company Profile |
SEC
News |
Chart |
Request a new note
C
A N
S L
I M
|
Symbol/Exchange
Company Name
Industry Group |
PRICE |
CHANGE
(%Change) |
Day High |
Volume
(% DAV)
(% 50 day avg vol) |
52 Wk Hi
% From Hi |
Featured
Date |
Price
Featured |
Pivot Featured |
|
Max Buy |
FB
-
NASDAQ
Facebook Inc Cl A
INTERNET
|
$77.62
|
+1.99
2.63% |
$77.78
|
32,710,395
86.53% of 50 DAV
50 DAV is 37,802,000
|
$81.16
-4.36%
|
9/9/2014
|
$76.67
|
PP = $76.84
|
|
MB = $80.68
|
Most Recent Note - 11/26/2014 1:25:21 PM
Y - It has not formed a sound base, yet its color code is changed to yellow after quietly rebounding above the 50 DMA line helping its outlook to improve.
>>> FEATURED STOCK ARTICLE : Following Violation 50-Day Average Acted as Resistance - 11/14/2014
View all notes |
Set NEW NOTE alert |
CANSLIM.net Company Profile |
SEC
News |
Chart |
Request a new note
C
A N
S L
I M
|
FLT
-
NYSE
Fleetcor Technologies
DIVERSIFIED SERVICES - Business/Management Services
|
$155.21
|
+0.56
0.36% |
$156.04
|
429,702
57.99% of 50 DAV
50 DAV is 741,000
|
$160.40
-3.24%
|
10/31/2014
|
$148.50
|
PP = $146.29
|
|
MB = $153.60
|
Most Recent Note - 11/25/2014 5:34:51 PM
G - Holding its ground above its "max buy level" following recent volume-driven gains. Prior highs in the $146-149 area define initial support to watch on pullbacks.
>>> FEATURED STOCK ARTICLE : Consolidation Continues Above Prior Highs - 11/18/2014
View all notes |
Set NEW NOTE alert |
CANSLIM.net Company Profile |
SEC
News |
Chart |
Request a new note
C
A N
S L
I M
|
ILMN
-
NASDAQ
Illumina Inc
DRUGS - Biotechnology
|
$191.90
|
+2.69
1.42% |
$192.13
|
656,128
51.58% of 50 DAV
50 DAV is 1,272,000
|
$197.37
-2.77%
|
10/22/2014
|
$188.77
|
PP = $182.27
|
|
MB = $191.38
|
Most Recent Note - 11/25/2014 5:28:23 PM
Y - Encountered distributional pressure today while consolidating well above prior highs near $182 and above its 50 DMA line. Damaging losses below those levels would raise concerns and trigger technical sell signals. See the latest FSU analysis for more details and new annotated graphs.
>>> FEATURED STOCK ARTICLE : Quietly Consolidating Back Below "Max Buy" Level - 11/25/2014
View all notes |
Set NEW NOTE alert |
CANSLIM.net Company Profile |
SEC
News |
Chart |
Request a new note
C
A N
S L
I M
|
NBCB
-
NASDAQ
First N B C Bank Hldg
Banks-Southeast
|
$37.33
|
-0.06
-0.16% |
$37.68
|
41,517
51.26% of 50 DAV
50 DAV is 81,000
|
$38.18
-2.23%
|
10/31/2014
|
$36.31
|
PP = $35.93
|
|
MB = $37.73
|
Most Recent Note - 11/25/2014 12:38:53 PM
Y - Trading below its "max buy" level today following a volume-driven gain on the prior session. Prior highs near $34 define near-term support to watch on pullbacks.
>>> FEATURED STOCK ARTICLE : Fifth Consecutive Loss While Retreating From Highs - 11/19/2014
View all notes |
Set NEW NOTE alert |
CANSLIM.net Company Profile |
SEC
News |
Chart |
Request a new note
C
A N
S L
I M
|
PANW
-
NYSE
Palo Alto Networks
Computer Sftwr-Security
|
$120.60
|
+0.41
0.34% |
$120.70
|
2,069,477
103.16% of 50 DAV
50 DAV is 2,006,000
|
$120.25
0.29%
|
7/30/2014
|
$84.21
|
PP = $85.88
|
|
MB = $90.17
|
Most Recent Note - 11/25/2014 12:43:43 PM
G - Hitting new all-time highs with today's 2nd consecutive volume-driven gain. It did not form a sound base, and the 50 DMA line defines near-term support to watch. Reported earnings +88% on +50% sales revenues for the Oct '14 quarter.
>>> FEATURED STOCK ARTICLE : Finished Near Session Low With Small Gain on Light Volume - 11/13/2014
View all notes |
Set NEW NOTE alert |
CANSLIM.net Company Profile |
SEC
News |
Chart |
Request a new note
C
A N
S L
I M
|
Symbol/Exchange
Company Name
Industry Group |
PRICE |
CHANGE
(%Change) |
Day High |
Volume
(% DAV)
(% 50 day avg vol) |
52 Wk Hi
% From Hi |
Featured
Date |
Price
Featured |
Pivot Featured |
|
Max Buy |
SNCR
-
NASDAQ
Synchronoss Technologies
COMPUTER SOFTWARE andamp; SERVICES - Application Software
|
$43.87
|
+0.76
1.76% |
$44.12
|
439,373
66.27% of 50 DAV
50 DAV is 663,000
|
$54.05
-18.83%
|
10/27/2014
|
$46.40
|
PP = $47.81
|
|
MB = $50.20
|
Most Recent Note - 11/24/2014 1:01:51 PM
G - Halted its slide but remains below its 50 DMA line following a damaging volume-driven loss that triggered a technical sell signal. Prior lows in the $41 area acted as support, but a rebound above the 50 DMA line is needed for its outlook to improve.
>>> FEATURED STOCK ARTICLE : Loss on Heavy Volume a Sign of Distributional Pressure - 11/12/2014
View all notes |
Set NEW NOTE alert |
CANSLIM.net Company Profile |
SEC
News |
Chart |
Request a new note
C
A N
S L
I M
|
STRT
-
NASDAQ
Strattec Security Corp
AUTOMOTIVE - Auto Parts
|
$104.91
|
-1.04
-0.98% |
$108.52
|
16,756
64.45% of 50 DAV
50 DAV is 26,000
|
$110.96
-5.45%
|
11/20/2014
|
$105.76
|
PP = $109.54
|
|
MB = $115.02
|
Most Recent Note - 11/25/2014 5:36:40 PM
Y - Hovering near its all-time high after forming an advanced "3-weeks tight" base. Volume-driven gains for new highs may trigger a new (or add-on) technical buy signal. Prior highs coincide with its 50 DMA line defining important near-term support to watch on pullbacks.
>>> FEATURED STOCK ARTICLE : Formed New Advanced "3-Weeks Tight" Base - 11/20/2014
View all notes |
Set NEW NOTE alert |
CANSLIM.net Company Profile |
SEC
News |
Chart |
Request a new note
C
A N
S L
I M
|
|
|
|
THESE ARE NOT BUY RECOMMENDATIONS!
Comments contained in the body of this report are technical
opinions only. The material herein has been obtained
from sources believed to be reliable and accurate, however,
its accuracy and completeness cannot be guaranteed.
This site is not an investment advisor, hence it does
not endorse or recommend any securities or other investments.
Any recommendation contained in this report may not
be suitable for all investors and it is not to be deemed
an offer or solicitation on our part with respect to
the purchase or sale of any securities. All trademarks,
service marks and trade names appearing in this report
are the property of their respective owners, and are
likewise used for identification purposes only.
This report is a service available
only to active Paid Premium Members.
You may opt-out of receiving report notifications
at any time. Questions or comments may be submitted
by writing to Premium Membership Services 665 S.E. 10 Street, Suite 201 Deerfield Beach, FL 33441-5634 or by calling 1-800-965-8307
or 954-785-1121.
|
|
|

