You are not logged in.
This means you
CAN ONLY VIEW reports that were published prior to Monday, April 14, 2025.
You
MUST UPGRADE YOUR MEMBERSHIP if you want to see any current reports.
AFTER MARKET UPDATE - MONDAY, NOVEMBER 26TH, 2012
Previous After Market Report Next After Market Report >>>
|
|
|
|
DOW |
-42.31 |
12,967.37 |
-0.33% |
|
Volume |
633,100,030 |
+92% |
|
Volume |
1,543,232,750 |
+107% |
|
NASDAQ |
+9.93 |
2,976.78 |
+0.33% |
|
Advancers |
1,309 |
41% |
|
Advancers |
1,338 |
52% |
|
S&P 500 |
-2.86 |
1,406.29 |
-0.20% |
|
Decliners |
1,725 |
55% |
|
Decliners |
1,124 |
44% |
|
Russell 2000 |
+1.84 |
809.02 |
+0.23% |
|
52 Wk Highs |
76 |
|
|
52 Wk Highs |
48 |
|
|
S&P 600 |
+1.69 |
455.97 |
+0.37% |
|
52 Wk Lows |
9 |
|
|
52 Wk Lows |
31 |
|
|
Note that this commentary acknowledges a favorable shift concerning the market direction (M criteria) based on last Friday's solid gain on the abbreviated session.
|
 |
Confirmed Uptrend For Major Averages Acknowledged After Constructive Action
Kenneth J. Gruneisen - Passed the CAN SLIM® Master's Exam
Monday's session ended with mixed results for the major averages, however, the market direction (M criteria) has shifted to a "confirmed uptrend" following Friday's gain of +1.4% by the Nasdaq Composite Index. The prior gain was recognized as a "follow-through day" on Day 5 of the rally attempt while writers for the newspaper stated that it was sufficient that the abbreviated session's volume was running at a higher pace. On Monday decliners led advancers by nearly a 3-2 margin on the NYSE, yet advancers narrowly outnumbered decliners on the Nasdaq exchange. The total number of stocks hitting new 52-week highs outnumbered new 52-week lows for the second consecutive session on both the NYSE and the Nasdaq exchange. There were 47 high-ranked companies from the CANSLIM.net Leaders List making new 52-week highs and appearing on the CANSLIM.net BreakOuts Page, up from the prior session total of 39 stocks. There were gains for 5 of the 11 high-ranked companies currently included on the Featured Stocks Page.
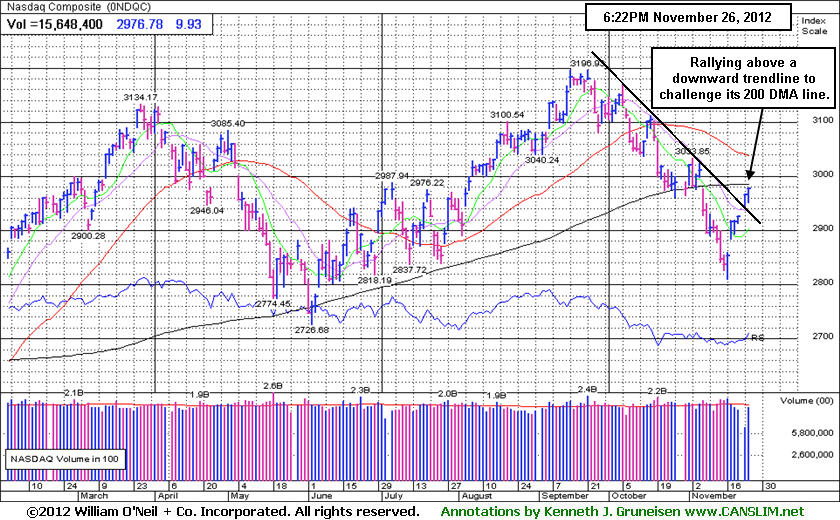
Stocks were under pressure from the opening bell as continued concerns over the fiscal cliff and weaker than expected economic data weighed on investors. The tech-heavy Nasdaq Composite Index bucked the trend on Monday, adding 10 points to close at 2,977 after being down by as many as 15 points in early action, but it finished still below its 200-day moving average (DMA) line (now 2,985.60). The Dow Jones Industrial Average's loss on Monday also took it back below its 200 DMA line, meanwhile the benchmark S&P 500 Index remains above its 200 DMA line after its recent rebound.
Eight of the 10 sectors on the S&P ended lower, led by -1% declines in telecom and energy stocks. Shares of AT&T Inc (T -1.14%) and Exxon Mobil Corp (XOM -0.53%) edged lower. On the upside, tech stocks showed strength with Facebook Inc (FB +8.09%) advancing after the company received positive analysts' comments and a ratings upgrade. Also in the space, Apple Inc (AAPL +3.15%) added $18.03 to $589.53 and Yahoo! Inc (YHOO +1.00%) rose.
Turning to fixed income, Treasuries are higher along the curve. The benchmark 10-year note is up 7/32 to yield 1.67% and the 30-year bond is adding 1/2 of a point to yield 2.81%.
The market direction (M criteria) has shifted to a "confirmed uptrend" following Friday's gain of +1.4% by the Nasdaq Composite Index. The prior gain was recognized as a "follow-through day" on Day 5 of the rally attempt while writers for the newspaper stated that it was sufficient that the abbreviated session's volume was running at a higher pace. New buying efforts may now be justified in worthy high-ranked leaders as a result of last week's constructive gains coupled with healthy leadership and a respectable number of stocks hitting new 52-week highs. See the noteworthy companies included on the Featured Stocks Page.
Watch for an announcement via email concerning the next WEBCAST. The webcast will also be available via an updated link highlighted at the top of the Premium Member Homepage.
PICTURED: The Nasdaq Composite Index recently has rallied above a downward trendline while approaching its 200-day moving average (DMA) line. The major average produced a new confirmed rally with a "follow-through day", and disciplined investors know that it is important to only take action on worthy leaders meeting all key criteria.
|
 Kenneth J. Gruneisen started out as a licensed stockbroker in August 1987, a couple of months prior to the historic stock market crash that took the Dow Jones Industrial Average down -22.6% in a single day. He has published daily fact-based fundamental and technical analysis on high-ranked stocks online for two decades. Through FACTBASEDINVESTING.COM, Kenneth provides educational articles, news, market commentary, and other information regarding proven investment systems that work in good times and bad.
Comments contained in the body of this report are technical opinions only and are not necessarily those of Gruneisen Growth Corp. The material herein has been obtained from sources believed to be reliable and accurate, however, its accuracy and completeness cannot be guaranteed. Our firm, employees, and customers may effect transactions, including transactions contrary to any recommendation herein, or have positions in the securities mentioned herein or options with respect thereto. Any recommendation contained in this report may not be suitable for all investors and it is not to be deemed an offer or solicitation on our part with respect to the purchase or sale of any securities. |
|
 |
Tech and Financial Groups Mixed; Energy and Defensive Groups Fell
Kenneth J. Gruneisen - Passed the CAN SLIM® Master's Exam
Weakness in energy-related shares dragged the Oil Services Index ($OSX -0.82%) and Integrated Oil Index ($XOI -0.75%) lower. Defensive groups also had a slightly negative bias as the Healthcare Index ($HMO -0.52%) and Gold & Silver Index ($XAU -0.20%) ended with modest losses. Influential financial shares were mixed, with a modest loss from the Bank Index ($BKX -0.43%) while the Broker/Dealer Index ($XBD +0.99%) rallied. The Retail Index ($RLX -0.22%) and Biotechnology Index ($BTK -0.33%) ended slightly lower, meanwhile the tech sector saw modest gains from the Semiconductor Index ($SOX +0.40%), Internet Index ($IIX +0.44%), and the Networking Index ($NWX +1.25%).
Charts courtesy www.stockcharts.com
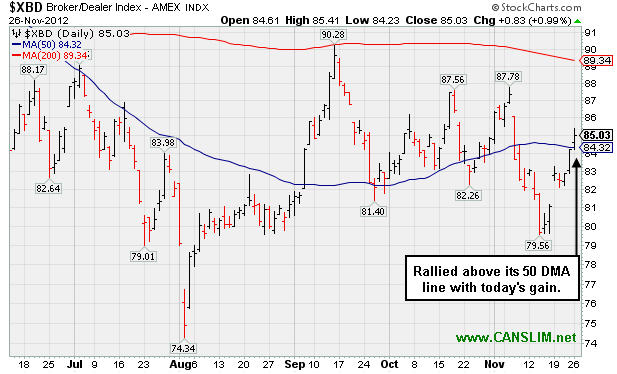
PICTURED: The Broker/Dealer Index ($XBD +0.99%) rallied above its 50-day moving average (DMA) line today, an encouraging improvement in the influential financial group's technical stance.
| Oil Services |
$OSX |
216.21 |
-1.78 |
-0.82% |
-0.03% |
| Healthcare |
$HMO |
2,479.26 |
-12.86 |
-0.52% |
+8.66% |
| Integrated Oil |
$XOI |
1,212.93 |
-9.21 |
-0.75% |
-1.32% |
| Semiconductor |
$SOX |
370.63 |
+1.47 |
+0.40% |
+1.70% |
| Networking |
$NWX |
205.99 |
+2.55 |
+1.25% |
-4.26% |
| Internet |
$IIX |
316.93 |
+1.39 |
+0.44% |
+12.49% |
| Broker/Dealer |
$XBD |
85.03 |
+0.83 |
+0.99% |
+2.11% |
| Retail |
$RLX |
668.97 |
-1.49 |
-0.22% |
+27.86% |
| Gold & Silver |
$XAU |
173.99 |
-0.35 |
-0.20% |
-3.68% |
| Bank |
$BKX |
48.96 |
-0.21 |
-0.43% |
+24.33% |
| Biotech |
$BTK |
1,527.90 |
-5.11 |
-0.33% |
+39.99% |
|
|
|
 |
Rebounded Above 50 DMA Line Near 52-Week High
Kenneth J. Gruneisen - Passed the CAN SLIM® Master's Exam
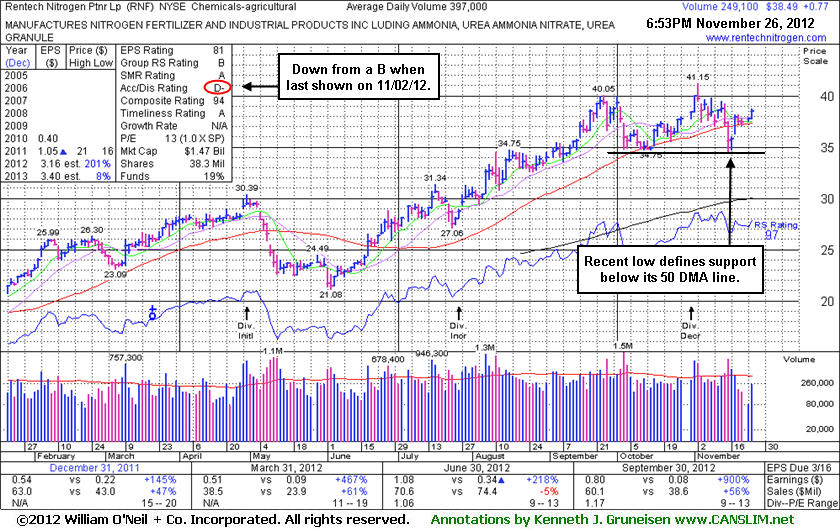
Rentech Nitrogen Ptnr LP (RNF +$0.77 or +2.04% to $38.49) recently rebounded above its 50-day moving average (DMA) line helping its technical stance improve and its color code was changed to yellow. The market direction (M criteria) has also been noted in tonight's market commentary as favorable again for taking action on any new buy candidates. Subsequent volume-driven gains above its previously cited pivot point may trigger a new (or add-on) technical buy signal.
Concerns have been raised by the fact that its Accumulation/Distribution Rating has again slumped to a D- from a B rating since its last appearance in this FSU section on 11/02/12 with an annotated graph under the headline, "New High Today Followed By Negative Reversal". That is a good reason to not jump in "early" but to instead wait for proof of fresh institutional buying demand. It had hit a new 52-week high and then reversed for a loss with above average volume which broke a streak of 5 consecutive gains. On 11/01/12 its color code was changed to yellow with a new pivot point cited based on its 9/25/12 high plus 10 cents, but the noted "negative reversal" kept it from triggering a new buy signal.
On 8/07/12 it triggered a technical buy signal with its considerable gain backed by +266% above average volume as it rallied above its earlier pivot point into new high territory. It traded as much as +35.4% higher within less than 2 months afterward. The number of top-rated funds owning its shares rose from 42 in Dec '11 to 51 as of Sep '12, a reassuring sign concerning the I criteria.
|
|
|
Color Codes Explained :
Y - Better candidates highlighted by our
staff of experts.
G - Previously featured
in past reports as yellow but may no longer be buyable under the
guidelines.
***Last / Change / Volume data in this table is the closing quote data***
Symbol/Exchange
Company Name
Industry Group |
PRICE |
CHANGE
(%Change) |
Day High |
Volume
(% DAV)
(% 50 day avg vol) |
52 Wk Hi
% From Hi |
Featured
Date |
Price
Featured |
Pivot Featured |
|
Max Buy |
CFNL
-
NASDAQ
Cardinal Financial Corp
BANKING - Regional - Southeast Banks
|
$15.10
|
+0.05
0.33% |
$15.20
|
256,661
162.65% of 50 DAV
50 DAV is 157,800
|
$16.21
-6.85%
|
8/17/2012
|
$12.84
|
PP = $13.31
|
|
MB = $13.98
|
 Most Recent Note - 11/26/2012 6:48:50 PM
G - It is still extended from its prior base, and above average volume in recent weeks without meaningful upward price progress is a sign it has been encountering distributional pressure. Prior highs and its 50 DMA line define near-term chart support to watch.
>>> The latest Featured Stock Update with an annotated graph appeared on 11/20/2012. Click here.
View all notes |
Alert me of new notes |
CANSLIM.net Company Profile |
SEC |
Zacks Reports |
StockTalk |
News |
Chart |
Request a new note
C
A N
S L
I M


|
CMCSA
-
NASDAQ
Comcast Corp Cl A
MEDIA - CATV Systems
|
$36.63
|
-0.28
-0.76% |
$36.83
|
7,104,098
56.30% of 50 DAV
50 DAV is 12,619,400
|
$37.96
-3.50%
|
6/11/2012
|
$29.94
|
PP = $30.98
|
|
MB = $32.53
|
Most Recent Note - 11/26/2012 5:51:11 PM
G - Consolidating above its 50 DMA line, however its latest consolidation is too brief to be considered a sound new base pattern.
>>> The latest Featured Stock Update with an annotated graph appeared on 11/19/2012. Click here.
View all notes |
Alert me of new notes |
CANSLIM.net Company Profile |
SEC |
Zacks Reports |
StockTalk |
News |
Chart |
Request a new note
C
A N
S L
I M
|
DVA
-
NYSE
Davita Healthcare Prtns
HEALTH SERVICES - Specialized Health Services
|
$110.00
|
-1.43
-1.28% |
$112.61
|
1,155,754
129.37% of 50 DAV
50 DAV is 893,400
|
$116.50
-5.58%
|
9/5/2012
|
$102.92
|
PP = $100.62
|
|
MB = $105.65
|
Most Recent Note - 11/21/2012 12:03:41 PM
G - Consolidating -5% off its 52-week high today following a streak of 9 consecutive weekly gains. Fundamental concerns were raised after it reported earnings +3% on +12% sales for the Sep '12 quarter, below the guidelines of the fact-based system.
>>> The latest Featured Stock Update with an annotated graph appeared on 11/8/2012. Click here.
View all notes |
Alert me of new notes |
CANSLIM.net Company Profile |
SEC |
Zacks Reports |
StockTalk |
News |
Chart |
Request a new note
C
A N
S L
I M
|
GPX
-
NYSE
G P Strategies Corp
DIVERSIFIED SERVICES - Education and Training Services
|
$20.74
|
+0.18
0.88% |
$20.80
|
43,176
72.32% of 50 DAV
50 DAV is 59,700
|
$21.44
-3.26%
|
10/8/2012
|
$20.00
|
PP = $20.77
|
|
MB = $21.81
|
Most Recent Note - 11/20/2012 12:05:59 PM
G - Still holding its ground stubbornly, hovering near its 52-week high. Earnings +0% on +12% sales revenues for the Sep '12 quarter, below the +25% minimum earnings guideline (C criteria) raised fundamental concerns. Deterioration leading to a close below its old high close ($20.27 on 8/17/12) would negate the recent technical breakout, and a violation of its 50 DMA line would be a more worrisome sell signal.
>>> The latest Featured Stock Update with an annotated graph appeared on 11/15/2012. Click here.
View all notes |
Alert me of new notes |
CANSLIM.net Company Profile |
SEC |
Zacks Reports |
StockTalk |
News |
Chart |
Request a new note
C
A N
S L
I M
|
LKQ
-
NASDAQ
L K Q Corp
WHOLESALE - Auto Parts
|
$21.63
|
-0.39
-1.75% |
$22.29
|
4,600,712
267.98% of 50 DAV
50 DAV is 1,716,800
|
$22.09
-2.11%
|
8/9/2012
|
$18.97
|
PP = $18.72
|
|
MB = $19.66
|
Most Recent Note - 11/26/2012 5:53:03 PM
G - Hit a new 52-week high today, however after a worrisome "negative reversal" it finished near the session low with a loss on above average volume. Results below the +25% minimum earnings guideline (C criteria) for Sep '12 recently raised fundamental concerns.
>>> The latest Featured Stock Update with an annotated graph appeared on 11/14/2012. Click here.
View all notes |
Alert me of new notes |
CANSLIM.net Company Profile |
SEC |
Zacks Reports |
StockTalk |
News |
Chart |
Request a new note
C
A N
S L
I M
|
Symbol/Exchange
Company Name
Industry Group |
PRICE |
CHANGE
(%Change) |
Day High |
Volume
(% DAV)
(% 50 day avg vol) |
52 Wk Hi
% From Hi |
Featured
Date |
Price
Featured |
Pivot Featured |
|
Max Buy |
MIDD
-
NASDAQ
Middleby Corp
MANUFACTURING - Diversified Machinery
|
$126.49
|
-0.51
-0.40% |
$127.40
|
62,873
87.57% of 50 DAV
50 DAV is 71,800
|
$128.96
-1.92%
|
10/8/2012
|
$118.46
|
PP = $122.67
|
|
MB = $128.80
|
Most Recent Note - 11/26/2012 5:55:09 PM
Y - Consolidating in a tight trading range near its all-time high. Recently reported earnings +23% on +18% sales for the Sep '12 quarter, below the +25% minimum earnings guideline (C criteria), raising fundamental concerns.
>>> The latest Featured Stock Update with an annotated graph appeared on 11/16/2012. Click here.
View all notes |
Alert me of new notes |
CANSLIM.net Company Profile |
SEC |
Zacks Reports |
StockTalk |
News |
Chart |
Request a new note
C
A N
S L
I M
|
RAX
-
NYSE
Rackspace Hosting Inc
INTERNET - Internet Software and; Services
|
$66.26
|
-0.13
-0.20% |
$66.50
|
921,760
55.89% of 50 DAV
50 DAV is 1,649,300
|
$69.81
-5.09%
|
11/26/2012
|
$66.26
|
PP = $67.18
|
|
MB = $70.54
|
Most Recent Note - 11/26/2012 6:41:49 PM
Y - Quietly consolidating above its 50 DMA line and its color code is changed to yellow while working on a "double bottom" base with new pivot point cited based on its 11/02/12 high.
>>> The latest Featured Stock Update with an annotated graph appeared on 11/6/2012. Click here.
View all notes |
Alert me of new notes |
CANSLIM.net Company Profile |
SEC |
Zacks Reports |
StockTalk |
News |
Chart |
Request a new note
C
A N
S L
I M
|
RGR
-
NYSE
Sturm Ruger & Co Inc
CONSUMER DURABLES - Sporting Goods
|
$55.01
|
+0.44
0.81% |
$56.00
|
830,974
198.61% of 50 DAV
50 DAV is 418,400
|
$58.42
-5.84%
|
11/20/2012
|
$52.23
|
PP = $52.65
|
|
MB = $55.28
|
Most Recent Note - 11/26/2012 12:45:20 PM
Y - Reversed into the red after trading up beyond its "max buy" level earlier. Rallied and closed above its pivot point on the prior session with +75% above average volume behind its gain while breaking out of a cup-with-handle base. Faces little resistance up through the $58 level. The M criteria has shifted to a "confirmed uptrend" following Friday's gain of +1.4% by the Nasdaq Composite Index, recognized as a follow-through day while writers for the newspaper stated that the abbreviated session's volume was running at a higher pace.
>>> The latest Featured Stock Update with an annotated graph appeared on 11/21/2012. Click here.
View all notes |
Alert me of new notes |
CANSLIM.net Company Profile |
SEC |
Zacks Reports |
StockTalk |
News |
Chart |
Request a new note
C
A N
S L
I M
|
RNF
-
NYSE
Rentech Nitrogen Ptnr Lp
CHEMICALS - Agricultural Chemicals
|
$38.49
|
+0.77
2.04% |
$38.69
|
249,476
62.84% of 50 DAV
50 DAV is 397,000
|
$41.15
-6.46%
|
11/1/2012
|
$39.11
|
PP = $40.15
|
|
MB = $42.16
|
Most Recent Note - 11/26/2012 7:12:48 PM
Y - Color code is changed to yellow while no new pivot point is cited, yet subsequent volume driven gains for a new high close may trigger a technical buy signal. Rebounded above its 50 DMA line following the previously noted "negative reversal", and an improving market environment (M criteria) is an encouraging sign. See the latest FSU analysis for more details and a new annotated graph.
>>> The latest Featured Stock Update with an annotated graph appeared on 11/26/2012. Click here.
View all notes |
Alert me of new notes |
CANSLIM.net Company Profile |
SEC |
Zacks Reports |
StockTalk |
News |
Chart |
Request a new note
C
A N
S L
I M
|
VSI
-
NYSE
Vitamin Shoppe Inc
SPECIALTY RETAIL - Specialty Retail, Other
|
$59.14
|
-1.11
-1.84% |
$60.64
|
138,097
54.41% of 50 DAV
50 DAV is 253,800
|
$61.89
-4.44%
|
10/15/2012
|
$57.82
|
PP = $60.08
|
|
MB = $63.08
|
Most Recent Note - 11/23/2012 3:43:35 PM
Y -Posted a gain today with light volume for its 3rd best close. The $61 area has been a stubborn resistance level in recent months. It released better than expected earnings +35% on +14% sales revenues for the Sep '12 quarter.
>>> The latest Featured Stock Update with an annotated graph appeared on 11/12/2012. Click here.
View all notes |
Alert me of new notes |
CANSLIM.net Company Profile |
SEC |
Zacks Reports |
StockTalk |
News |
Chart |
Request a new note
C
A N
S L
I M
|
Symbol/Exchange
Company Name
Industry Group |
PRICE |
CHANGE
(%Change) |
Day High |
Volume
(% DAV)
(% 50 day avg vol) |
52 Wk Hi
% From Hi |
Featured
Date |
Price
Featured |
Pivot Featured |
|
Max Buy |
WPI
-
NYSE
Watson Pharmaceuticals
DRUGS - Drugs - Generic
|
$86.49
|
+0.41
0.48% |
$86.49
|
722,967
89.94% of 50 DAV
50 DAV is 803,800
|
$90.00
-3.90%
|
8/24/2012
|
$82.90
|
PP = $81.10
|
|
MB = $85.16
|
Most Recent Note - 11/23/2012 3:44:41 PM
G - Wedged above its 50 DMA line today. See the latest FSU analysis for more details and a new annotated graph.
>>> The latest Featured Stock Update with an annotated graph appeared on 11/23/2012. Click here.
View all notes |
Alert me of new notes |
CANSLIM.net Company Profile |
SEC |
Zacks Reports |
StockTalk |
News |
Chart |
Request a new note
C
A N
S L
I M
|
|
|
|
THESE ARE NOT BUY RECOMMENDATIONS!
Comments contained in the body of this report are technical
opinions only. The material herein has been obtained
from sources believed to be reliable and accurate, however,
its accuracy and completeness cannot be guaranteed.
This site is not an investment advisor, hence it does
not endorse or recommend any securities or other investments.
Any recommendation contained in this report may not
be suitable for all investors and it is not to be deemed
an offer or solicitation on our part with respect to
the purchase or sale of any securities. All trademarks,
service marks and trade names appearing in this report
are the property of their respective owners, and are
likewise used for identification purposes only.
This report is a service available
only to active Paid Premium Members.
You may opt-out of receiving report notifications
at any time. Questions or comments may be submitted
by writing to Premium Membership Services 665 S.E. 10 Street, Suite 201 Deerfield Beach, FL 33441-5634 or by calling 1-800-965-8307
or 954-785-1121.
|
|
|

