You are not logged in.
This means you
CAN ONLY VIEW reports that were published prior to Monday, February 26, 2024.
You
MUST UPGRADE YOUR MEMBERSHIP if you want to see any current reports.
AFTER MARKET UPDATE - WEDNESDAY, NOVEMBER 25TH, 2020
Previous After Market Report Next After Market Report >>>
|
|
|
|
DOW |
-173.77 |
29,872.47 |
-0.58% |
|
Volume |
965,969,155 |
-20% |
|
Volume |
4,393,358,700 |
-30% |
|
NASDAQ |
+54.66 |
12,091.44 |
+0.45% |
|
Advancers |
1,313 |
43% |
|
Advancers |
1,733 |
49% |
|
S&P 500 |
-5.76 |
3,629.65 |
-0.16% |
|
Decliners |
1,743 |
57% |
|
Decliners |
1,775 |
51% |
|
Russell 2000 |
-8.51 |
1,845.02 |
-0.46% |
|
52 Wk Highs |
141 |
|
|
52 Wk Highs |
199 |
|
|
S&P 600 |
-9.35 |
1,060.05 |
-0.87% |
|
52 Wk Lows |
1 |
|
|
52 Wk Lows |
9 |
|
|
 |
Major Indices Ended Mixed Ahead of Thanksgiving Holiday
Kenneth J. Gruneisen - Passed the CAN SLIM® Master's Exam
The Dow lost 173 points to 29,872 a day after closing above 30,000 for the first time. The S&P 500 eased from an all-time high, declining 0.2%. The Nasdaq Composite bucked the downtrend, adding 0.5%. The reported volume totals were lighter than the prior session on the NYSE and on the Nasdaq exchange. Decliners led advancers by a 4-3 margin on the NYSE while the mix was nearly even on the Nasdaq exchange. There were 48 high-ranked companies from the Leaders List that hit new 52-week highs and were listed on the BreakOuts Page, versus the total of 91 on the prior session. New 52-week highs totals contracted yet outnumbered shrinking new 52-week lows totals which were in the single digits on both exchanges. The major indices confirmed a new uptrend (M criteria) with recent follow-through gains backed by higher volume and more leadership. Investors are reminded to always make buying and selling decisions based based on the strict criteria and rules of the fact-based investment system. 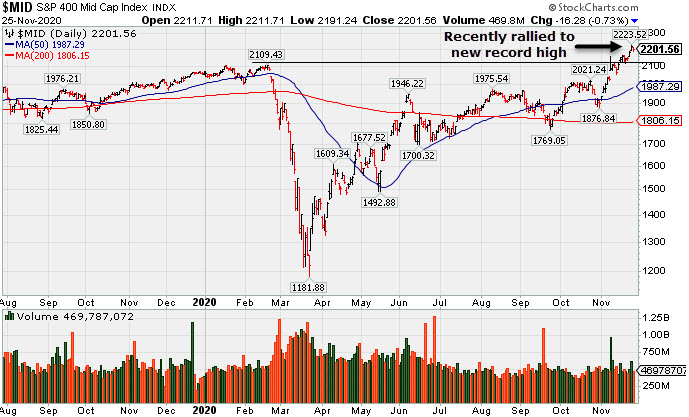 PICTURED: The S&P 400 Mid-Cap Index recently rallied to a new record high.
Stocks finished mixed on Wednesday, as investors digested a flurry of economic data ahead of the Thanksgiving holiday. All three major averages remain on track to rise at least 2% during the holiday-shortened week with just an abbreviated trading session left on Friday.
On the data front, initial jobless claims unexpectedly rose to 778,000 in the most recent week from the prior period's 748,000 figure. Personal spending fell 0.7% last month, reversing course from September's 0.7% uptick and disappointing expectations for a 0.1% decline. Meanwhile, flash readings of October wholesale inventories and durable goods orders each jumped more than expected. The Fed's preferred proxy of inflation showed core consumer prices rose 1.4% year-over-year in October. In central bank news, the minutes from the Federal Reserve’s November policy meeting highlighted the committee’s extensive discussion about the bank’s asset purchase program. Policymakers also expressed concern over the pace of the economic recovery. Treasuries were mixed, with the yield on the 10-year note little changed at 0.88%.
Seven of 11 S&P 500 sectors ended in negative territory, with the more cyclical-oriented groups Energy, Materials and Industrials lagging. In corporate news, Slack Technologies (WORK +37.59%) after The Wall Street Journal reported Salesforce.com (CRM -5.37%) was in talks to acquire the company. Gap (GPS -19.6%) fell after disappointing analysts’ profit projections. Meanwhile, Nordstrom (JWN +11.65%) rose after its quarterly earnings came in well above consensus estimates. |
 Kenneth J. Gruneisen started out as a licensed stockbroker in August 1987, a couple of months prior to the historic stock market crash that took the Dow Jones Industrial Average down -22.6% in a single day. He has published daily fact-based fundamental and technical analysis on high-ranked stocks online for two decades. Through FACTBASEDINVESTING.COM, Kenneth provides educational articles, news, market commentary, and other information regarding proven investment systems that work in good times and bad.
Comments contained in the body of this report are technical opinions only and are not necessarily those of Gruneisen Growth Corp. The material herein has been obtained from sources believed to be reliable and accurate, however, its accuracy and completeness cannot be guaranteed. Our firm, employees, and customers may effect transactions, including transactions contrary to any recommendation herein, or have positions in the securities mentioned herein or options with respect thereto. Any recommendation contained in this report may not be suitable for all investors and it is not to be deemed an offer or solicitation on our part with respect to the purchase or sale of any securities. |
|
 |
Retail and Gold & Silver Indexes Rose
Kenneth J. Gruneisen - Passed the CAN SLIM® Master's Exam
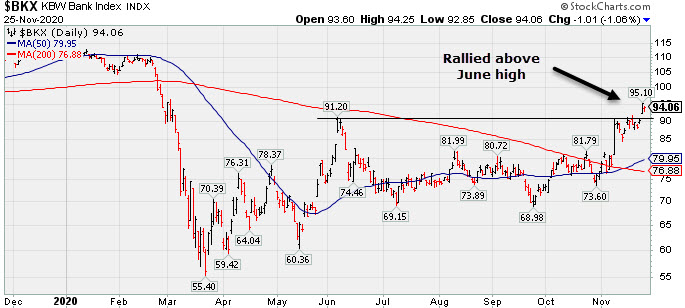
The Retail Index ($RLX +1.05%) posted an influential gain while the Broker/Dealer Index ($XBD -0.41%) and Bank Index ($BKX -1.06%) both fell. The Biotech Index ($BTK +0.13%) eked out a tiny ggain while the Semiconductor Index ($SOX -0.37%) and the Networking Index ($NWX -0.40%) both edged lower. Commodity-linked groups were mixed as the Integrated Oil Index ($XOI -2.23%) and Oil Services Index ($OSX -0.82%) both lost ground while the Gold & Silver Index ($XAU +1.68%) posted a small gain.
PICTURED: The Bank Index ($BKX -1.06%) recently rallied above its June high.
| Oil Services |
$OSX |
42.90 |
-0.35 |
-0.82% |
-45.20% |
| Integrated Oil |
$XOI |
807.04 |
-18.44 |
-2.23% |
-36.48% |
| Semiconductor |
$SOX |
2,599.28 |
-9.73 |
-0.37% |
+40.53% |
| Networking |
$NWX |
645.76 |
-2.61 |
-0.40% |
+10.69% |
| Broker/Dealer |
$XBD |
350.00 |
-1.44 |
-0.41% |
+20.53% |
| Retail |
$RLX |
3,497.48 |
+36.35 |
+1.05% |
+42.80% |
| Gold & Silver |
$XAU |
133.01 |
+2.19 |
+1.68% |
+24.40% |
| Bank |
$BKX |
94.06 |
-1.01 |
-1.06% |
-17.02% |
| Biotech |
$BTK |
5,435.24 |
+6.84 |
+0.13% |
+7.26% |
|
|
|
 |
Featured Stocks
Kenneth J. Gruneisen - Passed the CAN SLIM® Master's Exam
|
|
|
Color Codes Explained :
Y - Better candidates highlighted by our
staff of experts.
G - Previously featured
in past reports as yellow but may no longer be buyable under the
guidelines.
***Last / Change / Volume data in this table is the closing quote data***
Symbol/Exchange
Company Name
Industry Group |
PRICE |
CHANGE
(%Change) |
Day High |
Volume
(% DAV)
(% 50 day avg vol) |
52 Wk Hi
% From Hi |
Featured
Date |
Price
Featured |
Pivot Featured |
|
Max Buy |
 CRL
-
NYSE
CRL
-
NYSE
Charles River Labs Intl
DRUGS - Biotechnology
|
$226.35
|
+1.67
0.74% |
$226.85
|
188,973
56.08% of 50 DAV
50 DAV is 337,000
|
$257.88
-12.23%
|
7/15/2020
|
$192.66
|
PP = $189.95
|
|
MB = $199.45
|
Most Recent Note - 11/24/2020 5:21:28 PM
G - Today's loss was backed by light volume but it violated an upward trendline and its 50 DMA line ($232) raising greater concerns while triggering worrisome technical sell signals. Only a prompt rebound above the 50 DMA line would help its outlook improve. Reported Sep '20 quarterly earnings +38% on +11% sales revenues versus the year ago period, above the +25% minimum earnings guideline (C criteria).
>>> FEATURED STOCK ARTICLE : Consolidating Near Important Support Levels - 11/23/2020 |
View all notes |
Set NEW NOTE alert |
Company Profile |
SEC
News |
Chart |
Request a new note
C
A
S
I |
AMD
-
NASDAQ
Advanced Micro Devices
ELECTRONICS - Semiconductor - Broad Line
|
$86.71
|
+1.64
1.93% |
$87.84
|
41,154,410
81.93% of 50 DAV
50 DAV is 50,231,000
|
$94.28
-8.03%
|
11/18/2020
|
$82.54
|
PP = $88.72
|
|
MB = $93.16
|
Most Recent Note - 11/24/2020 5:17:34 PM
Y - Volume totals are cooling while still consolidating above its 50 DMA line ($81.23). Prior lows in the $73 area define important near term support. Subsequent gains above the pivot point backed by at least +40% above average volume are needed to trigger trigger a technical buy signal.
>>> FEATURED STOCK ARTICLE : Weak Action Raised Concern While Testing Recent Low - 11/3/2020 |
View all notes |
Set NEW NOTE alert |
Company Profile |
SEC
News |
Chart |
Request a new note
C
A
S
I |
TER
-
NASDAQ
Teradyne Inc
ELECTRONICS - Semiconductor Equipment and Mate
|
$108.34
|
-0.65
-0.60% |
$110.03
|
1,368,592
63.10% of 50 DAV
50 DAV is 2,169,000
|
$109.50
-1.06%
|
10/21/2020
|
$92.22
|
PP = $93.54
|
|
MB = $98.22
|
Most Recent Note - 11/23/2020 5:24:15 PM
G - Posted another gain today with below average volume for new all-time high. Reported earnings +53% on +41% sales revenues for the Sep '20 quarter versus the year ago period, its 4th consecutive quarterly comparison with earnings above the +25% minimum earnings guideline (C criteria). Sequential comparisons show encouraging acceleration in its sales revenues growth rate. Its annual earnings (A criteria) history has been strong.
>>> FEATURED STOCK ARTICLE : Recent Gains for New Highs Lacked Great Volume Conviction - 11/11/2020 |
View all notes |
Set NEW NOTE alert |
Company Profile |
SEC
News |
Chart |
Request a new note
C
A
S
I |
TREX
-
NYSE
Trex Company Inc
MATERIALS and CONSTRUCTION - General Building Materials
|
$73.50
|
-0.50
-0.68% |
$74.52
|
482,238
61.75% of 50 DAV
50 DAV is 781,000
|
$81.23
-9.52%
|
6/26/2020
|
$54.53
|
PP = $66.47
|
|
MB = $69.79
|
Most Recent Note - 11/19/2020 12:00:39 PM
G - Rebounding above its 50 DMA line ($72.84) with today's gain backed by light volume. Found support when testing the prior low ($63.32 on 9/21/20). Recently noted that it reported Sep '20 quarterly earnings +14% on +19% sales revenues versus the year ago period, below the +25% minimum guideline (C criteria) raising fundamental concerns.
>>> FEATURED STOCK ARTICLE : Rebound Above 50-Day Moving Average Helped Technical Stance - 11/4/2020 |
View all notes |
Set NEW NOTE alert |
Company Profile |
SEC
News |
Chart |
Request a new note
C
A
S
I |
CLFD
-
NASDAQ
Clearfield Inc
TELECOMMUNICATIONS - Cables / Satalite Equipment
|
$23.68
|
+0.09
0.38% |
$23.75
|
43,679
46.97% of 50 DAV
50 DAV is 93,000
|
$25.97
-8.82%
|
11/17/2020
|
$22.06
|
PP = $26.07
|
|
MB = $27.37
|
 Most Recent Note - 11/25/2020 5:01:49 PM
Y - Posted a 4th consecutive small gain today on light volume. Recently found support at its 50 DMA line ($21.97). It has formed an advanced "ascending base" marked by 3 pullbacks of 10-20% after a big breakaway gap on 7/24/20. Subsequent gains above the pivot point marked by +40% above average volume are needed to trigger a proper technical buy signal. Reported earnings +57% on +14% sales revenues for the Sep '20 quarter versus the year ago period, its 3rd consecutive quarterly earnings comparison above the +25% minimum guideline (C criteria). Annual earnings (A criteria) history has improved after a downturn in FY '17.
>>> FEATURED STOCK ARTICLE : Formed Ascending Base Following Earlier Breakway Gap - 11/17/2020 |
View all notes |
Set NEW NOTE alert |
Company Profile |
SEC
News |
Chart |
Request a new note
C
A
S
I |
Symbol/Exchange
Company Name
Industry Group |
PRICE |
CHANGE
(%Change) |
Day High |
Volume
(% DAV)
(% 50 day avg vol) |
52 Wk Hi
% From Hi |
Featured
Date |
Price
Featured |
Pivot Featured |
|
Max Buy |
LGIH
-
NASDAQ
L G I Homes Inc
Bldg-Resident/Comml
|
$109.59
|
-0.58
-0.53% |
$111.78
|
185,491
69.73% of 50 DAV
50 DAV is 266,000
|
$132.98
-17.59%
|
10/1/2020
|
$123.17
|
PP = $124.04
|
|
MB = $130.24
|
Most Recent Note - 11/24/2020 5:23:25 PM
G - Still below its 50 DMA line ($116) which may act as resistance after damaging volume-driven losses, and the longer it lingers there the worse its outlook gets. A rebound above the 50 DMA line is needed for its outlook to improve. Reported Sep '20 quarterly earnings +27% on +11% sales revenues versus the year ago period.
>>> FEATURED STOCK ARTICLE : Rebound Toward 50-Day Average Which May Act as Resistance - 11/10/2020 |
View all notes |
Set NEW NOTE alert |
Company Profile |
SEC
News |
Chart |
Request a new note
C
A
S
I |
NOW
-
NYSE
Servicenow Inc
Computer Sftwr-Enterprse
|
$519.22
|
+4.53
0.88% |
$524.00
|
1,062,003
81.88% of 50 DAV
50 DAV is 1,297,000
|
$537.53
-3.41%
|
8/20/2020
|
$453.34
|
PP = $454.79
|
|
MB = $477.53
|
Most Recent Note - 11/24/2020 5:13:31 PM
G - Consolidating above its 50 DMA line ($498) and still perched very near its all-time high. Tested the prior low ($472 on 11/03/20) noted as important support where a damaging violation raises greater concerns. Recently reported Sep '20 quarterly earnings +22% on +30% sales revenues versus the year ago period, below the +25% minimum guideline (C criteria) of the fact-based investment system. See the latest FSU analysis for more details and a new an annotated graph.
>>> FEATURED STOCK ARTICLE : Consolidating Above 50-Day Average Still Perched Near All-Time High - 11/24/2020 |
View all notes |
Set NEW NOTE alert |
Company Profile |
SEC
News |
Chart |
Request a new note
C
A
S
I |
VEEV
-
NYSE
Veeva Systems Inc Cl A
Computer Sftwr-Medical
|
$268.36
|
+2.78
1.05% |
$271.56
|
672,898
79.16% of 50 DAV
50 DAV is 850,000
|
$313.99
-14.53%
|
10/6/2020
|
$287.71
|
PP = $298.86
|
|
MB = $313.80
|
Most Recent Note - 11/23/2020 1:05:34 PM
G - Faces resistance due to overhead supply up to the $314 area. Damaging volume-driven losses violated its 50 DMA line and briefly undercut the prior low ($263). A rebound above the 50 DMA line ($282) is needed to help its outlook improve.
>>> FEATURED STOCK ARTICLE : Weak Technical Action Raised Recent Concerns - 11/16/2020 |
View all notes |
Set NEW NOTE alert |
Company Profile |
SEC
News |
Chart |
Request a new note
C
A
S
I |
ALRM
-
NASDAQ
Alarm.com Holdings Inc
Security/Sfty
|
$73.04
|
+1.81
2.54% |
$73.08
|
411,836
114.72% of 50 DAV
50 DAV is 359,000
|
$79.38
-7.99%
|
11/6/2020
|
$71.88
|
PP = $74.76
|
|
MB = $78.50
|
Most Recent Note - 11/25/2020 5:02:53 PM
Y - Posted a 2nd consecutive gain today with near average volume. Previously noted - "Subsequent gains above the pivot point may help clinch a convincing technical buy signal. Reported earnings +32% on +24% sales revenues for the Sep '20 quarter versus the year ago period, an improvement after +3% earnings in the Jun quarter. Prior quarterly comparisons were near or above the +25% minimum earnings guideline (C criteria). Annual earnings (A criteria) growth has been strong, a good match with the fact-based investment system."
>>> FEATURED STOCK ARTICLE : Encountered Distributional Pressure as it Hit a New High - 11/9/2020 |
View all notes |
Set NEW NOTE alert |
Company Profile |
SEC
News |
Chart |
Request a new note
C
A
S
I |
TEAM
-
NASDAQ
Atlassian Corp Plc Cl A
Comp Sftwr-Spec Enterprs
|
$216.35
|
+2.85
1.33% |
$217.54
|
1,645,589
88.00% of 50 DAV
50 DAV is 1,870,000
|
$216.30
0.02%
|
10/12/2020
|
$193.77
|
PP = $199.60
|
|
MB = $209.58
|
Most Recent Note - 11/19/2020 1:16:56 PM
G - Consolidating above its 50 DMA line ($190) in recent weeks, perched not far off its all-time high. Found prompt support after undercutting the prior low ($180) but it has not formed a sound new base of sufficient length. Reported earnings +7% on +26% sales revenues for the Sep '20 quarter versus the year ago period, well below the +25% minimum earnings guideline (C criteria), raising concerns.
>>> FEATURED STOCK ARTICLE : Weak Technical Action Followed Disappointing Fundamental News - 11/2/2020 |
View all notes |
Set NEW NOTE alert |
Company Profile |
SEC
News |
Chart |
Request a new note
C
A
S
I |
Symbol/Exchange
Company Name
Industry Group |
PRICE |
CHANGE
(%Change) |
Day High |
Volume
(% DAV)
(% 50 day avg vol) |
52 Wk Hi
% From Hi |
Featured
Date |
Price
Featured |
Pivot Featured |
|
Max Buy |
YETI
-
NYSE
Yeti Holdings Inc
Leisure-Products
|
$63.58
|
+1.47
2.37% |
$64.11
|
772,069
59.57% of 50 DAV
50 DAV is 1,296,000
|
$63.12
0.73%
|
11/5/2020
|
$57.25
|
PP = $55.14
|
|
MB = $57.90
|
Most Recent Note - 11/25/2020 5:04:37 PM
G - Posted a 2nd consecutive gain today with light volume hitting another new all-time high. Its 50 DMA line ($51.86) defines near-term support above prior lows.
>>> FEATURED STOCK ARTICLE : Finished Strong After Breakout Gain Was Noted in Mid-Day Report - 11/5/2020 |
View all notes |
Set NEW NOTE alert |
Company Profile |
SEC
News |
Chart |
Request a new note
C
A
S
I |
BJ
-
NYSE
B J S Whlsl Club Hldgs
Retail-DiscountandVariety
|
$41.84
|
-1.38
-3.19% |
$43.49
|
1,575,845
66.16% of 50 DAV
50 DAV is 2,382,000
|
$47.46
-11.84%
|
11/19/2020
|
$42.97
|
PP = $47.56
|
|
MB = $49.94
|
Most Recent Note - 11/25/2020 5:00:12 PM
Y - Pulled back toward its 50 DMA line ($40.83) with a loss today on light volume. Facing some near-term resistance. Highlighted in yellow in the 11/19/20 mid-day report with pivot point cited based on its 8/26/20 high plus 10 cents. Subsequent volume-driven gains above the pivot point may trigger a technical buy signal. Reported Oct '20 quarterly results +124% on +16% sales revenues versus the year ago period, its 3rd consecutive strong quarterly comparison above the +25% minimum guideline (C criteria), helping it better match with the fundamental guidelines of the fact-based investment system. Annual earnings growth (A criteria) has been strong. Completed its new IPO at $17 on 6/28/19. Has a new CEO as of 2/03/20.
>>> FEATURED STOCK ARTICLE : Rebounding Near High With 3rd Strong Quarterly Report - 11/19/2020 |
View all notes |
Set NEW NOTE alert |
Company Profile |
SEC
News |
Chart |
Request a new note
C
A
S
I |
AAXN
-
NASDAQ
Axon Enterprise Inc
Security/Sfty
|
$127.74
|
+0.25
0.20% |
$128.23
|
430,832
77.35% of 50 DAV
50 DAV is 557,000
|
$130.41
-2.05%
|
11/6/2020
|
$122.75
|
PP = $113.00
|
|
MB = $118.65
|
Most Recent Note - 11/19/2020 4:19:57 PM
G - Posted a gain today with average volume for its 2nd best ever close. Recently reported Sep '20 quarterly earnings +43% on +27% sales revenues versus the year ago period. It broke out of a cup-with-high-handle base with volume drying up during the handle.
>>> FEATURED STOCK ARTICLE : Breakaway Gap From Cup-With-High-Handle Pattern - 11/6/2020 |
View all notes |
Set NEW NOTE alert |
Company Profile |
SEC
News |
Chart |
Request a new note
C
A
S
I |
QTWO
-
NYSE
Q2 Holdings Inc
Computer Sftwr-Financial
|
$116.00
|
+1.07
0.93% |
$116.39
|
336,235
85.12% of 50 DAV
50 DAV is 395,000
|
$116.95
-0.81%
|
11/12/2020
|
$105.14
|
PP = $106.54
|
|
MB = $111.87
|
Most Recent Note - 11/19/2020 4:18:29 PM
G - Hit a new all-time high while it rallied above the "max buy" level and its color code is changed to green after today's 4th consecutive gain backed by near average volume. Showed great earning increases with strong underlying sales revenues growth for the Jun and Sep '20 quarters versus the year ago periods. Annual earnings growth has been strong. Completed new Public Offerings on 6/06/19 and 5/13/20.
>>> FEATURED STOCK ARTICLE : Churning Action Near Prior High Indicative of Distributional Pressure - 11/12/2020 |
View all notes |
Set NEW NOTE alert |
Company Profile |
SEC
News |
Chart |
Request a new note
C
A
S
I |
|
|
|
THESE ARE NOT BUY RECOMMENDATIONS!
Comments contained in the body of this report are technical
opinions only. The material herein has been obtained
from sources believed to be reliable and accurate, however,
its accuracy and completeness cannot be guaranteed.
This site is not an investment advisor, hence it does
not endorse or recommend any securities or other investments.
Any recommendation contained in this report may not
be suitable for all investors and it is not to be deemed
an offer or solicitation on our part with respect to
the purchase or sale of any securities. All trademarks,
service marks and trade names appearing in this report
are the property of their respective owners, and are
likewise used for identification purposes only.
This report is a service available
only to active Paid Premium Members.
You may opt-out of receiving report notifications
at any time. Questions or comments may be submitted
by writing to Premium Membership Services 665 S.E. 10 Street, Suite 201 Deerfield Beach, FL 33441-5634 or by calling 1-800-965-8307
or 954-785-1121.
|
|
|