***Last / Change / Volume data in this table is the closing quote data***
Symbol/Exchange
Company Name
Industry Group |
PRICE |
CHANGE
(%Change) |
Day High |
Volume
(% DAV)
(% 50 day avg vol) |
52 Wk Hi
% From Hi |
Featured
Date |
Price
Featured |
Pivot Featured |
|
Max Buy |
BITA
-
NYSE
Bitauto Hldgs Ltd Ads
INTERNET - Internet Information Providers
|
$34.56
|
+0.49
1.44% |
$35.04
|
1,096,101
100.96% of 50 DAV
50 DAV is 1,085,700
|
$34.50
0.17%
|
9/24/2013
|
$16.40
|
PP = $17.31
|
|
MB = $18.18
|
Most Recent Note - 11/22/2013 8:09:33 PM
G - Rallied for another new high close today, getting more extended from any sound base. Prior high in the $28 area define initial support to watch on pullbacks.
>>> FEATURED STOCK ARTICLE : Consolidating After Getting Extended From Prior Base - 11/11/2013
View all notes |
Set NEW NOTE alert |
CANSLIM.net Company Profile |
SEC
News |
Chart |
Request a new note
C
A N
S L
I M


|
BLOX
-
NYSE
Infoblox Inc
COMPUTER HARDWARE - Networking and Communication Dev
|
$42.93
|
+0.81
1.92% |
$43.02
|
726,224
96.47% of 50 DAV
50 DAV is 752,800
|
$48.97
-12.33%
|
10/11/2013
|
$43.02
|
PP = $45.60
|
|
MB = $47.88
|
Most Recent Note - 11/22/2013 8:10:35 PM
G - Still sputtering below its 50 DMA line which has recently acted as resistance after triggering a technical sell signal. Disciplined investors limit losses by selling any stock that falls more than -7% from their purchase price.
>>> FEATURED STOCK ARTICLE : Volume Driven Losses Violated 50-Day Moving Average Line - 11/19/2013
View all notes |
Set NEW NOTE alert |
CANSLIM.net Company Profile |
SEC
News |
Chart |
Request a new note
C
A N
S L
I M
|
CELG
-
NASDAQ
Celgene Corp
DRUGS - Drug Manufacturers - Major
|
$163.96
|
+0.63
0.39% |
$165.74
|
3,305,416
110.42% of 50 DAV
50 DAV is 2,993,500
|
$164.00
-0.02%
|
9/12/2013
|
$149.50
|
PP = $150.02
|
|
MB = $157.52
|
Most Recent Note - 11/22/2013 8:12:14 PM
G - Rallied for new 52-week and all-time highs with above average volume behind today's 7th consecutive gain. The prior low ($142.10 on 11/07/13) is the next technical support level where a subsequent violation may trigger a more worrisome technical sell signal. Earnings +21% on +18% sales revenues for the Sep '13 quarter were below the +25% minimum guideline (C criteria) raising fundamental concerns.
>>> FEATURED STOCK ARTICLE : Testing 50-Day Average Following Sub Par Earnings Increase - 11/1/2013
View all notes |
Set NEW NOTE alert |
CANSLIM.net Company Profile |
SEC
News |
Chart |
Request a new note
C
A N
S L
I M
|
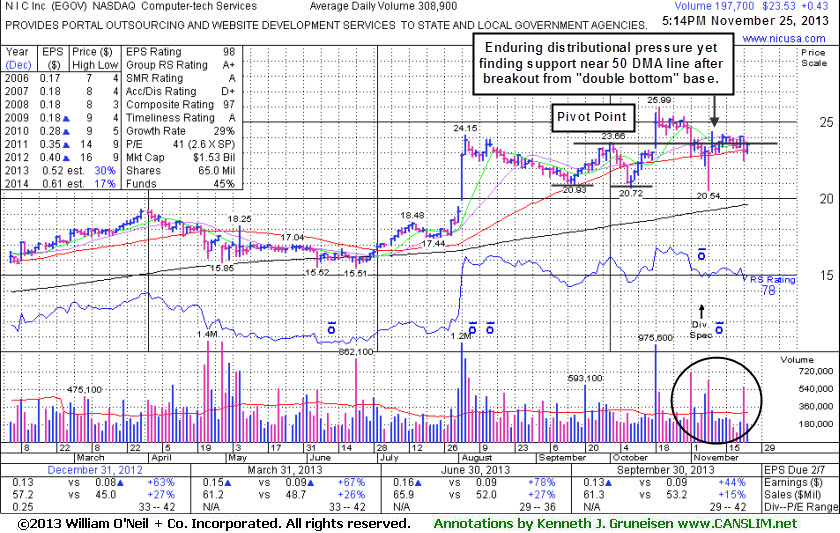
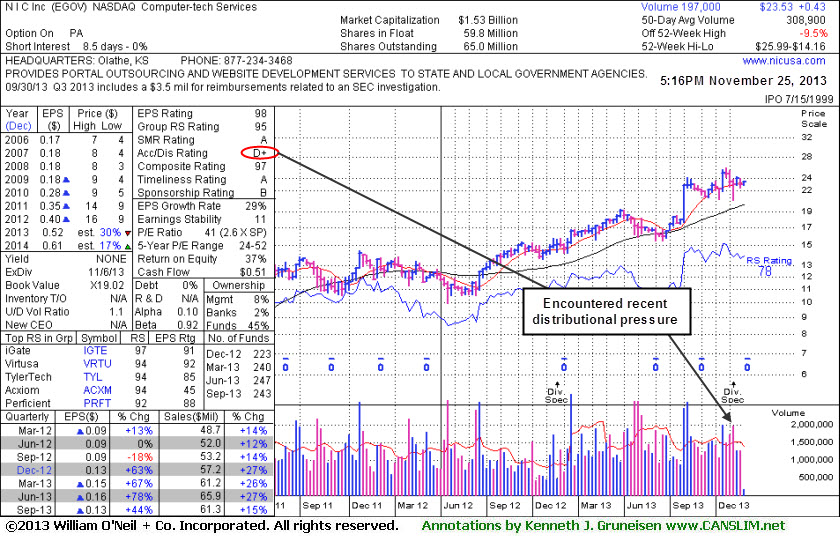
EGOV
-
NASDAQ
N I C Inc
INTERNET - Internet Software and Services
|
$23.53
|
+0.43
1.86% |
$23.64
|
198,448
64.24% of 50 DAV
50 DAV is 308,900
|
$25.99
-9.47%
|
10/18/2013
|
$25.17
|
PP = $23.66
|
|
MB = $24.84
|
 Most Recent Note - 11/25/2013 5:36:24 PM
G - Posted a small gain today with light volume after recent distributional pressure. Disciplined investors always limit losses by selling any stock that falls more than -7% from their purchase price. See the latest FSU analysis for more details and new annotated daily and weekly graphs.
>>> FEATURED STOCK ARTICLE : Finding Support Near 50-Day Average During Distributional Pressure - 11/25/2013
View all notes |
Set NEW NOTE alert |
CANSLIM.net Company Profile |
SEC
News |
Chart |
Request a new note
C
A N
S L
I M
|
FLT
-
NYSE
Fleetcor Technologies
DIVERSIFIED SERVICES - Business/Management Services
|
$120.72
|
-0.21
-0.17% |
$122.34
|
1,265,117
167.08% of 50 DAV
50 DAV is 757,200
|
$122.09
-1.12%
|
8/19/2013
|
$99.01
|
PP = $100.97
|
|
MB = $106.02
|
Most Recent Note - 11/22/2013 8:14:30 PM
G - Rallied with above average volume today for another new all-time high, getting more extended from any sound base. Its 50 DMA line ($111.97 now) defines near-term support to watch on pullbacks.
>>> FEATURED STOCK ARTICLE : Perched Near All-Time High Tallying Quiet Gains - 11/13/2013
View all notes |
Set NEW NOTE alert |
CANSLIM.net Company Profile |
SEC
News |
Chart |
Request a new note
C
A N
S L
I M
|
Symbol/Exchange
Company Name
Industry Group |
PRICE |
CHANGE
(%Change) |
Day High |
Volume
(% DAV)
(% 50 day avg vol) |
52 Wk Hi
% From Hi |
Featured
Date |
Price
Featured |
Pivot Featured |
|
Max Buy |
GNRC
-
NYSE
Generac Hldgs Inc
CONSUMER DURABLES - Electronic Equipment
|
$51.34
|
+0.90
1.78% |
$51.35
|
813,816
101.55% of 50 DAV
50 DAV is 801,400
|
$52.32
-1.87%
|
10/24/2013
|
$47.46
|
PP = $44.24
|
|
MB = $46.45
|
Most Recent Note - 11/20/2013 1:33:04 PM
G - Still holding its ground in a tight range near all-time highs, but it has not formed a sound base. Prior highs in the $44 area define near-term support to watch on pullbacks.
>>> FEATURED STOCK ARTICLE : Consolidating After "Breakway Gap" With 4 Times Average Volume - 10/30/2013
View all notes |
Set NEW NOTE alert |
CANSLIM.net Company Profile |
SEC
News |
Chart |
Request a new note
C
A N
S L
I M
|
HLF
-
NYSE
Herbalife Ltd
DRUGS - Nutrition and Weight Management
|
$70.55
|
-1.10
-1.54% |
$71.95
|
1,446,365
52.56% of 50 DAV
50 DAV is 2,751,700
|
$74.94
-5.86%
|
11/22/2013
|
$72.21
|
PP = $75.04
|
|
MB = $78.79
|
Most Recent Note - 11/22/2013 8:07:50 PM
Y - Subsequent volume-driven gains for new highs may trigger a technical buy signal. Its erratic history is of some concern, yet little resistance remains due to overhead supply after recent gains helped it rebound above its 50 DMA line. See the latest FSU analysis for more details and new annotated daily and weekly graphs.
>>> FEATURED STOCK ARTICLE : Perched Near Highs Following Rebound - 11/22/2013
View all notes |
Set NEW NOTE alert |
CANSLIM.net Company Profile |
SEC
News |
Chart |
Request a new note
C
A N
S L
I M
|
JAZZ
-
NASDAQ
Jazz Pharmaceuticals Plc
DRUGS - Biotechnology
|
$115.01
|
+1.67
1.47% |
$118.80
|
966,791
127.29% of 50 DAV
50 DAV is 759,500
|
$116.40
-1.19%
|
9/30/2013
|
$93.20
|
PP = $89.10
|
|
MB = $93.56
|
Most Recent Note - 11/20/2013 1:35:08 PM
G- Hitting another new 52-week high with today's 3rd consecutive "wedging" gain average or lighter volume while getting even more extended from any sound base. Disciplined investors avoid chasing stocks more than +5% above prior highs and always limit losses by selling any stock that falls more than -7% from their purchase price.
>>> FEATURED STOCK ARTICLE : Hovering Near All-Time Highs Following Volume-Driven Gains - 11/7/2013
View all notes |
Set NEW NOTE alert |
CANSLIM.net Company Profile |
SEC
News |
Chart |
Request a new note
C
A N
S L
I M
|
KORS
-
NYSE
Michael Kors Hldgs Ltd
RETAIL - Apparel Stores
|
$80.15
|
-0.49
-0.61% |
$81.20
|
2,660,690
58.22% of 50 DAV
50 DAV is 4,570,100
|
$83.13
-3.59%
|
8/6/2013
|
$69.66
|
PP = $66.28
|
|
MB = $69.59
|
Most Recent Note - 11/20/2013 1:37:31 PM
G - Volume totals have been cooling while hovering near all-time highs after volume-driven gains to new high territory. Prior highs in the $78 area define near-term support above its 50 DMA line.
>>> FEATURED STOCK ARTICLE : Hitting New Highs After Choppy Consolidation - 11/6/2013
View all notes |
Set NEW NOTE alert |
CANSLIM.net Company Profile |
SEC
News |
Chart |
Request a new note
C
A N
S L
I M
|
LOPE
-
NASDAQ
Grand Canyon Education
DIVERSIFIED SERVICES - Education and; Training Services
|
$44.70
|
-0.06
-0.13% |
$45.83
|
296,844
69.39% of 50 DAV
50 DAV is 427,800
|
$50.48
-11.45%
|
6/19/2013
|
$31.47
|
PP = $34.17
|
|
MB = $35.88
|
Most Recent Note - 11/20/2013 1:39:09 PM
G - Consolidating since its considerable volume-driven gain on 10/30/13 for a new high. Repeatedly noted - "Reported earnings +17% on +14% sales revenues for the Sep '13 quarter, its 2nd quarterly comparison with an earnings increase below the +25% minimum guideline (C criteria). Fundamental concerns remain while technical action has been reassuring."
>>> FEATURED STOCK ARTICLE : Formed Advanced Base But Fundamental Concerns Remain - 10/14/2013
View all notes |
Set NEW NOTE alert |
CANSLIM.net Company Profile |
SEC
News |
Chart |
Request a new note
C
A N
S L
I M
|
Symbol/Exchange
Company Name
Industry Group |
PRICE |
CHANGE
(%Change) |
Day High |
Volume
(% DAV)
(% 50 day avg vol) |
52 Wk Hi
% From Hi |
Featured
Date |
Price
Featured |
Pivot Featured |
|
Max Buy |
MRLN
-
NASDAQ
Marlin Business Services
DIVERSIFIED SERVICES - Rental and Leasing Services
|
$24.77
|
-0.18
-0.72% |
$25.18
|
13,178
53.79% of 50 DAV
50 DAV is 24,500
|
$28.64
-13.51%
|
9/9/2013
|
$23.75
|
PP = $24.03
|
|
MB = $25.23
|
Most Recent Note - 11/25/2013 1:32:37 PM
G - Gains have lacked volume conviction while it is still sputtering below its 50 DMA line. After damaging losses triggered worrisome technical sell signals it halted its slide near prior resistance in the $24 area. Needs gains above its 50 DMA line for its outlook to improve.
>>> FEATURED STOCK ARTICLE : Violated 50-Day Moving Average Line Raising Concerns - 11/14/2013
View all notes |
Set NEW NOTE alert |
CANSLIM.net Company Profile |
SEC
News |
Chart |
Request a new note
C
A N
S L
I M
|
NOAH
-
NYSE
Noah Holdings Ltd Ads
FINANCIAL SERVICES - Asset Management
|
$19.20
|
-1.18
-5.79% |
$20.90
|
1,366,167
166.95% of 50 DAV
50 DAV is 818,300
|
$25.51
-24.74%
|
10/15/2013
|
$19.10
|
PP = $18.33
|
|
MB = $19.25
|
Most Recent Note - 11/25/2013 1:24:55 PM
G - Down considerably today, slumping back toward its 50 DMA line which acted as support throughout its choppy ascent. A violation may trigger a technical sell signal. Caution is called for after a worrisome "negative reversal" occurred at its 52-week high, and it is extended from its latest base.
>>> FEATURED STOCK ARTICLE : 50-Day Average And Prior Highs Define Important Support - 11/20/2013
View all notes |
Set NEW NOTE alert |
CANSLIM.net Company Profile |
SEC
News |
Chart |
Request a new note
C
A N
S L
I M
|
OII
-
NYSE
Oceaneering Intl Inc
ENERGY - Oil and Gas Drilling and Explorati
|
$77.00
|
-2.54
-3.19% |
$79.39
|
1,589,984
234.75% of 50 DAV
50 DAV is 677,300
|
$87.64
-12.14%
|
10/16/2013
|
$83.08
|
PP = $84.74
|
|
MB = $88.98
|
Most Recent Note - 11/25/2013 1:28:42 PM
Down considerably today with higher volume behind its 6th consecutive loss. It will be dropped from the Featured Stocks list tonight. May likely find support at its 200 DMA line, but fundamental and technical deterioration raise serious concerns. Reported earnings +23% on +16% sales revenues, below the +25% minimum earnings guideline (C criteria).
>>> FEATURED STOCK ARTICLE : Forming Set-Up Above 50-Day Moving Average Line - 10/16/2013
View all notes |
Set NEW NOTE alert |
CANSLIM.net Company Profile |
SEC
News |
Chart |
Request a new note
C
A N
S L
I M
|
PCLN
-
NASDAQ
Priceline.Com Inc
INTERNET - Internet Software and Services
|
$1,159.17
|
+0.18
0.02% |
$1,165.58
|
361,008
55.66% of 50 DAV
50 DAV is 648,600
|
$1,163.98
-0.41%
|
9/13/2013
|
$966.82
|
PP = $995.08
|
|
MB = $1,044.83
|
Most Recent Note - 11/20/2013 12:57:07 PM
G - Hitting yet another new 52-week high with today's gap up gain. Found support at its 50 DMA line on prior pullbacks, however it has not formed any recent sound base pattern. Reported earnings +40% on +33% sales revenues for the Sep '13 quarter versus the year-ago period, improving after a slightly sub par Jun '13 report.
>>> FEATURED STOCK ARTICLE : Rallied to New Highs Following Pullback to 50-day Average - 10/29/2013
View all notes |
Set NEW NOTE alert |
CANSLIM.net Company Profile |
SEC
News |
Chart |
Request a new note
C
A N
S L
I M
|
PRAA
-
NASDAQ
Portfolio Recovery Assoc
DIVERSIFIED SERVICES - Business/Management Services
|
$57.10
|
-0.69
-1.19% |
$58.27
|
337,773
76.20% of 50 DAV
50 DAV is 443,300
|
$63.96
-10.73%
|
10/17/2013
|
$60.75
|
PP = $61.70
|
|
MB = $64.79
|
Most Recent Note - 11/21/2013 6:01:40 PM
G - A volume-driven gain today helped it rebound toward its 50 DMA line which is now downward sloping and may act as resistance. A rebound above that short-term average is needed for its outlook to improve. Meanwhile, its Relative Strength rank has slumped to 79, below the 80+ minimum guideline for buy candidates.
>>> FEATURED STOCK ARTICLE : Near 50-Day Moving Average Enduring Distributional Pressure - 11/5/2013
View all notes |
Set NEW NOTE alert |
CANSLIM.net Company Profile |
SEC
News |
Chart |
Request a new note
C
A N
S L
I M
|
Symbol/Exchange
Company Name
Industry Group |
PRICE |
CHANGE
(%Change) |
Day High |
Volume
(% DAV)
(% 50 day avg vol) |
52 Wk Hi
% From Hi |
Featured
Date |
Price
Featured |
Pivot Featured |
|
Max Buy |
PRLB
-
NYSE
Proto Labs Inc
MANUFACTURING - Small Tools and Accessories
|
$74.02
|
+0.86
1.18% |
$74.77
|
697,230
152.43% of 50 DAV
50 DAV is 457,400
|
$89.97
-17.73%
|
7/29/2013
|
$64.86
|
PP = $67.50
|
|
MB = $70.88
|
Most Recent Note - 11/22/2013 11:27:47 AM
G - Down considerably today, slumping near prior lows ($71.19 on 10/31/13, and $68.29 on 10/09/13) where violations may trigger additional technical sell signals. A rebound above its 50 DMA line is needed to help its outlook improve.
>>> FEATURED STOCK ARTICLE : Undercut 50-Day Moving Average Yet Found Prompt Support - 11/4/2013
View all notes |
Set NEW NOTE alert |
CANSLIM.net Company Profile |
SEC
News |
Chart |
Request a new note
C
A N
S L
I M
|
SFUN
-
NYSE
Soufun Hldgs Ltd Ads A
INTERNET - Internet Information Providers
|
$65.44
|
-2.38
-3.51% |
$67.99
|
692,917
45.83% of 50 DAV
50 DAV is 1,511,900
|
$71.62
-8.63%
|
10/17/2013
|
$58.02
|
PP = $53.87
|
|
MB = $56.56
|
Most Recent Note - 11/25/2013 1:34:48 PM
G - Pulling back from its all-time high with light volume behind today's loss. Volume totals have recently been cooling. Disciplined investors avoid chasing extended stocks. Prior highs in the $59 area define initial support to watch on pullbacks.
>>> FEATURED STOCK ARTICLE : Perched Near All-Time High After Testing Support - 11/8/2013
View all notes |
Set NEW NOTE alert |
CANSLIM.net Company Profile |
SEC
News |
Chart |
Request a new note
C
A N
S L
I M
|
SSNC
-
NASDAQ
S S & C Technologies
COMPUTER SOFTWARE and SERVICES - Application Software
|
$41.83
|
-0.15
-0.36% |
$42.45
|
155,905
36.21% of 50 DAV
50 DAV is 430,600
|
$42.54
-1.67%
|
10/22/2013
|
$39.17
|
PP = $40.04
|
|
MB = $42.04
|
Most Recent Note - 11/21/2013 6:08:00 PM
Y - Finished near the session high and at its "max buy" level with a gain today on higher but below average volume. Subsequent losses leading to a close below its old high closes in the $39.50 area would raise concerns and completely negate its recent breakout.
>>> FEATURED STOCK ARTICLE : Volume Totals Cooling Following Recent Volume-Driven Breakout - 11/12/2013
View all notes |
Set NEW NOTE alert |
CANSLIM.net Company Profile |
SEC
News |
Chart |
Request a new note
C
A N
S L
I M
|
SSYS
-
NASDAQ
Stratasys Ltd
COMPUTER HARDWARE - Computer Peripherals
|
$117.78
|
+0.81
0.69% |
$119.38
|
943,544
74.27% of 50 DAV
50 DAV is 1,270,400
|
$134.00
-12.10%
|
10/11/2013
|
$102.94
|
PP = $105.38
|
|
MB = $110.65
|
Most Recent Note - 11/21/2013 6:13:14 PM
G - Gain today halted its slide after 2 consecutive volume-driven losses, bouncing back from a test of support at its 50 DMA line. More damaging losses would raise greater concerns and trigger worrisome technical sell signals. Reported earnings +13% on +153% sales revenues, below the +25% minimum earnings guideline (C criteria) raising fundamental concerns.
>>> FEATURED STOCK ARTICLE : Rallying For New Highs Despite Fundamental Flaw Raising Concern - 11/18/2013
View all notes |
Set NEW NOTE alert |
CANSLIM.net Company Profile |
SEC
News |
Chart |
Request a new note
C
A N
S L
I M
|
STMP
-
NASDAQ
Stamps.Com Inc
INTERNET - Internet Software and Services
|
$47.46
|
-0.18
-0.38% |
$47.95
|
88,938
81.00% of 50 DAV
50 DAV is 109,800
|
$49.40
-3.93%
|
9/24/2013
|
$45.54
|
PP = $46.57
|
|
MB = $48.90
|
Most Recent Note - 11/21/2013 5:35:19 PM
G - Rallied to match its best-ever close today. Recently held its ground at its 50 DMA line, where more damaging losses would raise greater concerns. Earnings were +24% on +7% sales revenues for the Sep '13 quarter, just below the +25% minimum earnings guideline (C criteria).
>>> FEATURED STOCK ARTICLE : Fundamental Flaw May Prompt Disciplined Investors to Look Elsewhere - 10/31/2013
View all notes |
Set NEW NOTE alert |
CANSLIM.net Company Profile |
SEC
News |
Chart |
Request a new note
C
A N
S L
I M
|
Symbol/Exchange
Company Name
Industry Group |
PRICE |
CHANGE
(%Change) |
Day High |
Volume
(% DAV)
(% 50 day avg vol) |
52 Wk Hi
% From Hi |
Featured
Date |
Price
Featured |
Pivot Featured |
|
Max Buy |
ULTI
-
NASDAQ
Ultimate Software Group
INTERNET - Internet Software and Services
|
$154.48
|
-0.89
-0.57% |
$156.14
|
50,123
33.53% of 50 DAV
50 DAV is 149,500
|
$162.88
-5.16%
|
10/16/2013
|
$142.95
|
PP = $151.18
|
|
MB = $158.74
|
Most Recent Note - 11/21/2013 5:30:47 PM
Y - Volume totals have generally been cooling while holding its ground near its 52-week high yet below its "max buy" level. Prior highs and its 50 DMA line define near-term support. See the latest FSU analysis for more details and new annotated daily and weekly graphs.
>>> FEATURED STOCK ARTICLE : Consolidating Above 50 DMA Line and Prior Highs Defining Support - 11/21/2013
View all notes |
Set NEW NOTE alert |
CANSLIM.net Company Profile |
SEC
News |
Chart |
Request a new note
C
A N
S L
I M
|
VRX
-
NYSE
Valeant Pharmaceuticals
DRUGS - Drug Manufacturers - Other
|
$108.99
|
-0.56
-0.51% |
$111.39
|
783,160
65.82% of 50 DAV
50 DAV is 1,189,800
|
$115.40
-5.55%
|
9/11/2013
|
$100.26
|
PP = $105.50
|
|
MB = $110.78
|
Most Recent Note - 11/20/2013 1:41:17 PM
Y - Consolidating in a tight range near its 50 DMA line with volume totals cooling. Recent lows in the $102 area define near-term support where subsequent violations may trigger technical sell signals. Recently reported earnings +24% on +74% sales revenues for the Sep '13 quarter, a notch below the +25% minimum guideline (C criteria).
>>> FEATURED STOCK ARTICLE : Recent Lows Define Support to Watch Below 50 Day Average - 11/15/2013
View all notes |
Set NEW NOTE alert |
CANSLIM.net Company Profile |
SEC
News |
Chart |
Request a new note
C
A N
S L
I M
|
YNDX
-
NASDAQ
Yandex N V Class A
INTERNET - Internet Information Providers
|
$38.73
|
+0.26
0.68% |
$38.92
|
1,599,670
59.77% of 50 DAV
50 DAV is 2,676,400
|
$42.00
-7.79%
|
9/5/2013
|
$34.24
|
PP = $34.79
|
|
MB = $36.53
|
Most Recent Note - 11/21/2013 5:48:35 PM
G - Rebounded and closed back above its 50 DMA line today helping its technical stance improve. Prior lows ($35.59 on 11/08/13 and $34.31 on 10/08/13) defines the next important chart support levels to watch.
>>> FEATURED STOCK ARTICLE : Consolidating After Getting Extended From Sound Base - 10/28/2013
View all notes |
Set NEW NOTE alert |
CANSLIM.net Company Profile |
SEC
News |
Chart |
Request a new note
C
A N
S L
I M
|