You are not logged in.
This means you
CAN ONLY VIEW reports that were published prior to Monday, February 26, 2024.
You
MUST UPGRADE YOUR MEMBERSHIP if you want to see any current reports.
AFTER MARKET UPDATE - TUESDAY, NOVEMBER 24TH, 2020
Previous After Market Report Next After Market Report >>>
|
|
|
|
DOW |
+454.97 |
30,046.24 |
+1.54% |
|
Volume |
1,202,168,849 |
+22% |
|
Volume |
6,243,929,900 |
+17% |
|
NASDAQ |
+155.40 |
12,036.03 |
+1.31% |
|
Advancers |
2,350 |
76% |
|
Advancers |
2,402 |
68% |
|
S&P 500 |
+57.82 |
3,635.41 |
+1.62% |
|
Decliners |
738 |
24% |
|
Decliners |
1,149 |
32% |
|
Russell 2000 |
+35.23 |
1,853.53 |
+1.94% |
|
52 Wk Highs |
286 |
|
|
52 Wk Highs |
361 |
|
|
S&P 600 |
+26.38 |
1,069.41 |
+2.53% |
|
52 Wk Lows |
4 |
|
|
52 Wk Lows |
17 |
|
|
 |
Major Indices Surge With Greater Buying Demand
Kenneth J. Gruneisen - Passed the CAN SLIM® Master's Exam
The Dow jumped 454 points to close above 30,000 for the first time. The S&P 500 rallied 1.6% to a fresh record high, while the Nasdaq Composite advanced 1.3%. The reported volume totals were higher than the prior session on the NYSE and on the Nasdaq exchange, indicative of greater institutional buying demand. Breadth was clearly positive as advancers led decliners by more than a 3-1 margin on the NYSE and by more than 2-1 on the Nasdaq exchange. There were 91 high-ranked companies from the Leaders List that hit new 52-week highs and were listed on the BreakOuts Page, versus the total of 69 on the prior session. New 52-week highs totals expanded and easily outnumbered new 52-week lows totals. The major indices confirmed a new uptrend (M criteria) with recent follow-through gains backed by higher volume and more leadership. Investors are reminded to always make buying and selling decisions based based on the strict criteria and rules of the fact-based investment system. 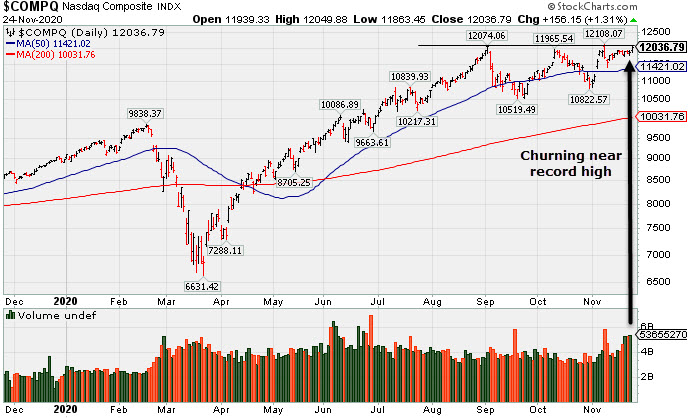 PICTURED: The Nasdaq Composite Index is churning higher volume recently while hovering near its record high.
Stocks finished firmly higher on Tuesday, as easing post-election uncertainty and continued COVID vaccine optimism boosted investor sentiment. Yesterday, the General Services Administration said it would make federal resources available for the Biden transition process. Further, President-elect Joe Biden said he would nominate former Fed Chair Janet Yellen to be Treasury secretary, which was seen as a positive on Wall Street.
Ten of 11 S&P 500 sectors ended in positive territory, with eight groups adding more than 1%. Energy shares paced the gains for a second consecutive day, with WTI crude trading near $45/barrel for the first time since March. The Real Estate sector was the lone group that finished the session lower. In earnings, Best Buy (BBY -6.96%) fell as the company beat Wall Street earnings and revenue forecasts but failed to provide forward guidance. Dollar Tree (DLTR +14.08%) rose after the discount retailer bested consensus profit, sales, and same-store-sales projections.
On the data front, the Conference Board’s consumer confidence declined more than expected to 96.1 in November from the prior month’s upwardly revised 101.4 reading. A separate release from S&P/Case-Shiller showed U.S. home prices in the 20 largest U.S. cities jumped 1.3% in September, nearly doubling consensus estimates of 0.7%, while the year-over-year figure climbed 6.6%. Amid the risk-on mood, COMEX gold slipped 1.7% to $1805.80/ounce. The Treasury yield curve steepened, with the yield on the 10-year note rising three basis points to 0.88%. |
 Kenneth J. Gruneisen started out as a licensed stockbroker in August 1987, a couple of months prior to the historic stock market crash that took the Dow Jones Industrial Average down -22.6% in a single day. He has published daily fact-based fundamental and technical analysis on high-ranked stocks online for two decades. Through FACTBASEDINVESTING.COM, Kenneth provides educational articles, news, market commentary, and other information regarding proven investment systems that work in good times and bad.
Comments contained in the body of this report are technical opinions only and are not necessarily those of Gruneisen Growth Corp. The material herein has been obtained from sources believed to be reliable and accurate, however, its accuracy and completeness cannot be guaranteed. Our firm, employees, and customers may effect transactions, including transactions contrary to any recommendation herein, or have positions in the securities mentioned herein or options with respect thereto. Any recommendation contained in this report may not be suitable for all investors and it is not to be deemed an offer or solicitation on our part with respect to the purchase or sale of any securities. |
|
 |
Energy and Financial Indexes Posted Standout Gains
Kenneth J. Gruneisen - Passed the CAN SLIM® Master's Exam
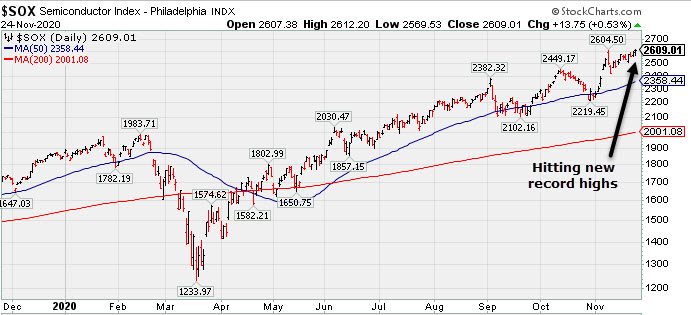
The Bank Index ($BKX +5.32%) and Broker/Dealer Index ($XBD +2.84%) posted big gains that were a positive influence on the major inddices while the Retail Index ($RLX +1.02%) also notched a gain. The Oil Services Index ($OSX +4.80%) and Integrated Oil Index ($XOI +5.01%) again were standout gainers, meanwhile the Gold & Silver Index ($XAU -1.30%) again lost ground. The tech sector was mostly quiet as the Networking Index ($NWX +1.53%) led the Semiconductor Index ($SOX +0.55%) and the Biotech Index ($BTK +0.25%) higher.
PICTURED: The Semiconductor Index ($SOX +0.55%) has been hitting new record highs.
| Oil Services |
$OSX |
43.27 |
+1.98 |
+4.80% |
-44.73% |
| Integrated Oil |
$XOI |
825.47 |
+39.38 |
+5.01% |
-35.03% |
| Semiconductor |
$SOX |
2,609.43 |
+14.18 |
+0.55% |
+41.08% |
| Networking |
$NWX |
648.37 |
+9.76 |
+1.53% |
+11.13% |
| Broker/Dealer |
$XBD |
351.44 |
+9.72 |
+2.84% |
+21.03% |
| Retail |
$RLX |
3,461.13 |
+35.03 |
+1.02% |
+41.31% |
| Gold & Silver |
$XAU |
130.82 |
-1.72 |
-1.30% |
+22.35% |
| Bank |
$BKX |
95.07 |
+4.81 |
+5.32% |
-16.13% |
| Biotech |
$BTK |
5,427.96 |
+13.77 |
+0.25% |
+7.11% |
|
|
|
 |
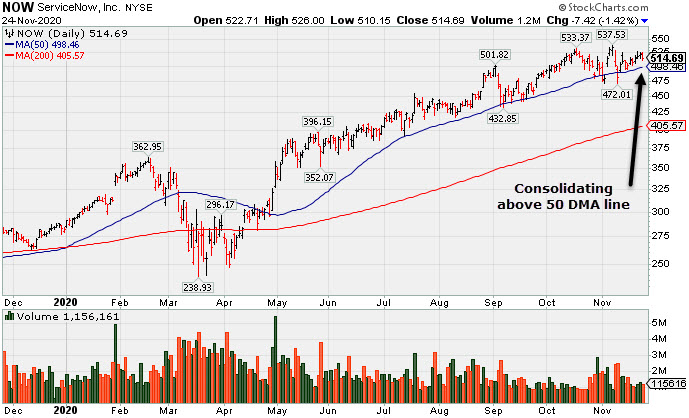
Consolidating Above 50-Day Average Still Perched Near All-Time High
Kenneth J. Gruneisen - Passed the CAN SLIM® Master's Exam
ServiceNow Inc (NOW -$7.42 or -1.42% to $514.69) is consolidating above its 50-day moving average (DMA) line ($498.46) while still hovering near its all-time high. It recently retested the prior low ($472 on 11/03/20) noted as important support where a damaging violation raises greater concerns.
Recently it reported Sep '20 quarterly earnings +22% on +30% sales revenues versus the year ago period, below the +25% minimum guideline (C criteria) of the fact-based investment system. It reported Jun '20 quarterly earnings +73% on +28% sales revenues versus the year ago period and prior results had been routinely above the +25% minimum earnings guideline (C criteria). It has an Earnings Per Share Rating of 98. The Computer Software - Enterprise group has a Group Relative Strength Rating of 71, a reassuring sign concerning the L criteria. NOW has a new CEO as of 1/01/20.
NOW traded up as much as +56.7% since first highlighted in yellow in the 4/30/20 mid-day report with a pivot point based on its 2/19/20 high plus 10 cents (read here). It was last shown in this FSU section on 10/29/20 with an annotated graph under the headline, "Found Prompt Support at 50 DMA Line After Earnings News". The number of top-rated funds owning its shares rose from 1,030 in Jun '17 to 2.455 in Sep '20, a reassuring sign concerning the I criteria. It has a Timeliness Rating of B and a Sponsorship Rating of A. Its current Up/Down Volume Ratio of 1.1 is an unbiased indication its shares have been under slight accumulation over the past 50 days. |
|
|
Color Codes Explained :
Y - Better candidates highlighted by our
staff of experts.
G - Previously featured
in past reports as yellow but may no longer be buyable under the
guidelines.
***Last / Change / Volume data in this table is the closing quote data***
Symbol/Exchange
Company Name
Industry Group |
PRICE |
CHANGE
(%Change) |
Day High |
Volume
(% DAV)
(% 50 day avg vol) |
52 Wk Hi
% From Hi |
Featured
Date |
Price
Featured |
Pivot Featured |
|
Max Buy |
 CRL
-
NYSE
CRL
-
NYSE
Charles River Labs Intl
DRUGS - Biotechnology
|
$224.68
|
-7.33
-3.16% |
$232.28
|
265,374
78.28% of 50 DAV
50 DAV is 339,000
|
$257.88
-12.87%
|
7/15/2020
|
$192.66
|
PP = $189.95
|
|
MB = $199.45
|
 Most Recent Note - 11/24/2020 5:21:28 PM
G - Today's loss was backed by light volume but it violated an upward trendline and its 50 DMA line ($232) raising greater concerns while triggering worrisome technical sell signals. Only a prompt rebound above the 50 DMA line would help its outlook improve. Reported Sep '20 quarterly earnings +38% on +11% sales revenues versus the year ago period, above the +25% minimum earnings guideline (C criteria).
>>> FEATURED STOCK ARTICLE : Consolidating Near Important Support Levels - 11/23/2020 |
View all notes |
Set NEW NOTE alert |
Company Profile |
SEC
News |
Chart |
Request a new note
C
A
S
I |
AMD
-
NASDAQ
Advanced Micro Devices
ELECTRONICS - Semiconductor - Broad Line
|
$85.07
|
-0.24
-0.28% |
$86.11
|
36,283,706
71.63% of 50 DAV
50 DAV is 50,652,000
|
$94.28
-9.77%
|
11/18/2020
|
$82.54
|
PP = $88.72
|
|
MB = $93.16
|
Most Recent Note - 11/24/2020 5:17:34 PM
Y - Volume totals are cooling while still consolidating above its 50 DMA line ($81.23). Prior lows in the $73 area define important near term support. Subsequent gains above the pivot point backed by at least +40% above average volume are needed to trigger trigger a technical buy signal.
>>> FEATURED STOCK ARTICLE : Weak Action Raised Concern While Testing Recent Low - 11/3/2020 |
View all notes |
Set NEW NOTE alert |
Company Profile |
SEC
News |
Chart |
Request a new note
C
A
S
I |
TER
-
NASDAQ
Teradyne Inc
ELECTRONICS - Semiconductor Equipment and Mate
|
$108.99
|
+0.77
0.71% |
$109.50
|
1,645,777
76.02% of 50 DAV
50 DAV is 2,165,000
|
$108.65
0.31%
|
10/21/2020
|
$92.22
|
PP = $93.54
|
|
MB = $98.22
|
Most Recent Note - 11/23/2020 5:24:15 PM
G - Posted another gain today with below average volume for new all-time high. Reported earnings +53% on +41% sales revenues for the Sep '20 quarter versus the year ago period, its 4th consecutive quarterly comparison with earnings above the +25% minimum earnings guideline (C criteria). Sequential comparisons show encouraging acceleration in its sales revenues growth rate. Its annual earnings (A criteria) history has been strong.
>>> FEATURED STOCK ARTICLE : Recent Gains for New Highs Lacked Great Volume Conviction - 11/11/2020 |
View all notes |
Set NEW NOTE alert |
Company Profile |
SEC
News |
Chart |
Request a new note
C
A
S
I |
TREX
-
NYSE
Trex Company Inc
MATERIALS and CONSTRUCTION - General Building Materials
|
$74.00
|
-2.18
-2.86% |
$76.89
|
866,764
111.55% of 50 DAV
50 DAV is 777,000
|
$81.23
-8.90%
|
6/26/2020
|
$54.53
|
PP = $66.47
|
|
MB = $69.79
|
Most Recent Note - 11/19/2020 12:00:39 PM
G - Rebounding above its 50 DMA line ($72.84) with today's gain backed by light volume. Found support when testing the prior low ($63.32 on 9/21/20). Recently noted that it reported Sep '20 quarterly earnings +14% on +19% sales revenues versus the year ago period, below the +25% minimum guideline (C criteria) raising fundamental concerns.
>>> FEATURED STOCK ARTICLE : Rebound Above 50-Day Moving Average Helped Technical Stance - 11/4/2020 |
View all notes |
Set NEW NOTE alert |
Company Profile |
SEC
News |
Chart |
Request a new note
C
A
S
I |
CLFD
-
NASDAQ
Clearfield Inc
TELECOMMUNICATIONS - Cables / Satalite Equipment
|
$23.59
|
+0.25
1.07% |
$23.74
|
53,994
57.44% of 50 DAV
50 DAV is 94,000
|
$25.97
-9.16%
|
11/17/2020
|
$22.06
|
PP = $26.07
|
|
MB = $27.37
|
Most Recent Note - 11/23/2020 5:25:48 PM
Y - Recently found support at its 50 DMA line ($21.88). More damaging losses would raise concerns. It was highlighted in yellow with pivot point cited based on its 11/09/20 high plus 10 cents in the earlier mid-day report. It has formed an advanced "ascending base" marked by 3 pullbacks of 10-20% after a big breakaway gap on 7/24/20. Subsequent gains above the pivot point marked by +40% above average volume are needed to trigger a proper technical buy signal. Reported earnings +57% on +14% sales revenues for the Sep '20 quarter versus the year ago period, its 3rd consecutive quarterly earnings comparison above the +25% minimum guideline (C criteria). Annual earnings (A criteria) history has improved after a downturn in FY '17.
>>> FEATURED STOCK ARTICLE : Formed Ascending Base Following Earlier Breakway Gap - 11/17/2020 |
View all notes |
Set NEW NOTE alert |
Company Profile |
SEC
News |
Chart |
Request a new note
C
A
S
I |
Symbol/Exchange
Company Name
Industry Group |
PRICE |
CHANGE
(%Change) |
Day High |
Volume
(% DAV)
(% 50 day avg vol) |
52 Wk Hi
% From Hi |
Featured
Date |
Price
Featured |
Pivot Featured |
|
Max Buy |
LGIH
-
NASDAQ
L G I Homes Inc
Bldg-Resident/Comml
|
$110.17
|
-3.63
-3.19% |
$115.03
|
203,179
76.38% of 50 DAV
50 DAV is 266,000
|
$132.98
-17.15%
|
10/1/2020
|
$123.17
|
PP = $124.04
|
|
MB = $130.24
|
Most Recent Note - 11/24/2020 5:23:25 PM
G - Still below its 50 DMA line ($116) which may act as resistance after damaging volume-driven losses, and the longer it lingers there the worse its outlook gets. A rebound above the 50 DMA line is needed for its outlook to improve. Reported Sep '20 quarterly earnings +27% on +11% sales revenues versus the year ago period.
>>> FEATURED STOCK ARTICLE : Rebound Toward 50-Day Average Which May Act as Resistance - 11/10/2020 |
View all notes |
Set NEW NOTE alert |
Company Profile |
SEC
News |
Chart |
Request a new note
C
A
S
I |
NOW
-
NYSE
Servicenow Inc
Computer Sftwr-Enterprse
|
$514.69
|
-7.42
-1.42% |
$526.00
|
1,155,730
89.18% of 50 DAV
50 DAV is 1,296,000
|
$537.53
-4.25%
|
8/20/2020
|
$453.34
|
PP = $454.79
|
|
MB = $477.53
|
Most Recent Note - 11/24/2020 5:13:31 PM
G - Consolidating above its 50 DMA line ($498) and still perched very near its all-time high. Tested the prior low ($472 on 11/03/20) noted as important support where a damaging violation raises greater concerns. Recently reported Sep '20 quarterly earnings +22% on +30% sales revenues versus the year ago period, below the +25% minimum guideline (C criteria) of the fact-based investment system. See the latest FSU analysis for more details and a new an annotated graph.
>>> FEATURED STOCK ARTICLE : Consolidating Above 50-Day Average Still Perched Near All-Time High - 11/24/2020 |
View all notes |
Set NEW NOTE alert |
Company Profile |
SEC
News |
Chart |
Request a new note
C
A
S
I |
VEEV
-
NYSE
Veeva Systems Inc Cl A
Computer Sftwr-Medical
|
$265.58
|
-6.66
-2.45% |
$272.95
|
1,299,464
156.00% of 50 DAV
50 DAV is 833,000
|
$313.99
-15.42%
|
10/6/2020
|
$287.71
|
PP = $298.86
|
|
MB = $313.80
|
Most Recent Note - 11/23/2020 1:05:34 PM
G - Faces resistance due to overhead supply up to the $314 area. Damaging volume-driven losses violated its 50 DMA line and briefly undercut the prior low ($263). A rebound above the 50 DMA line ($282) is needed to help its outlook improve.
>>> FEATURED STOCK ARTICLE : Weak Technical Action Raised Recent Concerns - 11/16/2020 |
View all notes |
Set NEW NOTE alert |
Company Profile |
SEC
News |
Chart |
Request a new note
C
A
S
I |
ALRM
-
NASDAQ
Alarm.com Holdings Inc
Security/Sfty
|
$71.23
|
+3.00
4.40% |
$71.38
|
467,447
132.05% of 50 DAV
50 DAV is 354,000
|
$79.38
-10.27%
|
11/6/2020
|
$71.88
|
PP = $74.76
|
|
MB = $78.50
|
Most Recent Note - 11/24/2020 5:15:03 PM
Y - Posted a solid gain today with above average volume. Previously noted - "Subsequent gains above the pivot point may help clinch a convincing technical buy signal. Reported earnings +32% on +24% sales revenues for the Sep '20 quarter versus the year ago period, an improvement after +3% earnings in the Jun quarter. Prior quarterly comparisons were near or above the +25% minimum earnings guideline (C criteria). Annual earnings (A criteria) growth has been strong, a good match with the fact-based investment system."
>>> FEATURED STOCK ARTICLE : Encountered Distributional Pressure as it Hit a New High - 11/9/2020 |
View all notes |
Set NEW NOTE alert |
Company Profile |
SEC
News |
Chart |
Request a new note
C
A
S
I |
TEAM
-
NASDAQ
Atlassian Corp Plc Cl A
Comp Sftwr-Spec Enterprs
|
$213.50
|
+2.45
1.16% |
$214.34
|
1,577,381
84.94% of 50 DAV
50 DAV is 1,857,000
|
$216.30
-1.29%
|
10/12/2020
|
$193.77
|
PP = $199.60
|
|
MB = $209.58
|
Most Recent Note - 11/19/2020 1:16:56 PM
G - Consolidating above its 50 DMA line ($190) in recent weeks, perched not far off its all-time high. Found prompt support after undercutting the prior low ($180) but it has not formed a sound new base of sufficient length. Reported earnings +7% on +26% sales revenues for the Sep '20 quarter versus the year ago period, well below the +25% minimum earnings guideline (C criteria), raising concerns.
>>> FEATURED STOCK ARTICLE : Weak Technical Action Followed Disappointing Fundamental News - 11/2/2020 |
View all notes |
Set NEW NOTE alert |
Company Profile |
SEC
News |
Chart |
Request a new note
C
A
S
I |
Symbol/Exchange
Company Name
Industry Group |
PRICE |
CHANGE
(%Change) |
Day High |
Volume
(% DAV)
(% 50 day avg vol) |
52 Wk Hi
% From Hi |
Featured
Date |
Price
Featured |
Pivot Featured |
|
Max Buy |
YETI
-
NYSE
Yeti Holdings Inc
Leisure-Products
|
$62.11
|
+0.48
0.78% |
$63.00
|
886,838
68.48% of 50 DAV
50 DAV is 1,295,000
|
$63.12
-1.60%
|
11/5/2020
|
$57.25
|
PP = $55.14
|
|
MB = $57.90
|
Most Recent Note - 11/19/2020 12:08:13 PM
G - Rebounding impressively and its color code is changed to green after rising above its "max buy" level again challenging its all-time high after an abrupt pullback. Its 50 DMA line ($50.72) defines near-term support above prior lows
>>> FEATURED STOCK ARTICLE : Finished Strong After Breakout Gain Was Noted in Mid-Day Report - 11/5/2020 |
View all notes |
Set NEW NOTE alert |
Company Profile |
SEC
News |
Chart |
Request a new note
C
A
S
I |
BJ
-
NYSE
B J S Whlsl Club Hldgs
Retail-DiscountandVariety
|
$43.22
|
-0.38
-0.87% |
$44.42
|
3,788,908
161.92% of 50 DAV
50 DAV is 2,340,000
|
$47.46
-8.93%
|
11/19/2020
|
$42.97
|
PP = $47.56
|
|
MB = $49.94
|
Most Recent Note - 11/24/2020 12:31:25 PM
Y - Consolidating above its 50 DMA line ($40.75) annd still facing some near-term resistance. Highlighted in yellow in the 11/19/20 mid-day report with pivot point cited based on its 8/26/20 high plus 10 cents. Subsequent volume-driven gains above the pivot point may trigger a technical buy signal. Reported Oct '20 quarterly results +124% on +16% sales revenues versus the year ago period, its 3rd consecutive strong quarterly comparison above the +25% minimum guideline (C criteria), helping it better match with the fundamental guidelines of the fact-based investment system. Annual earnings growth (A criteria) has been strong. Completed its new IPO at $17 on 6/28/19. Has a new CEO as of 2/03/20.
>>> FEATURED STOCK ARTICLE : Rebounding Near High With 3rd Strong Quarterly Report - 11/19/2020 |
View all notes |
Set NEW NOTE alert |
Company Profile |
SEC
News |
Chart |
Request a new note
C
A
S
I |
AAXN
-
NASDAQ
Axon Enterprise Inc
Security/Sfty
|
$127.49
|
+0.99
0.78% |
$130.41
|
404,749
72.80% of 50 DAV
50 DAV is 556,000
|
$128.39
-0.70%
|
11/6/2020
|
$122.75
|
PP = $113.00
|
|
MB = $118.65
|
Most Recent Note - 11/19/2020 4:19:57 PM
G - Posted a gain today with average volume for its 2nd best ever close. Recently reported Sep '20 quarterly earnings +43% on +27% sales revenues versus the year ago period. It broke out of a cup-with-high-handle base with volume drying up during the handle.
>>> FEATURED STOCK ARTICLE : Breakaway Gap From Cup-With-High-Handle Pattern - 11/6/2020 |
View all notes |
Set NEW NOTE alert |
Company Profile |
SEC
News |
Chart |
Request a new note
C
A
S
I |
QTWO
-
NYSE
Q2 Holdings Inc
Computer Sftwr-Financial
|
$114.93
|
-0.29
-0.25% |
$116.22
|
328,807
83.45% of 50 DAV
50 DAV is 394,000
|
$116.95
-1.73%
|
11/12/2020
|
$105.14
|
PP = $106.54
|
|
MB = $111.87
|
Most Recent Note - 11/19/2020 4:18:29 PM
G - Hit a new all-time high while it rallied above the "max buy" level and its color code is changed to green after today's 4th consecutive gain backed by near average volume. Showed great earning increases with strong underlying sales revenues growth for the Jun and Sep '20 quarters versus the year ago periods. Annual earnings growth has been strong. Completed new Public Offerings on 6/06/19 and 5/13/20.
>>> FEATURED STOCK ARTICLE : Churning Action Near Prior High Indicative of Distributional Pressure - 11/12/2020 |
View all notes |
Set NEW NOTE alert |
Company Profile |
SEC
News |
Chart |
Request a new note
C
A
S
I |
|
|
|
THESE ARE NOT BUY RECOMMENDATIONS!
Comments contained in the body of this report are technical
opinions only. The material herein has been obtained
from sources believed to be reliable and accurate, however,
its accuracy and completeness cannot be guaranteed.
This site is not an investment advisor, hence it does
not endorse or recommend any securities or other investments.
Any recommendation contained in this report may not
be suitable for all investors and it is not to be deemed
an offer or solicitation on our part with respect to
the purchase or sale of any securities. All trademarks,
service marks and trade names appearing in this report
are the property of their respective owners, and are
likewise used for identification purposes only.
This report is a service available
only to active Paid Premium Members.
You may opt-out of receiving report notifications
at any time. Questions or comments may be submitted
by writing to Premium Membership Services 665 S.E. 10 Street, Suite 201 Deerfield Beach, FL 33441-5634 or by calling 1-800-965-8307
or 954-785-1121.
|
|
|