You are not logged in.
This means you
CAN ONLY VIEW reports that were published prior to Monday, April 14, 2025.
You
MUST UPGRADE YOUR MEMBERSHIP if you want to see any current reports.
AFTER MARKET UPDATE - MONDAY, NOVEMBER 24TH, 2014
Previous After Market Report Next After Market Report >>>
|
|
|
|
DOW |
+7.84 |
17,817.90 |
+0.04% |
|
Volume |
693,171,180 |
-32% |
|
Volume |
1,445,974,870 |
-16% |
|
NASDAQ |
+41.92 |
4,754.89 |
+0.89% |
|
Advancers |
1,920 |
60% |
|
Advancers |
1,993 |
69% |
|
S&P 500 |
+5.91 |
2,069.41 |
+0.29% |
|
Decliners |
1,149 |
36% |
|
Decliners |
801 |
28% |
|
Russell 2000 |
+14.52 |
1,186.94 |
+1.24% |
|
52 Wk Highs |
154 |
|
|
52 Wk Highs |
111 |
|
|
S&P 600 |
+7.73 |
685.09 |
+1.14% |
|
52 Wk Lows |
18 |
|
|
52 Wk Lows |
39 |
|
|
 |
Major Averages Rose Again With Less Volume Conviction
Kenneth J. Gruneisen - Passed the CAN SLIM® Master's Exam
Monday's gains were backed by lighter volume totals on the NYSE and on the Nasdaq exchange. Breadth was positive as advancers led decliners by almost a 2-1 margin on the NYSE and by a 5-2 margin on the Nasdaq exchange. There were 77 high-ranked companies from the CANSLIM.net Leaders List that made new 52-week highs and appeared on the CANSLIM.net BreakOuts Page, down from the prior session total of 96 stocks. New 52-week highs contracted yet still easily outnumbered new 52-week lows on the NYSE and on the Nasdaq exchange. There were gains for 11 of the 12 high-ranked companies currently on the Featured Stocks Page. A "confirmed uptrend" for the market (M criteria) has been repeatedly noted in this daily Market Commentary since large gains were noted on 10/21/14 backed by higher volume totals as leadership (stocks hitting new 52-week highs) expanded.
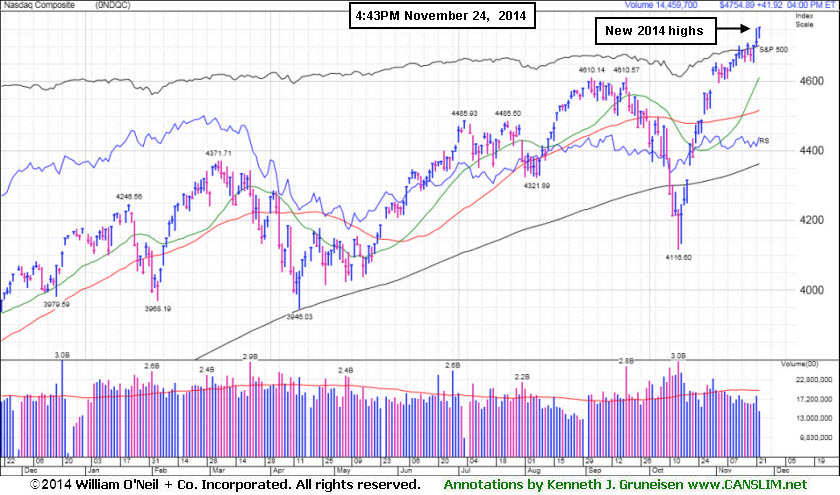
PICTURED: The Nasdaq Composite Index is perched at a new 2014 after the tech sector has helped it rally.
The major averages finished Monday's session in positive territory with gains attributed to investor optimism that global central banks will continue to support economic growth. On the data front, a preliminary report on the service sector showed activity rose at a slower pace in November than projected. Additional releases revealed manufacturing expanded in the Fed's Dallas district but eased in the Midwest.
Technology and consumer discretionary were among the best performing sectors. Intel (INTC +1.85%) rose following a positive article in Barron's over the weekend. Disney (DIS +1.82%) rose amid reports its ESPN unit is close to unveiling a new online subscription service. Retailers are rising as they prepare for the start to the holiday shopping season on Friday. Shares of Best Buy (BBY +2.29%) and Amazon.com (AMZN +0.90%) rose. Telecom and materials were down as Verizon (VZ -1.41%) and fertilizer producer Mosaic (MOS -3.71%) fell.
Disciplined investors know that new buying efforts may be made under the fact-based investment system only in stocks meeting all key criteria. The Featured Stocks Page shows the most action-worthy candidates and their latest notes and a Headline Link directs members to the latest detailed analysis with data-packed graphs annotated by a Certified expert along with links to additional resources. The Premium Member Homepage includes "dynamic archives" to all prior pay reports published.
|
 Kenneth J. Gruneisen started out as a licensed stockbroker in August 1987, a couple of months prior to the historic stock market crash that took the Dow Jones Industrial Average down -22.6% in a single day. He has published daily fact-based fundamental and technical analysis on high-ranked stocks online for two decades. Through FACTBASEDINVESTING.COM, Kenneth provides educational articles, news, market commentary, and other information regarding proven investment systems that work in good times and bad.
Comments contained in the body of this report are technical opinions only and are not necessarily those of Gruneisen Growth Corp. The material herein has been obtained from sources believed to be reliable and accurate, however, its accuracy and completeness cannot be guaranteed. Our firm, employees, and customers may effect transactions, including transactions contrary to any recommendation herein, or have positions in the securities mentioned herein or options with respect thereto. Any recommendation contained in this report may not be suitable for all investors and it is not to be deemed an offer or solicitation on our part with respect to the purchase or sale of any securities. |
|
 |
Tech, Financial and Retail Indexes Rose
Kenneth J. Gruneisen - Passed the CAN SLIM® Master's Exam
The tech sector's gains pushed the Nasdaq Composite Index higher as the Semiconductor Index ($SOX +0.98%), Networking Index ($NWX +1.25%), and Biotechnology Index ($BTK +1.75%) tallied unanimous gains. Financials including the Bank Index ($BKX +0.91%) and the Broker/Dealer Index ($XBD +0.90%) posted influential gains and the Retail Index ($RLX +0.62%) also ended Monday's session higher. Meanwhile, commodity-linked groups were weak as the Gold & Silver Index ($XAU -1.36%), Oil Services Index ($OSX -0.81%), and the Integrated Oil Index ($XOI -0.72%) ended unanimously lower.
Charts courtesy www.stockcharts.com

PICTURED: The Broker/Dealer Index ($XBD +0.90%) is consolidating after recently topping its September highs.
| Oil Services |
$OSX |
247.25 |
-2.02 |
-0.81% |
-12.02% |
| Integrated Oil |
$XOI |
1,475.09 |
-10.74 |
-0.72% |
-1.87% |
| Semiconductor |
$SOX |
669.47 |
+6.52 |
+0.98% |
+25.13% |
| Networking |
$NWX |
347.89 |
+4.30 |
+1.25% |
+7.39% |
| Broker/Dealer |
$XBD |
177.31 |
+1.59 |
+0.90% |
+10.43% |
| Retail |
$RLX |
1,001.20 |
+6.13 |
+0.62% |
+6.53% |
| Gold & Silver |
$XAU |
72.77 |
-1.00 |
-1.36% |
-13.52% |
| Bank |
$BKX |
73.35 |
+0.66 |
+0.91% |
+5.91% |
| Biotech |
$BTK |
3,401.64 |
+58.66 |
+1.75% |
+45.97% |
|
|
|
 |
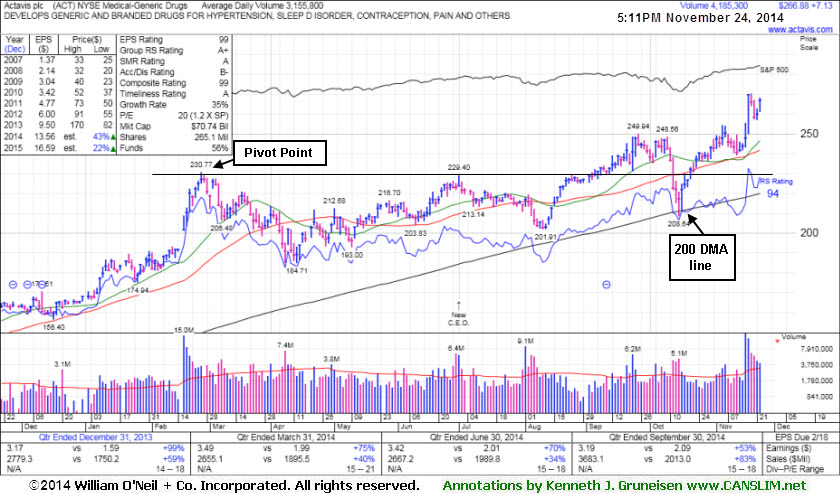
Perched at Highs Following Spike on Acquisition Plans
Kenneth J. Gruneisen - Passed the CAN SLIM® Master's Exam
Actavis plc (ACT +7.13 or +2.74% to $266.88) is consolidating after spiking to new 52-week highs with volume-driven gains following news it plans to acquire Allergan (AGN) for $66 Billion. Its 50-day moving average (DMA) line and prior highs define support where violations would raise concerns. It is extended from prior highs and it was last shown in this FSU section on 11/06/14 with annotated graphs under the headline, "New Highs Following Deep "V" Shaped Pullback - Not a Sound Base". It did not form a sound base pattern, but there was a deep "V" shaped pullback and recovery. It found prompt support at its 200 DMA line after the damaging streak of 5 consecutive losses marked by volume triggered technical sell signals.
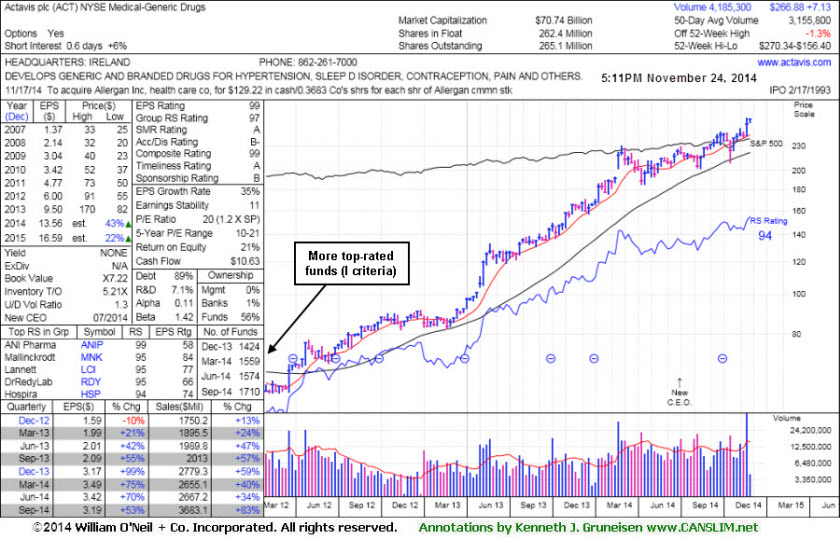
ACT was first highlighted in yellow in the 6/20/14 mid-day report (read here) with a pivot point based on its 2/26/14 high plus 10 cents. The Medical - Generic Drugs industry group currently has a 97 Group Relative Strength Rating. Leadership from other issues in the group is also a reassuring sign concerning the L criteria. It reported earnings +53% on +83% sales revenues for the Sep '14 quarter, and its strong record satisfies the C criteria. Its annual earnings (A criteria) history has also been strong. The number of top-rated funds owning its shares has been on the rise, up from 1,219 in Sep '13 to 1,710 in Sep '14, a reassuring sign concerning the I criteria.
|
|
|
Color Codes Explained :
Y - Better candidates highlighted by our
staff of experts.
G - Previously featured
in past reports as yellow but may no longer be buyable under the
guidelines.
***Last / Change / Volume data in this table is the closing quote data***
Symbol/Exchange
Company Name
Industry Group |
PRICE |
CHANGE
(%Change) |
Day High |
Volume
(% DAV)
(% 50 day avg vol) |
52 Wk Hi
% From Hi |
Featured
Date |
Price
Featured |
Pivot Featured |
|
Max Buy |
ACT
-
NYSE
Actavis plc
Medical-Generic Drugs
|
$266.88
|
+7.13
2.74% |
$268.34
|
4,185,058
132.65% of 50 DAV
50 DAV is 3,155,000
|
$270.34
-1.28%
|
6/20/2014
|
$216.53
|
PP = $230.87
|
|
MB = $242.41
|
 Most Recent Note - 11/24/2014 12:12:07 PM
G - Its 50 DMA line and prior highs define support where violations would raise concerns. Consolidating after spiking to new 52-week highs with volume-driven gains following news it plans to acquire Allergan (AGN) for $66 Billion. Did not form a sound base, and it is extended from prior highs.
>>> FEATURED STOCK ARTICLE : Perched at Highs Following Spike on Acquisition Plans - 11/24/2014
View all notes |
Set NEW NOTE alert |
CANSLIM.net Company Profile |
SEC
News |
Chart |
Request a new note
C
A N
S L
I M


|
AFSI
-
NASDAQ
Amtrust Financial Svcs
INSURANCE - Property and; Casualty Insurance
|
$52.86
|
+1.86
3.65% |
$52.87
|
1,101,696
106.03% of 50 DAV
50 DAV is 1,039,000
|
$53.80
-1.75%
|
10/17/2014
|
$45.24
|
PP = $46.02
|
|
MB = $48.32
|
Most Recent Note - 11/21/2014 5:42:16 PM
G - Encountering distributional pressure while hovering near its 52-week high. Recent lows near $42 and its 50 DMA line define important near-term support. See the latest FSU analysis for more details and new annotated graphs.
>>> FEATURED STOCK ARTICLE : No Sound Base Formed, Yet Little Resistance Remains - 11/21/2014
View all notes |
Set NEW NOTE alert |
CANSLIM.net Company Profile |
SEC
News |
Chart |
Request a new note
C
A N
S L
I M
|
ALXN
-
NASDAQ
Alexion Pharmaceuticals
DRUGS - Drug Manufacturers - Other
|
$194.15
|
+3.13
1.64% |
$195.01
|
806,709
67.17% of 50 DAV
50 DAV is 1,201,000
|
$197.64
-1.77%
|
10/23/2014
|
$184.01
|
PP = $185.53
|
|
MB = $194.81
|
Most Recent Note - 11/21/2014 5:43:36 PM
Y - Finished near the session low today with a small loss on near average volume. Still trading above its pivot point and below its "max buy" level. Prior highs in the $180 area define initial support to watch on pullbacks.
>>> FEATURED STOCK ARTICLE : New High Close With Gain on Light Volume - 11/10/2014
View all notes |
Set NEW NOTE alert |
CANSLIM.net Company Profile |
SEC
News |
Chart |
Request a new note
C
A N
S L
I M
|
BIDU
-
NASDAQ
Baidu Inc Ads
INTERNET - Internet Information Providers
|
$243.91
|
-1.39
-0.57% |
$247.87
|
2,344,859
59.53% of 50 DAV
50 DAV is 3,939,000
|
$251.99
-3.21%
|
10/30/2014
|
$234.08
|
PP = $231.51
|
|
MB = $243.09
|
Most Recent Note - 11/21/2014 5:45:26 PM
G - Color code is changed to green after rising back above its "max buy" level with today's gap up gain on near average volume. Prior highs near $230 define near-term support to watch on pullbacks.
>>> FEATURED STOCK ARTICLE : Consolidating Back Below "Max Buy" Level - 11/17/2014
View all notes |
Set NEW NOTE alert |
CANSLIM.net Company Profile |
SEC
News |
Chart |
Request a new note
C
A N
S L
I M
|
EPAM
-
NYSE
Epam Systems Inc
COMPUTER SOFTWARE and SERVICES - Information Technology Service
|
$49.63
|
+0.79
1.62% |
$49.63
|
304,209
70.75% of 50 DAV
50 DAV is 430,000
|
$50.34
-1.41%
|
10/23/2014
|
$45.21
|
PP = $46.09
|
|
MB = $48.39
|
Most Recent Note - 11/20/2014 5:19:55 PM
G - Still stubbornly holding its ground above its "max buy" level. Prior highs in the $44 area defining initial support above its 50 DMA line ($43.12).
>>> FEATURED STOCK ARTICLE : Consolidating Above Prior Highs Following Technical Breakout - 11/11/2014
View all notes |
Set NEW NOTE alert |
CANSLIM.net Company Profile |
SEC
News |
Chart |
Request a new note
C
A N
S L
I M
|
Symbol/Exchange
Company Name
Industry Group |
PRICE |
CHANGE
(%Change) |
Day High |
Volume
(% DAV)
(% 50 day avg vol) |
52 Wk Hi
% From Hi |
Featured
Date |
Price
Featured |
Pivot Featured |
|
Max Buy |
FB
-
NASDAQ
Facebook Inc Cl A
INTERNET
|
$73.99
|
+0.24
0.33% |
$74.35
|
21,983,115
57.15% of 50 DAV
50 DAV is 38,464,000
|
$81.16
-8.83%
|
9/9/2014
|
$76.67
|
PP = $76.84
|
|
MB = $80.68
|
Most Recent Note - 11/20/2014 5:21:28 PM
G - Volume totals have been cooling and recent gains have lacked volume conviction. Its outlook gets worse the longer it lingers below its 50 DMA line.
>>> FEATURED STOCK ARTICLE : Following Violation 50-Day Average Acted as Resistance - 11/14/2014
View all notes |
Set NEW NOTE alert |
CANSLIM.net Company Profile |
SEC
News |
Chart |
Request a new note
C
A N
S L
I M
|
FLT
-
NYSE
Fleetcor Technologies
DIVERSIFIED SERVICES - Business/Management Services
|
$156.05
|
+0.06
0.04% |
$157.78
|
450,572
60.72% of 50 DAV
50 DAV is 742,000
|
$160.40
-2.71%
|
10/31/2014
|
$148.50
|
PP = $146.29
|
|
MB = $153.60
|
Most Recent Note - 11/21/2014 12:28:10 PM
G - Hit new 52-week and all-time highs and rallied further above its "max buy level" with today's 5th consecutive gain. Prior highs in the $146-149 area define initial support to watch on pullbacks.
>>> FEATURED STOCK ARTICLE : Consolidation Continues Above Prior Highs - 11/18/2014
View all notes |
Set NEW NOTE alert |
CANSLIM.net Company Profile |
SEC
News |
Chart |
Request a new note
C
A N
S L
I M
|
ILMN
-
NASDAQ
Illumina Inc
DRUGS - Biotechnology
|
$191.16
|
+5.33
2.87% |
$191.35
|
899,217
70.97% of 50 DAV
50 DAV is 1,267,000
|
$197.37
-3.15%
|
10/22/2014
|
$188.77
|
PP = $182.27
|
|
MB = $191.38
|
Most Recent Note - 11/24/2014 12:57:04 PM
Y - Volume totals have been cooling while consolidating and prior highs near $182 acted as support on the recent pullback. More damaging losses would raise concerns and trigger a technical sell signal.
>>> FEATURED STOCK ARTICLE : Consolidating Above Prior Highs Which Define Initial Support - 11/7/2014
View all notes |
Set NEW NOTE alert |
CANSLIM.net Company Profile |
SEC
News |
Chart |
Request a new note
C
A N
S L
I M
|
NBCB
-
NASDAQ
First N B C Bank Hldg
Banks-Southeast
|
$37.38
|
+0.53
1.44% |
$37.69
|
186,732
245.70% of 50 DAV
50 DAV is 76,000
|
$38.18
-2.10%
|
10/31/2014
|
$36.31
|
PP = $35.93
|
|
MB = $37.73
|
Most Recent Note - 11/24/2014 12:36:38 PM
Y - Trading up near its "max buy" level with today's gain. Prior highs near $34 define near-term support to watch on pullbacks.
>>> FEATURED STOCK ARTICLE : Fifth Consecutive Loss While Retreating From Highs - 11/19/2014
View all notes |
Set NEW NOTE alert |
CANSLIM.net Company Profile |
SEC
News |
Chart |
Request a new note
C
A N
S L
I M
|
PANW
-
NYSE
Palo Alto Networks
Computer Sftwr-Security
|
$113.26
|
+4.33
3.98% |
$113.38
|
2,943,471
155.53% of 50 DAV
50 DAV is 1,892,600
|
$112.11
1.03%
|
7/30/2014
|
$84.21
|
PP = $85.88
|
|
MB = $90.17
|
Most Recent Note - 11/24/2014 12:59:23 PM
G - Quietly hitting new highs with today's gain lacking great volume conviction. It has not formed a sound base, and the 50 DMA line ($102.74) defines near-term support to watch.
>>> FEATURED STOCK ARTICLE : Finished Near Session Low With Small Gain on Light Volume - 11/13/2014
View all notes |
Set NEW NOTE alert |
CANSLIM.net Company Profile |
SEC
News |
Chart |
Request a new note
C
A N
S L
I M
|
Symbol/Exchange
Company Name
Industry Group |
PRICE |
CHANGE
(%Change) |
Day High |
Volume
(% DAV)
(% 50 day avg vol) |
52 Wk Hi
% From Hi |
Featured
Date |
Price
Featured |
Pivot Featured |
|
Max Buy |
SNCR
-
NASDAQ
Synchronoss Technologies
COMPUTER SOFTWARE andamp; SERVICES - Application Software
|
$43.00
|
+0.12
0.28% |
$43.24
|
688,004
104.72% of 50 DAV
50 DAV is 657,000
|
$54.05
-20.44%
|
10/27/2014
|
$46.40
|
PP = $47.81
|
|
MB = $50.20
|
Most Recent Note - 11/24/2014 1:01:51 PM
G - Halted its slide but remains below its 50 DMA line following a damaging volume-driven loss that triggered a technical sell signal. Prior lows in the $41 area acted as support, but a rebound above the 50 DMA line is needed for its outlook to improve.
>>> FEATURED STOCK ARTICLE : Loss on Heavy Volume a Sign of Distributional Pressure - 11/12/2014
View all notes |
Set NEW NOTE alert |
CANSLIM.net Company Profile |
SEC
News |
Chart |
Request a new note
C
A N
S L
I M
|
STRT
-
NASDAQ
Strattec Security Corp
AUTOMOTIVE - Auto Parts
|
$107.76
|
+0.39
0.36% |
$110.96
|
19,798
76.15% of 50 DAV
50 DAV is 26,000
|
$110.00
-2.04%
|
11/20/2014
|
$105.76
|
PP = $109.54
|
|
MB = $115.02
|
Most Recent Note - 11/20/2014 4:44:18 PM
Y - Color code is changed to yellow after forming an advanced "3-weeks tight" base. Volume-driven gains for new highs may trigger a new (or add-on) technical buy signal. Prior highs coincide with its 50 DMA line defining important near-term support to watch on pullbacks. See the latest FSU analysis for more details and new annotated graphs.
>>> FEATURED STOCK ARTICLE : Formed New Advanced "3-Weeks Tight" Base - 11/20/2014
View all notes |
Set NEW NOTE alert |
CANSLIM.net Company Profile |
SEC
News |
Chart |
Request a new note
C
A N
S L
I M
|
|
|
|
THESE ARE NOT BUY RECOMMENDATIONS!
Comments contained in the body of this report are technical
opinions only. The material herein has been obtained
from sources believed to be reliable and accurate, however,
its accuracy and completeness cannot be guaranteed.
This site is not an investment advisor, hence it does
not endorse or recommend any securities or other investments.
Any recommendation contained in this report may not
be suitable for all investors and it is not to be deemed
an offer or solicitation on our part with respect to
the purchase or sale of any securities. All trademarks,
service marks and trade names appearing in this report
are the property of their respective owners, and are
likewise used for identification purposes only.
This report is a service available
only to active Paid Premium Members.
You may opt-out of receiving report notifications
at any time. Questions or comments may be submitted
by writing to Premium Membership Services 665 S.E. 10 Street, Suite 201 Deerfield Beach, FL 33441-5634 or by calling 1-800-965-8307
or 954-785-1121.
|
|
|

