***Last / Change / Volume data in this table is the closing quote data***
Symbol/Exchange
Company Name
Industry Group |
PRICE |
CHANGE
(%Change) |
Day High |
Volume
(% DAV)
(% 50 day avg vol) |
52 Wk Hi
% From Hi |
Featured
Date |
Price
Featured |
Pivot Featured |
|
Max Buy |
ABV
-
NYSE
Comp De Bebidas Adr
FOOD and BEVERAGE - Beverages - Brewers
|
$141.24
|
+1.52
1.09% |
$142.35
|
609,050
93.04% of 50 DAV
50 DAV is 654,600
|
$145.36
-2.83%
|
11/4/2010
|
$142.35
|
PP = $143.63
|
|
MB = $150.81
|
Most Recent Note - 11/23/2010 5:27:48 PM
Y - Down today amid widespread weakness. Confirming gains to new highs on heavy volume would be a reassuring sign of institutional demand. Meanwhile, a recent low ($133.38 on 10/27/10) defines support above its 50 DMA line.
>>> The latest Featured Stock Update with an annotated graph appeared on 10/11/2010. Click here.
View all notes |
Alert me of new notes |
CANSLIM.net Company Profile |
SEC |
Zacks Reports |
StockTalk |
News |
Chart |
Request a new note
C
A N
S L
I M


|
ARUN
-
NASDAQ
Aruba Networks Inc
COMPUTER HARDWARE - Networking andamp; Communication Dev
|
$23.82
|
+0.56
2.40% |
$23.98
|
2,319,681
92.50% of 50 DAV
50 DAV is 2,507,800
|
$24.28
-1.90%
|
8/30/2010
|
$18.12
|
PP = $18.51
|
|
MB = $19.44
|
Most Recent Note - 11/23/2010 4:24:54 PM
G - Gapped down today amid widespread market weakness. On the prior session it had rallied to a new all-time high, eclipsing its 2007 best for the first time. Its 50 DMA line and an upward trendline connecting May - November lows define support to watch.
>>> The latest Featured Stock Update with an annotated graph appeared on 10/26/2010. Click here.
View all notes |
Alert me of new notes |
CANSLIM.net Company Profile |
SEC |
Zacks Reports |
StockTalk |
News |
Chart |
Request a new note
C
A N
S L
I M
|
BIDU
-
NASDAQ
Baidu Inc Ads
INTERNET - Internet Information Providers
|
$109.00
|
+2.69
2.53% |
$109.50
|
7,176,325
58.30% of 50 DAV
50 DAV is 12,308,400
|
$115.04
-5.25%
|
9/17/2010
|
$85.73
|
PP = $88.42
|
|
MB = $92.84
|
Most Recent Note - 11/23/2010 5:05:58 PM
G - Consolidating above its 50 DMA line, extended from a sound base pattern. Noted as a riskier "late stage" candidate after ongoing coverage.
>>> The latest Featured Stock Update with an annotated graph appeared on 10/7/2010. Click here.
View all notes |
Alert me of new notes |
CANSLIM.net Company Profile |
SEC |
Zacks Reports |
StockTalk |
News |
Chart |
Request a new note
C
A N
S L
I M
|
CACC
-
NASDAQ
Credit Acceptance Corp
FINANCIAL SERVICES - Credit Services
|
$61.30
|
+1.45
2.42% |
$61.30
|
27,993
105.63% of 50 DAV
50 DAV is 26,500
|
$63.45
-3.39%
|
11/22/2010
|
$59.97
|
PP = $62.00
|
|
MB = $65.10
|
 Most Recent Note - 11/24/2010 4:18:54 PM
Y - Climbed further above its 50 DMA line today with a 6th consecutive gain, leaving it perched only -3.7% off its 52-week high. Currently building on a "double bottom" type base pattern, its 11/16/10 low ($54.12) defines initial support above its 200 DMA line.
>>> The latest Featured Stock Update with an annotated graph appeared on 10/29/2010. Click here.
View all notes |
Alert me of new notes |
CANSLIM.net Company Profile |
SEC |
Zacks Reports |
StockTalk |
News |
Chart |
Request a new note
C
A N
S L
I M
|
CMG
-
NYSE
Chipotle Mexican Grill
LEISURE - Restaurants
|
$250.19
|
+6.29
2.58% |
$250.50
|
957,124
115.76% of 50 DAV
50 DAV is 826,800
|
$244.10
2.49%
|
9/1/2010
|
$158.31
|
PP = $155.52
|
|
MB = $163.30
|
Most Recent Note - 11/24/2010 3:52:29 PM
G - Gapped up today for a 4th consecutive gain and yet another new all-time high. It is extended from any sound base pattern. Its 50 DMA line (now $196) defines the nearest chart support level.
>>> The latest Featured Stock Update with an annotated graph appeared on 10/28/2010. Click here.
View all notes |
Alert me of new notes |
CANSLIM.net Company Profile |
SEC |
Zacks Reports |
StockTalk |
News |
Chart |
Request a new note
C
A N
S L
I M
|
Symbol/Exchange
Company Name
Industry Group |
PRICE |
CHANGE
(%Change) |
Day High |
Volume
(% DAV)
(% 50 day avg vol) |
52 Wk Hi
% From Hi |
Featured
Date |
Price
Featured |
Pivot Featured |
|
Max Buy |
CTRP
-
NASDAQ
Ctrip.Com Intl Ltd Adr
LEISURE - Resorts and Casinos
|
$48.03
|
+1.62
3.49% |
$48.24
|
1,488,230
72.81% of 50 DAV
50 DAV is 2,043,900
|
$53.16
-9.65%
|
9/24/2010
|
$46.75
|
PP = $47.11
|
|
MB = $49.47
|
Most Recent Note - 11/24/2010 3:55:32 PM
G - Rallied above its 50 DMA line today, helping its outlook improve. Gains lacked volume conviction after losses with above average volume raised concerns, and subsequent losses below its recent low ($45.05 on 11/16/10) would raise greater concerns.
>>> The latest Featured Stock Update with an annotated graph appeared on 11/22/2010. Click here.
View all notes |
Alert me of new notes |
CANSLIM.net Company Profile |
SEC |
Zacks Reports |
StockTalk |
News |
Chart |
Request a new note
C
A N
S L
I M
|
DECK
-
NASDAQ
Deckers Outdoor Corp
CONSUMER NON-DURABLES - Textile - Apparel Footwear
|
$71.41
|
+2.34
3.39% |
$71.47
|
1,305,058
108.44% of 50 DAV
50 DAV is 1,203,500
|
$69.79
2.32%
|
10/27/2010
|
$54.16
|
PP = $54.86
|
|
MB = $57.60
|
Most Recent Note - 11/24/2010 3:51:13 PM
G - Today's 6th consecutive gain marks yet another new all-time high. Extended from its latest sound base, its prior highs and its 50 DMA line define the nearest chart support.
>>> The latest Featured Stock Update with an annotated graph appeared on 10/27/2010. Click here.
View all notes |
Alert me of new notes |
CANSLIM.net Company Profile |
SEC |
Zacks Reports |
StockTalk |
News |
Chart |
Request a new note
C
A N
S L
I M
|
EZPW
-
NASDAQ
Ezcorp Inc Cl A
SPECIALTY RETAIL - Specialty Retail, Other
|
$24.95
|
+0.34
1.38% |
$24.95
|
151,842
50.06% of 50 DAV
50 DAV is 303,300
|
$25.65
-2.73%
|
11/5/2010
|
$24.02
|
PP = $23.85
|
|
MB = $25.04
|
Most Recent Note - 11/23/2010 5:18:57 PM
G - Stubbornly holding its ground with volume totals cooling while consolidating in a tight range near its all-time high. Prior highs in the $22-23 area define chart support to watch above its 50 DMA line.
>>> The latest Featured Stock Update with an annotated graph appeared on 11/6/2010. Click here.
View all notes |
Alert me of new notes |
CANSLIM.net Company Profile |
SEC |
Zacks Reports |
StockTalk |
News |
Chart |
Request a new note
C
A N
S L
I M
|
FFIV
-
NASDAQ
F 5 Networks Inc
INTERNET - Internet Software and Services
|
$132.55
|
+3.41
2.64% |
$133.70
|
2,105,832
75.92% of 50 DAV
50 DAV is 2,773,900
|
$132.20
0.26%
|
6/16/2010
|
$74.50
|
PP = $74.10
|
|
MB = $77.81
|
Most Recent Note - 11/23/2010 5:26:03 PM
G - Consolidating at all-time highs, extended from any sound base pattern. Prior highs in the $112 area define initial chart support.
>>> The latest Featured Stock Update with an annotated graph appeared on 11/15/2010. Click here.
View all notes |
Alert me of new notes |
CANSLIM.net Company Profile |
SEC |
Zacks Reports |
StockTalk |
News |
Chart |
Request a new note
C
A N
S L
I M
|
FOSL
-
NASDAQ
Fossil Inc
CONSUMER DURABLES - Recreational Goods, Other
|
$68.89
|
+1.62
2.41% |
$68.95
|
707,539
89.89% of 50 DAV
50 DAV is 787,100
|
$70.07
-1.68%
|
10/20/2010
|
$54.12
|
PP = $55.61
|
|
MB = $58.39
|
Most Recent Note - 11/23/2010 5:11:59 PM
G - Stubbornly holding its ground in a tight range, extended from any sound base. An upward trendline connecting its July-October lows defines support to watch above its 50 DMA line.
>>> The latest Featured Stock Update with an annotated graph appeared on 10/5/2010. Click here.
View all notes |
Alert me of new notes |
CANSLIM.net Company Profile |
SEC |
Zacks Reports |
StockTalk |
News |
Chart |
Request a new note
C
A N
S L
I M
|
Symbol/Exchange
Company Name
Industry Group |
PRICE |
CHANGE
(%Change) |
Day High |
Volume
(% DAV)
(% 50 day avg vol) |
52 Wk Hi
% From Hi |
Featured
Date |
Price
Featured |
Pivot Featured |
|
Max Buy |
HMSY
-
NASDAQ
H M S Holdings Corp
COMPUTER SOFTWARE and SERVICES - Healthcare Information Service
|
$64.03
|
+1.66
2.66% |
$64.06
|
152,894
70.43% of 50 DAV
50 DAV is 217,100
|
$62.91
1.78%
|
11/19/2010
|
$61.89
|
PP = $63.01
|
|
MB = $66.16
|
Most Recent Note - 11/24/2010 4:06:15 PM
Y - No resistance remains due to overhead supply after today's gap up gain above its pivot point for a new 52-week high. Light volume behind its 5th consecutive gain was below the +50% above average volume minimum necessary to trigger a proper new (or add-on) technical buy signal. Its 50 DMA line defines important support to watch.
>>> The latest Featured Stock Update with an annotated graph appeared on 11/19/2010. Click here.
View all notes |
Alert me of new notes |
CANSLIM.net Company Profile |
SEC |
Zacks Reports |
StockTalk |
News |
Chart |
Request a new note
C
A N
S L
I M
|
HS
-
NYSE
Healthspring Inc
HEALTH SERVICES - Health Care Plans
|
$27.70
|
+0.36
1.32% |
$27.93
|
268,265
37.74% of 50 DAV
50 DAV is 710,800
|
$29.80
-7.05%
|
8/27/2010
|
$19.91
|
PP = $19.75
|
|
MB = $20.74
|
Most Recent Note - 11/24/2010 4:06:44 PM
G - Hovering -7% off its 52-week high, and volume totals are still cooling while consolidating above its 50 DMA line which acted as support.
>>> The latest Featured Stock Update with an annotated graph appeared on 10/22/2010. Click here.
View all notes |
Alert me of new notes |
CANSLIM.net Company Profile |
SEC |
Zacks Reports |
StockTalk |
News |
Chart |
Request a new note
C
A N
S L
I M
|
IGTE
-
NASDAQ
Igate Corp
COMPUTER SOFTWARE and SERVICES - Information Technology Service
|
$24.31
|
+0.21
0.87% |
$24.44
|
516,434
74.08% of 50 DAV
50 DAV is 697,100
|
$24.14
0.70%
|
10/26/2010
|
$17.29
|
PP = $19.55
|
|
MB = $20.53
|
Most Recent Note - 11/24/2010 4:07:18 PM
G - Posted a 5th consecutive gain today with below average volume for a new 52-week high. Extended from its latest base, its prior chart highs in the $19 area define initial chart support above its 50 DMA line.
>>> The latest Featured Stock Update with an annotated graph appeared on 11/11/2010. Click here.
View all notes |
Alert me of new notes |
CANSLIM.net Company Profile |
SEC |
Zacks Reports |
StockTalk |
News |
Chart |
Request a new note
C
A N
S L
I M
|
JOBS
-
NASDAQ
Fifty One Job Inc Ads
DIVERSIFIED SERVICES - Staffing and; Outsourcing Service
|
$51.01
|
+1.19
2.39% |
$51.84
|
211,816
96.63% of 50 DAV
50 DAV is 219,200
|
$51.75
-1.43%
|
10/13/2010
|
$42.07
|
PP = $40.60
|
|
MB = $42.63
|
Most Recent Note - 11/24/2010 4:08:42 PM
G - Posted a 6th consecutive gain today with near average volume while hitting and closing at new 52-week highs. Its 50 DMA line defines important support to watch.
>>> The latest Featured Stock Update with an annotated graph appeared on 11/16/2010. Click here.
View all notes |
Alert me of new notes |
CANSLIM.net Company Profile |
SEC |
Zacks Reports |
StockTalk |
News |
Chart |
Request a new note
C
A N
S L
I M
|
LFT
-
NYSE
Longtop Financl Tech Ads
COMPUTER SOFTWARE and SERVICES - Business Software and Services
|
$41.13
|
+0.84
2.08% |
$41.37
|
260,368
47.47% of 50 DAV
50 DAV is 548,500
|
$42.86
-4.04%
|
11/5/2010
|
$41.83
|
PP = $40.96
|
|
MB = $43.01
|
Most Recent Note - 11/24/2010 4:12:44 PM
Y - Perched only -4.5% off its all-time high after a small gap up gain today. Volume totals have been cooling while consolidating above support near its 50 DMA line.
>>> The latest Featured Stock Update with an annotated graph appeared on 10/14/2010. Click here.
View all notes |
Alert me of new notes |
CANSLIM.net Company Profile |
SEC |
Zacks Reports |
StockTalk |
News |
Chart |
Request a new note
C
A N
S L
I M
|
Symbol/Exchange
Company Name
Industry Group |
PRICE |
CHANGE
(%Change) |
Day High |
Volume
(% DAV)
(% 50 day avg vol) |
52 Wk Hi
% From Hi |
Featured
Date |
Price
Featured |
Pivot Featured |
|
Max Buy |
LULU
-
NASDAQ
Lululemon Athletica
MANUFACTURING - Textile Manufacturing
|
$53.88
|
+0.45
0.84% |
$54.30
|
771,763
71.47% of 50 DAV
50 DAV is 1,079,800
|
$54.77
-1.62%
|
10/8/2010
|
$47.66
|
PP = $46.67
|
|
MB = $49.00
|
Most Recent Note - 11/24/2010 4:14:03 PM
G - It is extended from its prior base after 7 consecutive gains. Prior highs in the $46-48 area define chart support to watch along with its 50 DMA line.
>>> The latest Featured Stock Update with an annotated graph appeared on 10/8/2010. Click here.
View all notes |
Alert me of new notes |
CANSLIM.net Company Profile |
SEC |
Zacks Reports |
StockTalk |
News |
Chart |
Request a new note
C
A N
S L
I M
|
MWIV
-
NASDAQ
M W I Veterinary Supply
HEALTH SERVICES - Medical Instruments and; Supplies
|
$60.97
|
+1.94
3.29% |
$61.41
|
47,468
81.70% of 50 DAV
50 DAV is 58,100
|
$63.94
-4.64%
|
11/4/2010
|
$61.79
|
PP = $59.60
|
|
MB = $62.58
|
Most Recent Note - 11/24/2010 3:49:50 PM
Y - Perched near its best ever close. Its 50 DMA line has been repeatedly noted as a very important support level. It stalled after hitting its all-time high on 11/04/10, yet held its ground stubbornly above its short-term average.
>>> The latest Featured Stock Update with an annotated graph appeared on 11/2/2010. Click here.
View all notes |
Alert me of new notes |
CANSLIM.net Company Profile |
SEC |
Zacks Reports |
StockTalk |
News |
Chart |
Request a new note
C
A N
S L
I M
|
NEOG
-
NASDAQ
Neogen Corp
DRUGS - Diagnostic Substances
|
$37.58
|
+1.07
2.93% |
$37.72
|
53,014
62.52% of 50 DAV
50 DAV is 84,800
|
$36.90
1.84%
|
9/1/2010
|
$30.79
|
PP = $30.49
|
|
MB = $32.01
|
Most Recent Note - 11/24/2010 4:00:05 PM
G - Rallied to a new all-time high with today's 5th consecutive gain on light volume. It is extended from any sound base, and its 50 DMA line recently has been a reliable support level.
>>> The latest Featured Stock Update with an annotated graph appeared on 10/13/2010. Click here.
View all notes |
Alert me of new notes |
CANSLIM.net Company Profile |
SEC |
Zacks Reports |
StockTalk |
News |
Chart |
Request a new note
C
A N
S L
I M
|
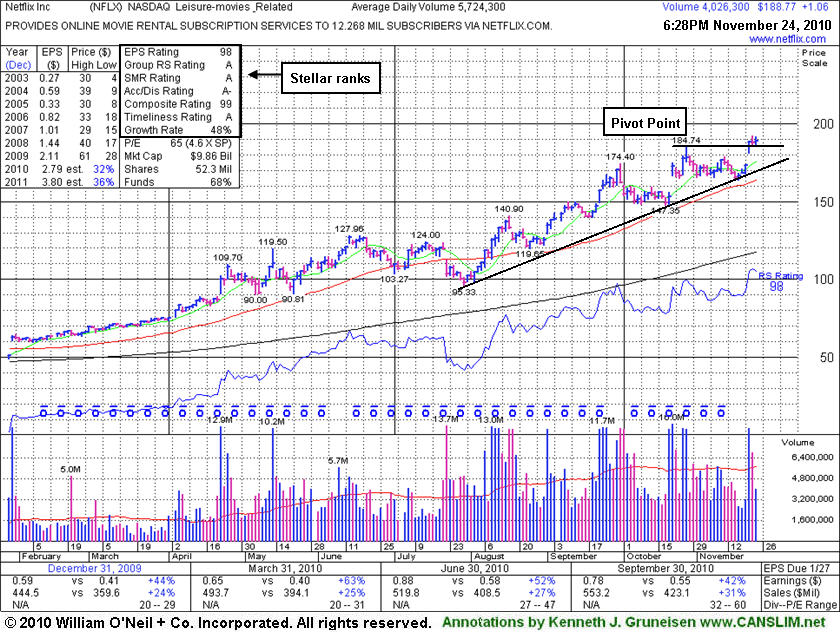
NFLX
-
NASDAQ
Netflix Inc
SPECIALTY RETAIL - Music and Video Stores
|
$188.77
|
+1.06
0.56% |
$191.83
|
4,028,496
73.14% of 50 DAV
50 DAV is 5,508,000
|
$192.10
-1.73%
|
11/9/2010
|
$173.10
|
PP = $184.84
|
|
MB = $194.08
|
Most Recent Note - 11/24/2010 4:28:46 PM
Y - Perched at all-time highs after a gap up gain with above average volume on 11/22/10. NFLX had been noted as a riskier "late stage" set-up, and the gap up gain amounted to a new (or add-on) technical buy signal. However, a follow-through day from at least one of the major averages is also needed as a confirmation of a new rally since recent concerns were raised about the M criteria.
>>> The latest Featured Stock Update with an annotated graph appeared on 11/24/2010. Click here.
View all notes |
Alert me of new notes |
CANSLIM.net Company Profile |
SEC |
Zacks Reports |
StockTalk |
News |
Chart |
Request a new note
C
A N
S L
I M
|
NTAP
-
NASDAQ
Netapp Inc
COMPUTER HARDWARE - Data Storage Devices
|
$51.39
|
+0.54
1.06% |
$51.61
|
6,253,060
80.84% of 50 DAV
50 DAV is 7,735,100
|
$57.96
-11.34%
|
9/8/2010
|
$46.98
|
PP = $44.99
|
|
MB = $47.24
|
Most Recent Note - 11/23/2010 5:10:09 PM
G - Small loss today on light volume led to a close just below its 50 DMA line and prior highs. On 11/19/10 it was noted - "It has not formed a sound base, and the weakness suggests that it may be due for a longer and deeper consolidation."
>>> The latest Featured Stock Update with an annotated graph appeared on 11/3/2010. Click here.
View all notes |
Alert me of new notes |
CANSLIM.net Company Profile |
SEC |
Zacks Reports |
StockTalk |
News |
Chart |
Request a new note
C
A N
S L
I M
|
Symbol/Exchange
Company Name
Industry Group |
PRICE |
CHANGE
(%Change) |
Day High |
Volume
(% DAV)
(% 50 day avg vol) |
52 Wk Hi
% From Hi |
Featured
Date |
Price
Featured |
Pivot Featured |
|
Max Buy |
ORCL
-
NASDAQ
Oracle Corp
COMPUTER SOFTWARE and SERVICES - Application Software
|
$27.74
|
+0.55
2.02% |
$27.88
|
34,964,655
90.17% of 50 DAV
50 DAV is 38,778,300
|
$29.82
-6.98%
|
9/20/2010
|
$27.32
|
PP = $26.73
|
|
MB = $28.07
|
Most Recent Note - 11/23/2010 5:01:16 PM
G- Color code is changed to green after it sank below its DMA line and under the latest chart low today, raising concerns amid widespread market weakness. Gains above its short-term average are needed for its outlook to improve.
>>> The latest Featured Stock Update with an annotated graph appeared on 11/18/2010. Click here.
View all notes |
Alert me of new notes |
CANSLIM.net Company Profile |
SEC |
Zacks Reports |
StockTalk |
News |
Chart |
Request a new note
C
A N
S L
I M
|
PAY
-
NYSE
Verifone Systems Inc
COMPUTER HARDWARE - Transaction Automation Systems
|
$35.00
|
+1.31
3.89% |
$35.00
|
1,525,321
111.10% of 50 DAV
50 DAV is 1,372,900
|
$35.94
-2.62%
|
8/25/2010
|
$24.30
|
PP = $23.74
|
|
MB = $24.93
|
Most Recent Note - 11/24/2010 3:57:31 PM
G - Considerable gain today with near average volume. It has the look of an advanced "ascending base" pattern after an impressive rally from its 7/26/10 breakout.
>>> The latest Featured Stock Update with an annotated graph appeared on 10/25/2010. Click here.
View all notes |
Alert me of new notes |
CANSLIM.net Company Profile |
SEC |
Zacks Reports |
StockTalk |
News |
Chart |
Request a new note
C
A N
S L
I M
|
RAX
-
NYSE
Rackspace Hosting Inc
INTERNET - Internet Software and; Services
|
$28.60
|
+0.89
3.21% |
$28.65
|
1,316,389
49.12% of 50 DAV
50 DAV is 2,680,100
|
$29.35
-2.56%
|
9/21/2010
|
$22.84
|
PP = $23.61
|
|
MB = $24.79
|
Most Recent Note - 11/24/2010 3:48:05 PM
G - Perched -3% away from its all-time high with no resistance remaining due to overhead supply, but it is extended from any sound base.
>>> The latest Featured Stock Update with an annotated graph appeared on 11/17/2010. Click here.
View all notes |
Alert me of new notes |
CANSLIM.net Company Profile |
SEC |
Zacks Reports |
StockTalk |
News |
Chart |
Request a new note
C
A N
S L
I M
|
ROVI
-
NASDAQ
Rovi Corp
COMPUTER SOFTWARE andamp; SERVICES - Security Software andamp; Services
|
$54.49
|
+0.43
0.80% |
$54.92
|
788,477
49.87% of 50 DAV
50 DAV is 1,581,200
|
$55.00
-0.93%
|
10/29/2010
|
$49.99
|
PP = $53.10
|
|
MB = $55.76
|
Most Recent Note - 11/24/2010 4:22:24 PM
Y - Finished today at its second-best close of 2010 after small gain without great volume conviction. Confirming gains on heavy volume coupled with a follow-through day from at least one of the major market averages (M criteria) could help trigger a new (or add-on) technical buy signal. Meanwhile, its 50 DMA line defines important support to watch.
>>> The latest Featured Stock Update with an annotated graph appeared on 10/20/2010. Click here.
View all notes |
Alert me of new notes |
CANSLIM.net Company Profile |
SEC |
Zacks Reports |
StockTalk |
News |
Chart |
Request a new note
C
A N
S L
I M
|
SHOO
-
NASDAQ
Steven Madden Limited
CONSUMER NON-DURABLES - Textile - Apparel Footwear
|
$45.04
|
+0.43
0.96% |
$45.92
|
311,511
88.15% of 50 DAV
50 DAV is 353,400
|
$45.58
-1.18%
|
11/23/2010
|
$44.61
|
PP = $44.95
|
|
MB = $47.20
|
Most Recent Note - 11/23/2010 8:14:00 PM
Y - Color code is changed to yellow with new pivot point cited. No resistance remains due to overhead supply, and above average volume was behind today's 5th consecutive gain as it hit and closed at new 2010 highs. Recently found support above its 50 DMA line and prior chart highs in the $40 area.
>>> The latest Featured Stock Update with an annotated graph appeared on 11/23/2010. Click here.
View all notes |
Alert me of new notes |
CANSLIM.net Company Profile |
SEC |
Zacks Reports |
StockTalk |
News |
Chart |
Request a new note
C
A N
S L
I M
|
Symbol/Exchange
Company Name
Industry Group |
PRICE |
CHANGE
(%Change) |
Day High |
Volume
(% DAV)
(% 50 day avg vol) |
52 Wk Hi
% From Hi |
Featured
Date |
Price
Featured |
Pivot Featured |
|
Max Buy |
SLW
-
NYSE
Silver Wheaton Corp
METALS and; MINING - Silver
|
$35.64
|
+0.12
0.34% |
$36.24
|
7,450,686
80.55% of 50 DAV
50 DAV is 9,250,000
|
$37.20
-4.19%
|
8/25/2010
|
$21.40
|
PP = $21.99
|
|
MB = $23.09
|
Most Recent Note - 11/24/2010 4:20:28 PM
G - Small gain today with light volume for its second-best close ever. Last week's lows define support above its 50 DMA line.
>>> The latest Featured Stock Update with an annotated graph appeared on 10/18/2010. Click here.
View all notes |
Alert me of new notes |
CANSLIM.net Company Profile |
SEC |
Zacks Reports |
StockTalk |
News |
Chart |
Request a new note
C
A N
S L
I M
|
UA
-
NYSE
Under Armour Inc Cl A
CONSUMER NON-DURABLES - Textile - Apparel Clothing
|
$56.58
|
+1.06
1.91% |
$56.43
|
948,176
124.07% of 50 DAV
50 DAV is 764,200
|
$55.81
1.38%
|
9/9/2010
|
$39.99
|
PP = $40.10
|
|
MB = $42.11
|
Most Recent Note - 11/24/2010 4:16:32 PM
G - Volume was above average today as it posted a 7th consecutive gain for a new 52-week high. The high-ranked Apparel - Clothing firm is very extended from any sound base and well above support at its 50 DMA line.
>>> The latest Featured Stock Update with an annotated graph appeared on 11/4/2010. Click here.
View all notes |
Alert me of new notes |
CANSLIM.net Company Profile |
SEC |
Zacks Reports |
StockTalk |
News |
Chart |
Request a new note
C
A N
S L
I M
|
ULTA
-
NASDAQ
Ulta Salon Cosm & Frag
SPECIALTY RETAIL - Specialty Retail, Other
|
$34.47
|
+0.99
2.96% |
$34.74
|
663,675
143.56% of 50 DAV
50 DAV is 462,300
|
$33.50
2.90%
|
9/3/2010
|
$26.36
|
PP = $25.89
|
|
MB = $27.18
|
Most Recent Note - 11/24/2010 1:20:22 PM
G - Today's 3rd consecutive gain helped it hit a new 52-week high, approaching its all-time high of $35.63 from Nov '07. Meanwhile, its 50 DMA line defines initial support to watch.
>>> The latest Featured Stock Update with an annotated graph appeared on 11/1/2010. Click here.
View all notes |
Alert me of new notes |
CANSLIM.net Company Profile |
SEC |
Zacks Reports |
StockTalk |
News |
Chart |
Request a new note
C
A N
S L
I M
|
VIT
-
NYSE
Vanceinfo Tech Inc Ads
COMPUTER SOFTWARE and SERVICES - Business Software and Services
|
$37.67
|
+0.93
2.53% |
$37.24
|
415,877
64.69% of 50 DAV
50 DAV is 642,900
|
$38.43
-1.98%
|
7/8/2010
|
$25.20
|
PP = $26.58
|
|
MB = $27.91
|
Most Recent Note - 11/24/2010 4:31:48 PM
G - No overhead supply remains, and had today's gain ended the week here it would have finished with its best ever weekly close. A positive reversal at its 50 DMA line on 11/17/10 was an indication of prompt support.
>>> The latest Featured Stock Update with an annotated graph appeared on 10/21/2010. Click here.
View all notes |
Alert me of new notes |
CANSLIM.net Company Profile |
SEC |
Zacks Reports |
StockTalk |
News |
Chart |
Request a new note
C
A N
S L
I M
|