***Last / Change / Volume data in this table is the closing quote data***
Symbol/Exchange
Company Name
Industry Group |
PRICE |
CHANGE
(%Change) |
Day High |
Volume
(% DAV)
(% 50 day avg vol) |
52 Wk Hi
% From Hi |
Featured
Date |
Price
Featured |
Pivot Featured |
|
Max Buy |
ABV
-
NYSE
Comp De Bebidas Adr
FOOD and BEVERAGE - Beverages - Brewers
|
$143.69
|
+0.85
0.60% |
$143.97
|
429,160
65.56% of 50 DAV
50 DAV is 654,600
|
$145.36
-1.15%
|
11/4/2010
|
$142.35
|
PP = $143.63
|
|
MB = $150.81
|
 Most Recent Note - 11/22/2010 3:52:06 PM
Y - Clear of virtually all resistance with today's 4th consecutive gain on light volume. Confirming gains to new highs on heavy volume would be a reassuring sign of institutional demand. Meanwhile, a recent low ($133.38 on 10/27/10) defines support above its 50 DMA line.
>>> The latest Featured Stock Update with an annotated graph appeared on 10/11/2010. Click here.
View all notes |
Alert me of new notes |
CANSLIM.net Company Profile |
SEC |
Zacks Reports |
StockTalk |
News |
Chart |
Request a new note
C
A N
S L
I M


|
ARUN
-
NASDAQ
Aruba Networks Inc
COMPUTER HARDWARE - Networking andamp; Communication Dev
|
$24.22
|
+0.88
3.77% |
$24.28
|
3,849,463
153.50% of 50 DAV
50 DAV is 2,507,800
|
$23.85
1.55%
|
8/30/2010
|
$18.12
|
PP = $18.51
|
|
MB = $19.44
|
Most Recent Note - 11/22/2010 12:29:24 PM
G - Touched a new all-time high today, eclipsing its 2007 best. It found support near its 50 DMA line throughout its rally since May, but it has not formed any recent base. Reported earnings +200% on +44% sales revenues for the quarter ended October 31, 2010 versus the year ago period.
>>> The latest Featured Stock Update with an annotated graph appeared on 10/26/2010. Click here.
View all notes |
Alert me of new notes |
CANSLIM.net Company Profile |
SEC |
Zacks Reports |
StockTalk |
News |
Chart |
Request a new note
C
A N
S L
I M
|
BIDU
-
NASDAQ
Baidu Inc Ads
INTERNET - Internet Information Providers
|
$108.87
|
+0.28
0.26% |
$109.61
|
8,056,580
65.46% of 50 DAV
50 DAV is 12,308,400
|
$115.04
-5.36%
|
9/17/2010
|
$85.73
|
PP = $88.42
|
|
MB = $92.84
|
Most Recent Note - 11/17/2010 3:26:46 PM
G - Up on lighter volume today after enduring mild distributional pressure and slumping toward its 50 DMA line. It may produce more climactic gains, however it is extended from a sound base pattern now and a riskier "late stage" candidate. BIDU is up 11-fold from when it was first featured in yellow on October 30, 2006 (read here). Following a deep correction and Bear Market, it has been a fixture on the Featured Stocks page and rallied +212% in the 14 months since returning to prominence September 8, 2009 (read here).
>>> The latest Featured Stock Update with an annotated graph appeared on 10/7/2010. Click here.
View all notes |
Alert me of new notes |
CANSLIM.net Company Profile |
SEC |
Zacks Reports |
StockTalk |
News |
Chart |
Request a new note
C
A N
S L
I M
|
CACC
-
NASDAQ
Credit Acceptance Corp
FINANCIAL SERVICES - Credit Services
|
$59.79
|
+1.01
1.72% |
$60.90
|
87,766
331.19% of 50 DAV
50 DAV is 26,500
|
$63.45
-5.77%
|
11/22/2010
|
$59.97
|
PP = $62.00
|
|
MB = $65.10
|
Most Recent Note - 11/22/2010 3:27:29 PM
Y - Rallied above its 50 DMA line today with a 4th consecutive gain on ever-increasing volume. Color code is changed to yellow with a new slightly lower pivot point cited while currently building on a "double bottom" type base pattern. Its 11/16/10 low ($54.12) defines initial support above its 200 DMA line.
>>> The latest Featured Stock Update with an annotated graph appeared on 10/29/2010. Click here.
View all notes |
Alert me of new notes |
CANSLIM.net Company Profile |
SEC |
Zacks Reports |
StockTalk |
News |
Chart |
Request a new note
C
A N
S L
I M
|
CMG
-
NYSE
Chipotle Mexican Grill
LEISURE - Restaurants
|
$242.92
|
+10.65
4.59% |
$243.98
|
1,331,707
161.07% of 50 DAV
50 DAV is 826,800
|
$240.78
0.89%
|
9/1/2010
|
$158.31
|
PP = $155.52
|
|
MB = $163.30
|
Most Recent Note - 11/22/2010 3:20:25 PM
G - Gain today for another new all-time high. It is extended from any sound base pattern. Its 50 DMA line (now $196) defines the nearest chart support level.
>>> The latest Featured Stock Update with an annotated graph appeared on 10/28/2010. Click here.
View all notes |
Alert me of new notes |
CANSLIM.net Company Profile |
SEC |
Zacks Reports |
StockTalk |
News |
Chart |
Request a new note
C
A N
S L
I M
|
Symbol/Exchange
Company Name
Industry Group |
PRICE |
CHANGE
(%Change) |
Day High |
Volume
(% DAV)
(% 50 day avg vol) |
52 Wk Hi
% From Hi |
Featured
Date |
Price
Featured |
Pivot Featured |
|
Max Buy |
CTRP
-
NASDAQ
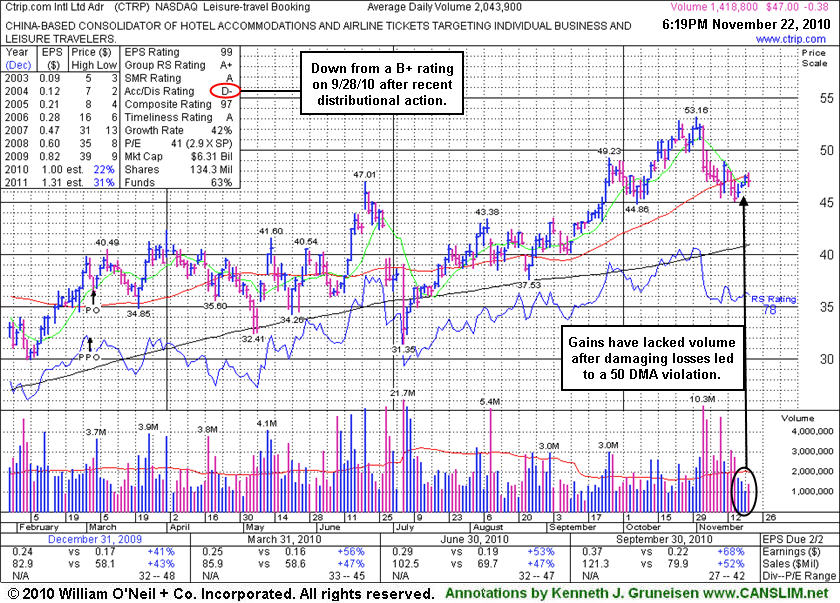
Ctrip.Com Intl Ltd Adr
LEISURE - Resorts and Casinos
|
$47.00
|
-0.38
-0.80% |
$47.85
|
1,418,808
69.42% of 50 DAV
50 DAV is 2,043,900
|
$53.16
-11.59%
|
9/24/2010
|
$46.75
|
PP = $47.11
|
|
MB = $49.47
|
Most Recent Note - 11/22/2010 4:54:42 PM
G - Remains below its 50 DMA line which may now act as a resistance level. Gains lacked volume conviction after losses with above average volume raised concerns, and subsequent losses below its recent low ($45.05 on 11/16/10) would raise even greater concerns.
>>> The latest Featured Stock Update with an annotated graph appeared on 11/22/2010. Click here.
View all notes |
Alert me of new notes |
CANSLIM.net Company Profile |
SEC |
Zacks Reports |
StockTalk |
News |
Chart |
Request a new note
C
A N
S L
I M
|
DECK
-
NASDAQ
Deckers Outdoor Corp
CONSUMER NON-DURABLES - Textile - Apparel Footwear
|
$68.22
|
+1.41
2.11% |
$69.00
|
1,380,772
114.73% of 50 DAV
50 DAV is 1,203,500
|
$67.71
0.75%
|
10/27/2010
|
$54.16
|
PP = $54.86
|
|
MB = $57.60
|
Most Recent Note - 11/22/2010 3:34:48 PM
G - Today's 4th consecutive gain marks another new all-time high. Extended from its latest sound base, its prior highs and its 50 DMA line define the nearest chart support.
>>> The latest Featured Stock Update with an annotated graph appeared on 10/27/2010. Click here.
View all notes |
Alert me of new notes |
CANSLIM.net Company Profile |
SEC |
Zacks Reports |
StockTalk |
News |
Chart |
Request a new note
C
A N
S L
I M
|
EZPW
-
NASDAQ
Ezcorp Inc Cl A
SPECIALTY RETAIL - Specialty Retail, Other
|
$24.72
|
+0.10
0.41% |
$24.80
|
230,800
76.10% of 50 DAV
50 DAV is 303,300
|
$25.65
-3.63%
|
11/5/2010
|
$24.02
|
PP = $23.85
|
|
MB = $25.04
|
Most Recent Note - 11/17/2010 3:05:22 PM
G - Consolidating near its all-time high while recently enduring mild distributional pressure. Prior highs in the $22-23 area define chart support to watch above its 50 DMA line.
>>> The latest Featured Stock Update with an annotated graph appeared on 11/6/2010. Click here.
View all notes |
Alert me of new notes |
CANSLIM.net Company Profile |
SEC |
Zacks Reports |
StockTalk |
News |
Chart |
Request a new note
C
A N
S L
I M
|
FFIV
-
NASDAQ
F 5 Networks Inc
INTERNET - Internet Software and Services
|
$131.94
|
+9.25
7.54% |
$132.20
|
3,667,384
132.21% of 50 DAV
50 DAV is 2,773,900
|
$127.95
3.11%
|
6/16/2010
|
$74.50
|
PP = $74.10
|
|
MB = $77.81
|
Most Recent Note - 11/22/2010 3:07:14 PM
G - Considerable gain today, getting more extended from any sound base pattern. Prior highs in the $112 area define initial chart support.
>>> The latest Featured Stock Update with an annotated graph appeared on 11/15/2010. Click here.
View all notes |
Alert me of new notes |
CANSLIM.net Company Profile |
SEC |
Zacks Reports |
StockTalk |
News |
Chart |
Request a new note
C
A N
S L
I M
|
FOSL
-
NASDAQ
Fossil Inc
CONSUMER DURABLES - Recreational Goods, Other
|
$68.73
|
+0.28
0.41% |
$68.83
|
954,870
121.31% of 50 DAV
50 DAV is 787,100
|
$70.07
-1.91%
|
10/20/2010
|
$54.12
|
PP = $55.61
|
|
MB = $58.39
|
Most Recent Note - 11/18/2010 4:45:56 PM
G - Gapped up today and rallied for its second highest close. Extended from any sound base, meanwhile an upward trendline connecting its July-October lows defines support to watch above its 50 DMA line.
>>> The latest Featured Stock Update with an annotated graph appeared on 10/5/2010. Click here.
View all notes |
Alert me of new notes |
CANSLIM.net Company Profile |
SEC |
Zacks Reports |
StockTalk |
News |
Chart |
Request a new note
C
A N
S L
I M
|
Symbol/Exchange
Company Name
Industry Group |
PRICE |
CHANGE
(%Change) |
Day High |
Volume
(% DAV)
(% 50 day avg vol) |
52 Wk Hi
% From Hi |
Featured
Date |
Price
Featured |
Pivot Featured |
|
Max Buy |
HMSY
-
NASDAQ
H M S Holdings Corp
COMPUTER SOFTWARE and SERVICES - Healthcare Information Service
|
$62.33
|
+0.44
0.71% |
$62.44
|
121,939
56.17% of 50 DAV
50 DAV is 217,100
|
$62.91
-0.92%
|
11/19/2010
|
$61.89
|
PP = $63.01
|
|
MB = $66.16
|
Most Recent Note - 11/19/2010 7:04:55 PM
Y - Gain today with light volume for its second-best close of the year, and no resistance remains due to overhead supply. A new pivot point is cited based on its 52-week high plus ten cents, and a subsequent breakout with volume conviction could trigger a new (or add-on) buy signal. Any violation of its 50 DMA line could raise greater concerns.
>>> The latest Featured Stock Update with an annotated graph appeared on 11/19/2010. Click here.
View all notes |
Alert me of new notes |
CANSLIM.net Company Profile |
SEC |
Zacks Reports |
StockTalk |
News |
Chart |
Request a new note
C
A N
S L
I M
|
HS
-
NYSE
Healthspring Inc
HEALTH SERVICES - Health Care Plans
|
$27.80
|
-0.10
-0.36% |
$28.33
|
477,434
67.17% of 50 DAV
50 DAV is 710,800
|
$29.80
-6.71%
|
8/27/2010
|
$19.91
|
PP = $19.75
|
|
MB = $20.74
|
Most Recent Note - 11/17/2010 3:11:50 PM
G - Hovering -6.6% off its 52-week high, and volume totals have recently been cooling while consolidating above its 50 DMA line which acted as support.
>>> The latest Featured Stock Update with an annotated graph appeared on 10/22/2010. Click here.
View all notes |
Alert me of new notes |
CANSLIM.net Company Profile |
SEC |
Zacks Reports |
StockTalk |
News |
Chart |
Request a new note
C
A N
S L
I M
|
IGTE
-
NASDAQ
Igate Corp
COMPUTER SOFTWARE and SERVICES - Information Technology Service
|
$23.68
|
+0.52
2.25% |
$23.99
|
561,684
80.57% of 50 DAV
50 DAV is 697,100
|
$23.19
2.11%
|
10/26/2010
|
$17.29
|
PP = $19.55
|
|
MB = $20.53
|
Most Recent Note - 11/22/2010 3:32:53 PM
G - Posting a 3rd consecutive gain today with below average volume for a new 52-week high. Extended from its latest base, its prior chart highs in the $19 area define initial chart support above its 50 DMA line.
>>> The latest Featured Stock Update with an annotated graph appeared on 11/11/2010. Click here.
View all notes |
Alert me of new notes |
CANSLIM.net Company Profile |
SEC |
Zacks Reports |
StockTalk |
News |
Chart |
Request a new note
C
A N
S L
I M
|
JOBS
-
NASDAQ
Fifty One Job Inc Ads
DIVERSIFIED SERVICES - Staffing and; Outsourcing Service
|
$47.55
|
+0.19
0.40% |
$47.83
|
52,139
23.79% of 50 DAV
50 DAV is 219,200
|
$51.75
-8.12%
|
10/13/2010
|
$42.07
|
PP = $40.60
|
|
MB = $42.63
|
Most Recent Note - 11/17/2010 2:50:30 PM
G - Gain today on lighter volume follows recent distribution, and it has violated the previously noted initial support defined buy an upward trendline connecting its September-November lows. Its 50 DMA line is the next important support to watch.
>>> The latest Featured Stock Update with an annotated graph appeared on 11/16/2010. Click here.
View all notes |
Alert me of new notes |
CANSLIM.net Company Profile |
SEC |
Zacks Reports |
StockTalk |
News |
Chart |
Request a new note
C
A N
S L
I M
|
LFT
-
NYSE
Longtop Financl Tech Ads
COMPUTER SOFTWARE and SERVICES - Business Software and Services
|
$39.98
|
-0.03
-0.07% |
$40.33
|
645,026
117.60% of 50 DAV
50 DAV is 548,500
|
$42.86
-6.72%
|
11/5/2010
|
$41.83
|
PP = $40.96
|
|
MB = $43.01
|
Most Recent Note - 11/22/2010 3:48:26 PM
Y - Recently consolidating above support near its 50 DMA line. Color code was changed to yellow after a rebound above the $40 level helped its outlook.
>>> The latest Featured Stock Update with an annotated graph appeared on 10/14/2010. Click here.
View all notes |
Alert me of new notes |
CANSLIM.net Company Profile |
SEC |
Zacks Reports |
StockTalk |
News |
Chart |
Request a new note
C
A N
S L
I M
|
Symbol/Exchange
Company Name
Industry Group |
PRICE |
CHANGE
(%Change) |
Day High |
Volume
(% DAV)
(% 50 day avg vol) |
52 Wk Hi
% From Hi |
Featured
Date |
Price
Featured |
Pivot Featured |
|
Max Buy |
LULU
-
NASDAQ
Lululemon Athletica
MANUFACTURING - Textile Manufacturing
|
$53.25
|
+2.65
5.24% |
$53.39
|
1,969,053
182.35% of 50 DAV
50 DAV is 1,079,800
|
$50.85
4.72%
|
10/8/2010
|
$47.66
|
PP = $46.67
|
|
MB = $49.00
|
Most Recent Note - 11/22/2010 1:00:01 PM
G - Trading further above its "max buy" level today for a new 52-week high and 5th consecutive gain. Any slump below its old pivot point would raise concerns, while its 50 DMA line and recent chart low coincide near $45 defining an important support level to watch.
>>> The latest Featured Stock Update with an annotated graph appeared on 10/8/2010. Click here.
View all notes |
Alert me of new notes |
CANSLIM.net Company Profile |
SEC |
Zacks Reports |
StockTalk |
News |
Chart |
Request a new note
C
A N
S L
I M
|
MWIV
-
NASDAQ
M W I Veterinary Supply
HEALTH SERVICES - Medical Instruments and; Supplies
|
$59.19
|
-0.78
-1.30% |
$60.04
|
45,096
77.62% of 50 DAV
50 DAV is 58,100
|
$63.94
-7.43%
|
11/4/2010
|
$61.79
|
PP = $59.60
|
|
MB = $62.58
|
Most Recent Note - 11/22/2010 3:38:50 PM
Y - Perched near its 50 DMA line which has been repeatedly noted as a very important support level. It stalled after hitting its all-time high on 11/04/10, yet held its ground stubbornly above its short-term average.
>>> The latest Featured Stock Update with an annotated graph appeared on 11/2/2010. Click here.
View all notes |
Alert me of new notes |
CANSLIM.net Company Profile |
SEC |
Zacks Reports |
StockTalk |
News |
Chart |
Request a new note
C
A N
S L
I M
|
NEOG
-
NASDAQ
Neogen Corp
DRUGS - Diagnostic Substances
|
$36.33
|
+0.21
0.58% |
$36.43
|
39,570
46.66% of 50 DAV
50 DAV is 84,800
|
$36.90
-1.54%
|
9/1/2010
|
$30.79
|
PP = $30.49
|
|
MB = $32.01
|
Most Recent Note - 11/18/2010 5:45:07 PM
G - Rallied up from its 50 DMA line which recently has been a reliable support level. Any subsequent violation could raise concerns and trigger sell signals. It recently stalled after quietly claiming a new all-time high.
>>> The latest Featured Stock Update with an annotated graph appeared on 10/13/2010. Click here.
View all notes |
Alert me of new notes |
CANSLIM.net Company Profile |
SEC |
Zacks Reports |
StockTalk |
News |
Chart |
Request a new note
C
A N
S L
I M
|
NFLX
-
NASDAQ
Netflix Inc
SPECIALTY RETAIL - Music and Video Stores
|
$188.32
|
+15.28
8.83% |
$188.67
|
10,246,528
186.03% of 50 DAV
50 DAV is 5,508,000
|
$184.74
1.94%
|
11/9/2010
|
$173.10
|
PP = $184.84
|
|
MB = $194.08
|
Most Recent Note - 11/22/2010 1:09:37 PM
Y - Gapped up today, and a strong close could be considered a new (or add-on) technical buy signal. However, NFLX has been noted as a riskier "late stage" set-up, and a follow-through day from at least one of the major averages is also needed as a confirmation of a new rally since recent concerns were raised about the M criteria.
>>> The latest Featured Stock Update with an annotated graph appeared on 10/1/2010. Click here.
View all notes |
Alert me of new notes |
CANSLIM.net Company Profile |
SEC |
Zacks Reports |
StockTalk |
News |
Chart |
Request a new note
C
A N
S L
I M
|
NTAP
-
NASDAQ
Netapp Inc
COMPUTER HARDWARE - Data Storage Devices
|
$52.22
|
+0.76
1.48% |
$52.78
|
6,299,527
81.44% of 50 DAV
50 DAV is 7,735,100
|
$57.96
-9.90%
|
9/8/2010
|
$46.98
|
PP = $44.99
|
|
MB = $47.24
|
Most Recent Note - 11/19/2010 3:37:13 PM
G - Pulling back today after a gap up gain on the prior session quickly repaired violations of its 50 DMA line and prior highs. It has not formed a sound base, and the weakness suggests that it may be due for a longer and deeper consolidation.
>>> The latest Featured Stock Update with an annotated graph appeared on 11/3/2010. Click here.
View all notes |
Alert me of new notes |
CANSLIM.net Company Profile |
SEC |
Zacks Reports |
StockTalk |
News |
Chart |
Request a new note
C
A N
S L
I M
|
Symbol/Exchange
Company Name
Industry Group |
PRICE |
CHANGE
(%Change) |
Day High |
Volume
(% DAV)
(% 50 day avg vol) |
52 Wk Hi
% From Hi |
Featured
Date |
Price
Featured |
Pivot Featured |
|
Max Buy |
ORCL
-
NASDAQ
Oracle Corp
COMPUTER SOFTWARE and SERVICES - Application Software
|
$28.05
|
-0.10
-0.36% |
$28.09
|
27,493,264
70.90% of 50 DAV
50 DAV is 38,778,300
|
$29.82
-5.94%
|
9/20/2010
|
$27.32
|
PP = $26.73
|
|
MB = $28.07
|
Most Recent Note - 11/22/2010 3:41:53 PM
Y - Quietly holding its ground near its 50 DMA line. More damaging losses below its short-term average line or latest chart lows near $27.50 would raise greater concerns.
>>> The latest Featured Stock Update with an annotated graph appeared on 11/18/2010. Click here.
View all notes |
Alert me of new notes |
CANSLIM.net Company Profile |
SEC |
Zacks Reports |
StockTalk |
News |
Chart |
Request a new note
C
A N
S L
I M
|
PAY
-
NYSE
Verifone Systems Inc
COMPUTER HARDWARE - Transaction Automation Systems
|
$34.20
|
+0.39
1.15% |
$34.23
|
1,470,390
107.10% of 50 DAV
50 DAV is 1,372,900
|
$35.94
-4.84%
|
8/25/2010
|
$24.30
|
PP = $23.74
|
|
MB = $24.93
|
Most Recent Note - 11/18/2010 5:47:03 PM
G - Posted a second gain today with above average volume, rallying after news it will acquire Hypercom Corp (HYC) for $7.32 in an all-stock deal. Perched above prior highs ($31.40) and its 50 DMA line while consolidating. It has the look of an advanced "ascending base" pattern after an impressive rally from its 7/26/10 breakout.
>>> The latest Featured Stock Update with an annotated graph appeared on 10/25/2010. Click here.
View all notes |
Alert me of new notes |
CANSLIM.net Company Profile |
SEC |
Zacks Reports |
StockTalk |
News |
Chart |
Request a new note
C
A N
S L
I M
|
RAX
-
NYSE
Rackspace Hosting Inc
INTERNET - Internet Software and; Services
|
$28.28
|
+0.90
3.29% |
$28.40
|
1,770,942
66.08% of 50 DAV
50 DAV is 2,680,100
|
$29.35
-3.65%
|
9/21/2010
|
$22.84
|
PP = $23.61
|
|
MB = $24.79
|
Most Recent Note - 11/22/2010 3:16:11 PM
G - A 4th consecutive gain today has it -3.4% away from its all-time high with no resistance remaining due to overhead supply. It is extended from any sound base.
>>> The latest Featured Stock Update with an annotated graph appeared on 11/17/2010. Click here.
View all notes |
Alert me of new notes |
CANSLIM.net Company Profile |
SEC |
Zacks Reports |
StockTalk |
News |
Chart |
Request a new note
C
A N
S L
I M
|
ROVI
-
NASDAQ
Rovi Corp
COMPUTER SOFTWARE andamp; SERVICES - Security Software andamp; Services
|
$54.70
|
+0.84
1.56% |
$55.00
|
780,954
49.39% of 50 DAV
50 DAV is 1,581,200
|
$54.75
-0.09%
|
10/29/2010
|
$49.99
|
PP = $53.10
|
|
MB = $55.76
|
Most Recent Note - 11/22/2010 3:47:17 PM
Y - Hit another new 2010 high today with a 4th consecutive small gain without great volume conviction. Confirming gains on heavy volume coupled with a follow-through day from at least one of the major market averages (M criteria) could help trigger a new (or add-on) technical buy signal. Meanwhile, its 50 DMA line defines important support to watch.
>>> The latest Featured Stock Update with an annotated graph appeared on 10/20/2010. Click here.
View all notes |
Alert me of new notes |
CANSLIM.net Company Profile |
SEC |
Zacks Reports |
StockTalk |
News |
Chart |
Request a new note
C
A N
S L
I M
|
SHOO
-
NASDAQ
Steven Madden Limited
CONSUMER NON-DURABLES - Textile - Apparel Footwear
|
$44.16
|
+0.73
1.67% |
$44.07
|
172,356
48.77% of 50 DAV
50 DAV is 353,400
|
$44.85
-1.54%
|
9/15/2010
|
$38.94
|
PP = $40.27
|
|
MB = $42.28
|
Most Recent Note - 11/19/2010 3:28:54 PM
G - Gains this week have come on light volume after finding support above its 50 DMA line and prior chart highs in the $40 area. Previously noted it forming a "double bottom" type base short of the minimum 8-weeks length of a proper double bottom pattern.
>>> The latest Featured Stock Update with an annotated graph appeared on 9/29/2010. Click here.
View all notes |
Alert me of new notes |
CANSLIM.net Company Profile |
SEC |
Zacks Reports |
StockTalk |
News |
Chart |
Request a new note
C
A N
S L
I M
|
Symbol/Exchange
Company Name
Industry Group |
PRICE |
CHANGE
(%Change) |
Day High |
Volume
(% DAV)
(% 50 day avg vol) |
52 Wk Hi
% From Hi |
Featured
Date |
Price
Featured |
Pivot Featured |
|
Max Buy |
SLW
-
NYSE
Silver Wheaton Corp
METALS and; MINING - Silver
|
$36.13
|
+1.43
4.12% |
$35.54
|
11,533,296
124.68% of 50 DAV
50 DAV is 9,250,000
|
$37.20
-2.88%
|
8/25/2010
|
$21.40
|
PP = $21.99
|
|
MB = $23.09
|
Most Recent Note - 11/22/2010 3:11:31 PM
G - Poised for a new high close today with its 4th consecutive gain. Last week's lows define support above its 50 DMA line.
>>> The latest Featured Stock Update with an annotated graph appeared on 10/18/2010. Click here.
View all notes |
Alert me of new notes |
CANSLIM.net Company Profile |
SEC |
Zacks Reports |
StockTalk |
News |
Chart |
Request a new note
C
A N
S L
I M
|
UA
-
NYSE
Under Armour Inc Cl A
CONSUMER NON-DURABLES - Textile - Apparel Clothing
|
$54.99
|
+0.74
1.36% |
$55.00
|
1,045,656
136.83% of 50 DAV
50 DAV is 764,200
|
$54.70
0.53%
|
9/9/2010
|
$39.99
|
PP = $40.10
|
|
MB = $42.11
|
Most Recent Note - 11/19/2010 2:47:51 PM
G - Considerable gain today for a new 52-week high, getting more extended from any sound base and support at its 50 DMA line. It has not encountered any distributional pressure and could produce more climactic gains, however fundamental flaws with respect to the fact-based investment system have been recently noted as concerns.
>>> The latest Featured Stock Update with an annotated graph appeared on 11/4/2010. Click here.
View all notes |
Alert me of new notes |
CANSLIM.net Company Profile |
SEC |
Zacks Reports |
StockTalk |
News |
Chart |
Request a new note
C
A N
S L
I M
|
ULTA
-
NASDAQ
Ulta Salon Cosm & Frag
SPECIALTY RETAIL - Specialty Retail, Other
|
$32.69
|
+0.74
2.32% |
$32.80
|
421,038
91.07% of 50 DAV
50 DAV is 462,300
|
$33.50
-2.42%
|
9/3/2010
|
$26.36
|
PP = $25.89
|
|
MB = $27.18
|
Most Recent Note - 11/22/2010 3:31:34 PM
G - Gain today has it now -2.5% away from its 52-week high. Making progress toward its all-time high of $35.63 in Nov '07, meanwhile its 50 DMA line defines initial support to watch.
>>> The latest Featured Stock Update with an annotated graph appeared on 11/1/2010. Click here.
View all notes |
Alert me of new notes |
CANSLIM.net Company Profile |
SEC |
Zacks Reports |
StockTalk |
News |
Chart |
Request a new note
C
A N
S L
I M
|
VIT
-
NYSE
Vanceinfo Tech Inc Ads
COMPUTER SOFTWARE and SERVICES - Business Software and Services
|
$37.88
|
+2.08
5.81% |
$38.18
|
819,992
127.55% of 50 DAV
50 DAV is 642,900
|
$38.43
-1.43%
|
7/8/2010
|
$25.20
|
PP = $26.58
|
|
MB = $27.91
|
Most Recent Note - 11/22/2010 1:32:05 PM
G - Nearly challenging its 52-week high today with a 4th consecutive gain. A positive reversal at its 50 DMA line was an indication of prompt support.
>>> The latest Featured Stock Update with an annotated graph appeared on 10/21/2010. Click here.
View all notes |
Alert me of new notes |
CANSLIM.net Company Profile |
SEC |
Zacks Reports |
StockTalk |
News |
Chart |
Request a new note
C
A N
S L
I M
|