***Last / Change / Volume data in this table is the closing quote data***
Symbol/Exchange
Company Name
Industry Group |
PRICE |
CHANGE
(%Change) |
Day High |
Volume
(% DAV)
(% 50 day avg vol) |
52 Wk Hi
% From Hi |
Featured
Date |
Price
Featured |
Pivot Featured |
|
Max Buy |
BITA
-
NYSE
Bitauto Hldgs Ltd Ads
INTERNET - Internet Information Providers
|
$32.85
|
+2.15
7.00% |
$33.21
|
939,384
86.74% of 50 DAV
50 DAV is 1,083,000
|
$34.47
-4.70%
|
9/24/2013
|
$16.40
|
PP = $17.31
|
|
MB = $18.18
|
 Most Recent Note - 11/21/2013 5:33:10 PM
G - Rallied for a new high close today, getting more extended from any sound base. Prior high in the $28 area define initial support to watch on pullbacks.
>>> FEATURED STOCK ARTICLE : Consolidating After Getting Extended From Prior Base - 11/11/2013
View all notes |
Set NEW NOTE alert |
CANSLIM.net Company Profile |
SEC
News |
Chart |
Request a new note
C
A N
S L
I M


|
BLOX
-
NYSE
Infoblox Inc
COMPUTER HARDWARE - Networking and Communication Dev
|
$42.90
|
+1.09
2.61% |
$43.05
|
504,135
65.23% of 50 DAV
50 DAV is 772,800
|
$48.97
-12.39%
|
10/11/2013
|
$43.02
|
PP = $45.60
|
|
MB = $47.88
|
Most Recent Note - 11/19/2013 6:31:12 PM
G - Violated its 50 DMA line with volume-driven losses triggering a technical sell signal. Disciplined investors limit losses by selling any stock that falls more than -7% from their purchase price. See the latest FSU analysis for more details and new annotated daily and weekly graphs.
>>> FEATURED STOCK ARTICLE : Volume Driven Losses Violated 50-Day Moving Average Line - 11/19/2013
View all notes |
Set NEW NOTE alert |
CANSLIM.net Company Profile |
SEC
News |
Chart |
Request a new note
C
A N
S L
I M
|
CELG
-
NASDAQ
Celgene Corp
DRUGS - Drug Manufacturers - Major
|
$158.61
|
+3.08
1.98% |
$159.43
|
2,691,443
91.83% of 50 DAV
50 DAV is 2,930,800
|
$161.64
-1.88%
|
9/12/2013
|
$149.50
|
PP = $150.02
|
|
MB = $157.52
|
Most Recent Note - 11/18/2013 1:32:00 PM
G - Rebounding above its 50 DMA line today, but recent gains have been lacking great volume conviction. The prior low ($142.10 on 11/07/13) is the next technical support level where a subsequent violation may trigger a more worrisome technical sell signal. Earnings +21% on +18% sales revenues for the Sep '13 quarter were below the +25% minimum guideline (C criteria) raising fundamental concerns.
>>> FEATURED STOCK ARTICLE : Testing 50-Day Average Following Sub Par Earnings Increase - 11/1/2013
View all notes |
Set NEW NOTE alert |
CANSLIM.net Company Profile |
SEC
News |
Chart |
Request a new note
C
A N
S L
I M
|
EGOV
-
NASDAQ
N I C Inc
INTERNET - Internet Software and Services
|
$24.07
|
+0.68
2.91% |
$24.09
|
212,393
70.52% of 50 DAV
50 DAV is 301,200
|
$25.99
-7.39%
|
10/18/2013
|
$25.17
|
PP = $23.66
|
|
MB = $24.84
|
Most Recent Note - 11/21/2013 6:10:12 PM
Y - Up today with below average volume, consolidating above its 50 DMA line. Disciplined investors always limit losses by selling any stock that falls more than -7% from their purchase price.
>>> FEATURED STOCK ARTICLE : Technical Breakout From "Double Bottom" Base on 3 Times Average Volume - 10/18/2013
View all notes |
Set NEW NOTE alert |
CANSLIM.net Company Profile |
SEC
News |
Chart |
Request a new note
C
A N
S L
I M
|
FLT
-
NYSE
Fleetcor Technologies
DIVERSIFIED SERVICES - Business/Management Services
|
$119.36
|
+2.38
2.03% |
$119.72
|
624,305
83.95% of 50 DAV
50 DAV is 743,700
|
$120.51
-0.95%
|
8/19/2013
|
$99.01
|
PP = $100.97
|
|
MB = $106.02
|
Most Recent Note - 11/20/2013 1:31:36 PM
G - Holding its ground near its all-time high, however it has not formed a sound base. Its 50 DMA line ($111.45 now) defines near-term support to watch on pullbacks.
>>> FEATURED STOCK ARTICLE : Perched Near All-Time High Tallying Quiet Gains - 11/13/2013
View all notes |
Set NEW NOTE alert |
CANSLIM.net Company Profile |
SEC
News |
Chart |
Request a new note
C
A N
S L
I M
|
Symbol/Exchange
Company Name
Industry Group |
PRICE |
CHANGE
(%Change) |
Day High |
Volume
(% DAV)
(% 50 day avg vol) |
52 Wk Hi
% From Hi |
Featured
Date |
Price
Featured |
Pivot Featured |
|
Max Buy |
GNRC
-
NYSE
Generac Hldgs Inc
CONSUMER DURABLES - Electronic Equipment
|
$50.86
|
+1.18
2.38% |
$51.00
|
639,886
79.49% of 50 DAV
50 DAV is 805,000
|
$52.32
-2.79%
|
10/24/2013
|
$47.46
|
PP = $44.24
|
|
MB = $46.45
|
Most Recent Note - 11/20/2013 1:33:04 PM
G - Still holding its ground in a tight range near all-time highs, but it has not formed a sound base. Prior highs in the $44 area define near-term support to watch on pullbacks.
>>> FEATURED STOCK ARTICLE : Consolidating After "Breakway Gap" With 4 Times Average Volume - 10/30/2013
View all notes |
Set NEW NOTE alert |
CANSLIM.net Company Profile |
SEC
News |
Chart |
Request a new note
C
A N
S L
I M
|
JAZZ
-
NASDAQ
Jazz Pharmaceuticals Plc
DRUGS - Biotechnology
|
$114.50
|
+2.54
2.27% |
$114.99
|
537,097
72.12% of 50 DAV
50 DAV is 744,700
|
$114.64
-0.12%
|
9/30/2013
|
$93.20
|
PP = $89.10
|
|
MB = $93.56
|
Most Recent Note - 11/20/2013 1:35:08 PM
G- Hitting another new 52-week high with today's 3rd consecutive "wedging" gain average or lighter volume while getting even more extended from any sound base. Disciplined investors avoid chasing stocks more than +5% above prior highs and always limit losses by selling any stock that falls more than -7% from their purchase price.
>>> FEATURED STOCK ARTICLE : Hovering Near All-Time Highs Following Volume-Driven Gains - 11/7/2013
View all notes |
Set NEW NOTE alert |
CANSLIM.net Company Profile |
SEC
News |
Chart |
Request a new note
C
A N
S L
I M
|
KORS
-
NYSE
Michael Kors Hldgs Ltd
RETAIL - Apparel Stores
|
$80.44
|
+1.35
1.71% |
$80.66
|
2,036,094
44.43% of 50 DAV
50 DAV is 4,582,800
|
$83.13
-3.24%
|
8/6/2013
|
$69.66
|
PP = $66.28
|
|
MB = $69.59
|
Most Recent Note - 11/20/2013 1:37:31 PM
G - Volume totals have been cooling while hovering near all-time highs after volume-driven gains to new high territory. Prior highs in the $78 area define near-term support above its 50 DMA line.
>>> FEATURED STOCK ARTICLE : Hitting New Highs After Choppy Consolidation - 11/6/2013
View all notes |
Set NEW NOTE alert |
CANSLIM.net Company Profile |
SEC
News |
Chart |
Request a new note
C
A N
S L
I M
|
LOPE
-
NASDAQ
Grand Canyon Education
DIVERSIFIED SERVICES - Education and; Training Services
|
$44.89
|
+0.74
1.68% |
$45.50
|
385,735
90.40% of 50 DAV
50 DAV is 426,700
|
$50.48
-11.07%
|
6/19/2013
|
$31.47
|
PP = $34.17
|
|
MB = $35.88
|
Most Recent Note - 11/20/2013 1:39:09 PM
G - Consolidating since its considerable volume-driven gain on 10/30/13 for a new high. Repeatedly noted - "Reported earnings +17% on +14% sales revenues for the Sep '13 quarter, its 2nd quarterly comparison with an earnings increase below the +25% minimum guideline (C criteria). Fundamental concerns remain while technical action has been reassuring."
>>> FEATURED STOCK ARTICLE : Formed Advanced Base But Fundamental Concerns Remain - 10/14/2013
View all notes |
Set NEW NOTE alert |
CANSLIM.net Company Profile |
SEC
News |
Chart |
Request a new note
C
A N
S L
I M
|
MRLN
-
NASDAQ
Marlin Business Services
DIVERSIFIED SERVICES - Rental and Leasing Services
|
$24.75
|
+0.44
1.81% |
$24.91
|
12,022
46.78% of 50 DAV
50 DAV is 25,700
|
$28.64
-13.58%
|
9/9/2013
|
$23.75
|
PP = $24.03
|
|
MB = $25.23
|
Most Recent Note - 11/19/2013 4:58:51 PM
G - Slumped further below its 50 DMA line with today's damaging loss raising greater concerns and triggering more worrisome technical sell signals.
>>> FEATURED STOCK ARTICLE : Violated 50-Day Moving Average Line Raising Concerns - 11/14/2013
View all notes |
Set NEW NOTE alert |
CANSLIM.net Company Profile |
SEC
News |
Chart |
Request a new note
C
A N
S L
I M
|
Symbol/Exchange
Company Name
Industry Group |
PRICE |
CHANGE
(%Change) |
Day High |
Volume
(% DAV)
(% 50 day avg vol) |
52 Wk Hi
% From Hi |
Featured
Date |
Price
Featured |
Pivot Featured |
|
Max Buy |
NOAH
-
NYSE
Noah Holdings Ltd Ads
FINANCIAL SERVICES - Asset Management
|
$20.21
|
+0.25
1.25% |
$20.95
|
612,041
75.97% of 50 DAV
50 DAV is 805,600
|
$25.51
-20.78%
|
10/15/2013
|
$19.10
|
PP = $18.33
|
|
MB = $19.25
|
Most Recent Note - 11/20/2013 5:43:21 PM
G - Slumped toward its 50 DMA line with today's 3rd consecutive loss after a worrisome "negative reversal" at its 52-week high. See the latest FSU analysis for more details and new annotated daily and weekly graphs.
>>> FEATURED STOCK ARTICLE : 50-Day Average And Prior Highs Define Important Support - 11/20/2013
View all notes |
Set NEW NOTE alert |
CANSLIM.net Company Profile |
SEC
News |
Chart |
Request a new note
C
A N
S L
I M
|
OII
-
NYSE
Oceaneering Intl Inc
ENERGY - Oil and Gas Drilling and Explorati
|
$79.74
|
-0.19
-0.24% |
$80.57
|
839,361
126.43% of 50 DAV
50 DAV is 663,900
|
$87.64
-9.01%
|
10/16/2013
|
$83.08
|
PP = $84.74
|
|
MB = $88.98
|
Most Recent Note - 11/19/2013 4:57:01 PM
G - Slumped back below its 50 DMA line raising greater concerns with a loss today on higher volume. Recently reported earnings +23% on +16% sales revenues, below the +25% minimum earnings guideline (C criteria) raising concerns.
>>> FEATURED STOCK ARTICLE : Forming Set-Up Above 50-Day Moving Average Line - 10/16/2013
View all notes |
Set NEW NOTE alert |
CANSLIM.net Company Profile |
SEC
News |
Chart |
Request a new note
C
A N
S L
I M
|
PCLN
-
NASDAQ
Priceline.Com Inc
INTERNET - Internet Software and Services
|
$1,159.11
|
+12.02
1.05% |
$1,163.49
|
493,502
76.09% of 50 DAV
50 DAV is 648,600
|
$1,163.98
-0.42%
|
9/13/2013
|
$966.82
|
PP = $995.08
|
|
MB = $1,044.83
|
Most Recent Note - 11/20/2013 12:57:07 PM
G - Hitting yet another new 52-week high with today's gap up gain. Found support at its 50 DMA line on prior pullbacks, however it has not formed any recent sound base pattern. Reported earnings +40% on +33% sales revenues for the Sep '13 quarter versus the year-ago period, improving after a slightly sub par Jun '13 report.
>>> FEATURED STOCK ARTICLE : Rallied to New Highs Following Pullback to 50-day Average - 10/29/2013
View all notes |
Set NEW NOTE alert |
CANSLIM.net Company Profile |
SEC
News |
Chart |
Request a new note
C
A N
S L
I M
|
PRAA
-
NASDAQ
Portfolio Recovery Assoc
DIVERSIFIED SERVICES - Business/Management Services
|
$57.51
|
+2.58
4.70% |
$57.68
|
571,348
131.59% of 50 DAV
50 DAV is 434,200
|
$63.96
-10.09%
|
10/17/2013
|
$60.75
|
PP = $61.70
|
|
MB = $64.79
|
Most Recent Note - 11/21/2013 6:01:40 PM
G - A volume-driven gain today helped it rebound toward its 50 DMA line which is now downward sloping and may act as resistance. A rebound above that short-term average is needed for its outlook to improve. Meanwhile, its Relative Strength rank has slumped to 79, below the 80+ minimum guideline for buy candidates.
>>> FEATURED STOCK ARTICLE : Near 50-Day Moving Average Enduring Distributional Pressure - 11/5/2013
View all notes |
Set NEW NOTE alert |
CANSLIM.net Company Profile |
SEC
News |
Chart |
Request a new note
C
A N
S L
I M
|
PRLB
-
NYSE
Proto Labs Inc
MANUFACTURING - Small Tools and Accessories
|
$78.68
|
+2.20
2.88% |
$79.49
|
444,959
102.76% of 50 DAV
50 DAV is 433,000
|
$89.97
-12.55%
|
7/29/2013
|
$64.86
|
PP = $67.50
|
|
MB = $70.88
|
Most Recent Note - 11/21/2013 6:04:02 PM
G - Following damaging losses it rebounded toward its 50 DMA line with a gain today on near average volume. A rebound above that short-term average is needed to help its outlook improve.
>>> FEATURED STOCK ARTICLE : Undercut 50-Day Moving Average Yet Found Prompt Support - 11/4/2013
View all notes |
Set NEW NOTE alert |
CANSLIM.net Company Profile |
SEC
News |
Chart |
Request a new note
C
A N
S L
I M
|
Symbol/Exchange
Company Name
Industry Group |
PRICE |
CHANGE
(%Change) |
Day High |
Volume
(% DAV)
(% 50 day avg vol) |
52 Wk Hi
% From Hi |
Featured
Date |
Price
Featured |
Pivot Featured |
|
Max Buy |
SFUN
-
NYSE
Soufun Hldgs Ltd Ads A
INTERNET - Internet Information Providers
|
$67.76
|
+2.49
3.81% |
$67.98
|
590,135
37.35% of 50 DAV
50 DAV is 1,579,900
|
$71.62
-5.39%
|
10/17/2013
|
$58.02
|
PP = $53.87
|
|
MB = $56.56
|
Most Recent Note - 11/21/2013 6:05:08 PM
G - Hovering near its all-time high with volume totals cooling. Disciplined investors avoid chasing extended stocks. Prior highs in the $59 area define initial support to watch on pullbacks.
>>> FEATURED STOCK ARTICLE : Perched Near All-Time High After Testing Support - 11/8/2013
View all notes |
Set NEW NOTE alert |
CANSLIM.net Company Profile |
SEC
News |
Chart |
Request a new note
C
A N
S L
I M
|
SSNC
-
NASDAQ
S S & C Technologies
COMPUTER SOFTWARE and SERVICES - Application Software
|
$42.04
|
+1.40
3.44% |
$42.10
|
349,292
81.27% of 50 DAV
50 DAV is 429,800
|
$41.75
0.69%
|
10/22/2013
|
$39.17
|
PP = $40.04
|
|
MB = $42.04
|
Most Recent Note - 11/21/2013 6:08:00 PM
Y - Finished near the session high and at its "max buy" level with a gain today on higher but below average volume. Subsequent losses leading to a close below its old high closes in the $39.50 area would raise concerns and completely negate its recent breakout.
>>> FEATURED STOCK ARTICLE : Volume Totals Cooling Following Recent Volume-Driven Breakout - 11/12/2013
View all notes |
Set NEW NOTE alert |
CANSLIM.net Company Profile |
SEC
News |
Chart |
Request a new note
C
A N
S L
I M
|
SSYS
-
NASDAQ
Stratasys Ltd
COMPUTER HARDWARE - Computer Peripherals
|
$117.01
|
+4.77
4.25% |
$118.00
|
1,510,392
108.30% of 50 DAV
50 DAV is 1,394,600
|
$134.00
-12.68%
|
10/11/2013
|
$102.94
|
PP = $105.38
|
|
MB = $110.65
|
Most Recent Note - 11/21/2013 6:13:14 PM
G - Gain today halted its slide after 2 consecutive volume-driven losses, bouncing back from a test of support at its 50 DMA line. More damaging losses would raise greater concerns and trigger worrisome technical sell signals. Reported earnings +13% on +153% sales revenues, below the +25% minimum earnings guideline (C criteria) raising fundamental concerns.
>>> FEATURED STOCK ARTICLE : Rallying For New Highs Despite Fundamental Flaw Raising Concern - 11/18/2013
View all notes |
Set NEW NOTE alert |
CANSLIM.net Company Profile |
SEC
News |
Chart |
Request a new note
C
A N
S L
I M
|
STMP
-
NASDAQ
Stamps.Com Inc
INTERNET - Internet Software and Services
|
$48.30
|
+2.61
5.71% |
$48.57
|
118,896
109.18% of 50 DAV
50 DAV is 108,900
|
$49.40
-2.23%
|
9/24/2013
|
$45.54
|
PP = $46.57
|
|
MB = $48.90
|
Most Recent Note - 11/21/2013 5:35:19 PM
G - Rallied to match its best-ever close today. Recently held its ground at its 50 DMA line, where more damaging losses would raise greater concerns. Earnings were +24% on +7% sales revenues for the Sep '13 quarter, just below the +25% minimum earnings guideline (C criteria).
>>> FEATURED STOCK ARTICLE : Fundamental Flaw May Prompt Disciplined Investors to Look Elsewhere - 10/31/2013
View all notes |
Set NEW NOTE alert |
CANSLIM.net Company Profile |
SEC
News |
Chart |
Request a new note
C
A N
S L
I M
|
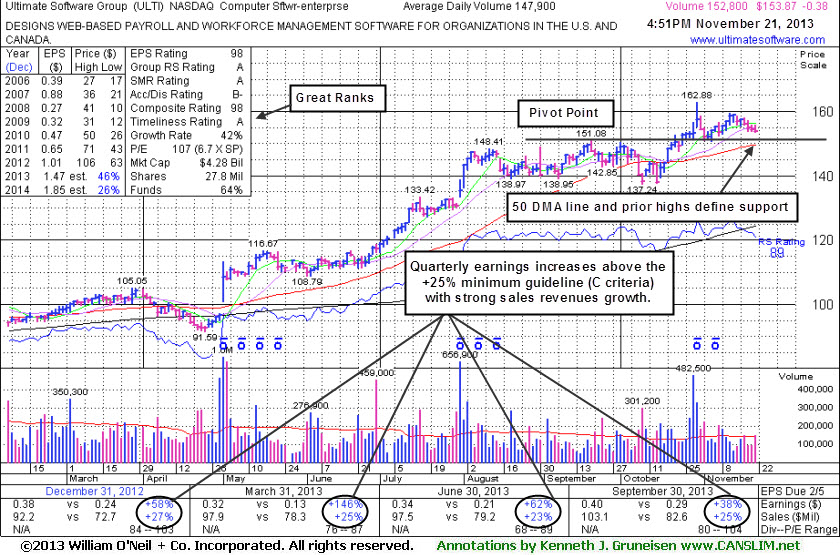
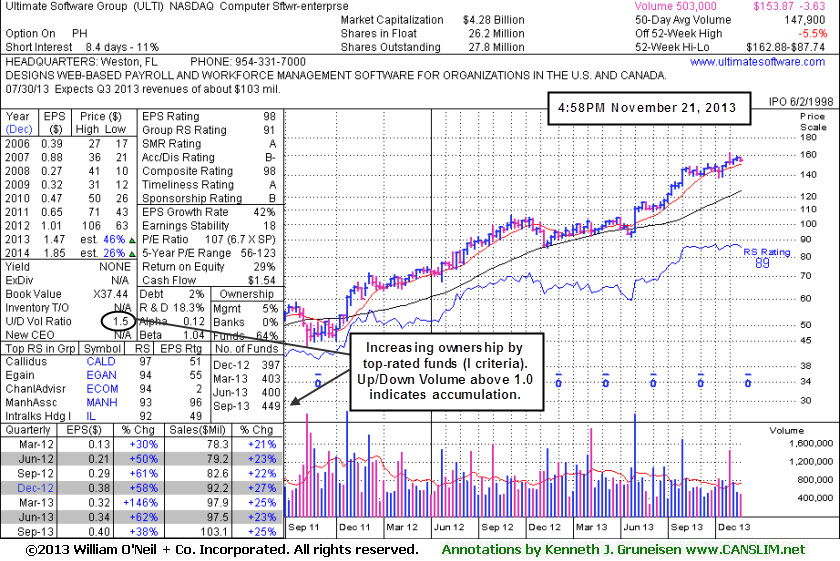
ULTI
-
NASDAQ
Ultimate Software Group
INTERNET - Internet Software and Services
|
$153.87
|
-0.38
-0.25% |
$155.88
|
155,051
104.84% of 50 DAV
50 DAV is 147,900
|
$162.88
-5.53%
|
10/16/2013
|
$142.95
|
PP = $151.18
|
|
MB = $158.74
|
Most Recent Note - 11/21/2013 5:30:47 PM
Y - Volume totals have generally been cooling while holding its ground near its 52-week high yet below its "max buy" level. Prior highs and its 50 DMA line define near-term support. See the latest FSU analysis for more details and new annotated daily and weekly graphs.
>>> FEATURED STOCK ARTICLE : Consolidating Above 50 DMA Line and Prior Highs Defining Support - 11/21/2013
View all notes |
Set NEW NOTE alert |
CANSLIM.net Company Profile |
SEC
News |
Chart |
Request a new note
C
A N
S L
I M
|
Symbol/Exchange
Company Name
Industry Group |
PRICE |
CHANGE
(%Change) |
Day High |
Volume
(% DAV)
(% 50 day avg vol) |
52 Wk Hi
% From Hi |
Featured
Date |
Price
Featured |
Pivot Featured |
|
Max Buy |
VRX
-
NYSE
Valeant Pharmaceuticals
DRUGS - Drug Manufacturers - Other
|
$108.68
|
+2.12
1.99% |
$109.72
|
947,406
80.67% of 50 DAV
50 DAV is 1,174,400
|
$115.40
-5.82%
|
9/11/2013
|
$100.26
|
PP = $105.50
|
|
MB = $110.78
|
Most Recent Note - 11/20/2013 1:41:17 PM
Y - Consolidating in a tight range near its 50 DMA line with volume totals cooling. Recent lows in the $102 area define near-term support where subsequent violations may trigger technical sell signals. Recently reported earnings +24% on +74% sales revenues for the Sep '13 quarter, a notch below the +25% minimum guideline (C criteria).
>>> FEATURED STOCK ARTICLE : Recent Lows Define Support to Watch Below 50 Day Average - 11/15/2013
View all notes |
Set NEW NOTE alert |
CANSLIM.net Company Profile |
SEC
News |
Chart |
Request a new note
C
A N
S L
I M
|
YNDX
-
NASDAQ
Yandex N V Class A
INTERNET - Internet Information Providers
|
$38.00
|
+1.85
5.12% |
$38.16
|
2,593,966
97.62% of 50 DAV
50 DAV is 2,657,200
|
$42.00
-9.52%
|
9/5/2013
|
$34.24
|
PP = $34.79
|
|
MB = $36.53
|
Most Recent Note - 11/21/2013 5:48:35 PM
G - Rebounded and closed back above its 50 DMA line today helping its technical stance improve. Prior lows ($35.59 on 11/08/13 and $34.31 on 10/08/13) defines the next important chart support levels to watch.
>>> FEATURED STOCK ARTICLE : Consolidating After Getting Extended From Sound Base - 10/28/2013
View all notes |
Set NEW NOTE alert |
CANSLIM.net Company Profile |
SEC
News |
Chart |
Request a new note
C
A N
S L
I M
|