You are not logged in.
This means you
CAN ONLY VIEW reports that were published prior to Monday, April 14, 2025.
You
MUST UPGRADE YOUR MEMBERSHIP if you want to see any current reports.
AFTER MARKET UPDATE - WEDNESDAY, NOVEMBER 21ST, 2012
Previous After Market Report Next After Market Report >>>
|
|
|
|
DOW |
+48.38 |
12,836.89 |
+0.38% |
|
Volume |
521,920,450 |
-19% |
|
Volume |
1,356,751,780 |
-12% |
|
NASDAQ |
+9.87 |
2,926.55 |
+0.34% |
|
Advancers |
2,016 |
65% |
|
Advancers |
1,556 |
62% |
|
S&P 500 |
+3.22 |
1,391.03 |
+0.23% |
|
Decliners |
969 |
31% |
|
Decliners |
857 |
34% |
|
Russell 2000 |
+4.57 |
798.38 |
+0.58% |
|
52 Wk Highs |
81 |
|
|
52 Wk Highs |
27 |
|
|
S&P 600 |
+1.79 |
449.43 |
+0.40% |
|
52 Wk Lows |
37 |
|
|
52 Wk Lows |
34 |
|
|
 |
Major Averages Rose With Lighter Pre-Holiday Volume
Kenneth J. Gruneisen - Passed the CAN SLIM® Master's Exam
On Wednesday the major averages posted modest gains. Lighter volume totals reported on the NYSE and on the Nasdaq exchange versus the prior session's totals was a sign of no enthusiastic institutional buying demand ahead of the Thanksgiving holiday. Advancers led decliners by 2-1 on the NYSE and by nearly 2-1 on the Nasdaq exchange. The total number of stocks hitting new 52-week highs outnumbered new 52-week lows on the NYSE, but new lows still outnumbered new 52-week highs on the Nasdaq exchange. There were 26 high-ranked companies from the CANSLIM.net Leaders List making new 52-week highs and appearing on the CANSLIM.net BreakOuts Page, up from the prior session total of 20 stocks. However, there were gains for only 4 of the 11 high-ranked companies currently included on the Featured Stocks Page, disconcertingly negative breadth versus the broader market's mostly positive bias.
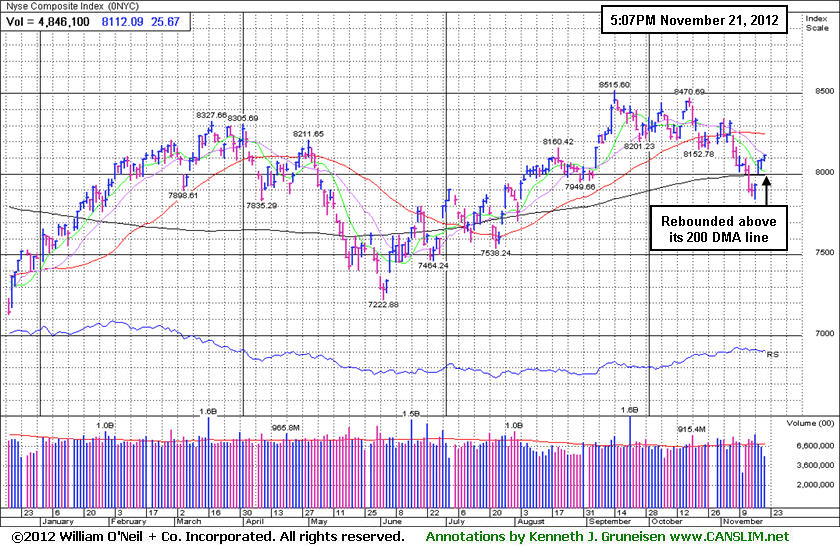
The benchmark S&P 500 Index is above its 200-day moving average (DMA) line, meanwhile the Nasdaq Composite Index and Dow Jones Industrial Average both remain below their respective 200 DMA lines. Stocks held their gains into the closing bell ahead of the Thanksgiving holiday. Markets edged higher throughout the session after Egypt and the United States announced that a cease fire agreement between Israel and Hamas had been reached. This positive development in the Middle East added to the optimism from a largely in-line weekly jobless claims report.
Seven of the 10 sectors on the S&P ended higher, led by gains in energy stocks. On the earnings front, Salesforce.com Inc (CRM +8.83%) rallied following a better-than-expected profit tally. On the downside, Deere & Co (DE -3.67%) slumped after falling short of analysts' expectations. In other news, Flowers Foods Inc (FLO +3.32%) advanced on speculation that the company could buy some of Hostess Brands after a judge ruled that the company could begin bankruptcy procedures.
Turning to fixed income, Treasuries ended lower along the curve. The benchmark 10-year note was down 5/32 to yield 1.69% and the 30-year bond was off 1/8 of a point to yield 2.83%.
Regular readers may note that this commentary first mentioned a "market correction" on October 11th, calling for reduced market exposure repeatedly if investors were not already completely in cash. During market corrections the M criteria argues against new buying efforts and urges investors to take a defensive stance to protect precious capital. That stance can change back to a bullish stance where buying is encouraged when at least one of the three major averages produces a solid follow-through day (FTD). A FTD confirming a new rally requires substantial gains on higher (ideally above average) volume, coupled with healthy leadership and a respectable number of stocks hitting new 52-week highs. Historic studies have shown that a FTD occurring between Days 4-7 of a new rally effort has often signaled the beginning of the most substantial market rallies.
Investors should always limit losses if ever any stock falls more than -7% from their purchase price. Following strict sell rules is precisely how this fact-based investment system prompts investors to reduce exposure and protect cash during market downturns. Keep a watchlist of strong acting stocks with all-key criteria in anticipation of the next confirmed uptrend. See the noteworthy candidates included on the Featured Stocks Page.
Watch for an announcement via email concerning the next WEBCAST. The webcast will also be available via an updated link highlighted at the top of the Premium Member Homepage.
PICTURED: The NYSE Composite Index made an encouraging and prompt rebound above its 200-day moving average (DMA) line. Bargain hunting is never a part of the fact-based approach supported by CANSLIM.net. Until the major averages produce a new confirmed rally with a follow-through day, disciplined investors know that it is most important to be protecting cash.
|
 Kenneth J. Gruneisen started out as a licensed stockbroker in August 1987, a couple of months prior to the historic stock market crash that took the Dow Jones Industrial Average down -22.6% in a single day. He has published daily fact-based fundamental and technical analysis on high-ranked stocks online for two decades. Through FACTBASEDINVESTING.COM, Kenneth provides educational articles, news, market commentary, and other information regarding proven investment systems that work in good times and bad.
Comments contained in the body of this report are technical opinions only and are not necessarily those of Gruneisen Growth Corp. The material herein has been obtained from sources believed to be reliable and accurate, however, its accuracy and completeness cannot be guaranteed. Our firm, employees, and customers may effect transactions, including transactions contrary to any recommendation herein, or have positions in the securities mentioned herein or options with respect thereto. Any recommendation contained in this report may not be suitable for all investors and it is not to be deemed an offer or solicitation on our part with respect to the purchase or sale of any securities. |
|
 |
Tech, Retail, and Gold & Silver Indexes Rose
Kenneth J. Gruneisen - Passed the CAN SLIM® Master's Exam
The tech sector was led higher by the Networking Index ($NWX +1.15%) and the Biotechnology Index ($BTK +1.23%) while the Internet Index ($IIX +0.70%) and Semiconductor Index ($SOX +0.19%) posted smaller gains. The Retail Index ($RLX +0.62%) helped provide a positive influence on the major averages. Defensive groups also had a slightly positive bias as the Healthcare Index ($HMO +0.53%) and Gold & Silver Index ($XAU +1.37%) posted gains. Financial shares were mixed as the Bank Index ($BKX -0.27%) edged lower and the Broker/Dealer Index ($XBD +0.44%) posted a modest gain. The Integrated Oil Index ($XOI +0.53%) and Oil Services Index ($OSX +0.14%) also posted small gains.
Charts courtesy www.stockcharts.com
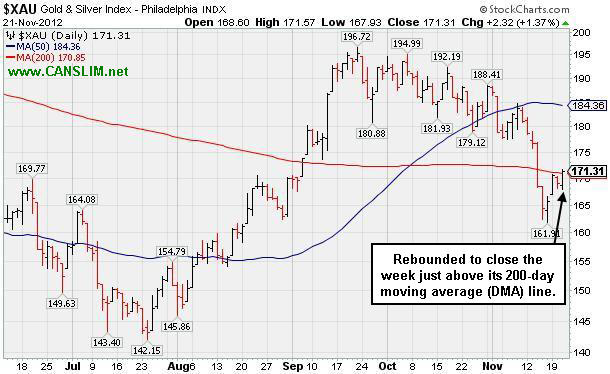
PICTURED: The Gold & Silver Index ($XAU +1.37%) rallied to close the week just above its 200-day moving average (DMA) line.
| Oil Services |
$OSX |
214.99 |
+0.30 |
+0.14% |
-0.60% |
| Healthcare |
$HMO |
2,468.71 |
+12.97 |
+0.53% |
+8.20% |
| Integrated Oil |
$XOI |
1,203.43 |
+6.30 |
+0.53% |
-2.09% |
| Semiconductor |
$SOX |
362.51 |
+0.70 |
+0.19% |
-0.53% |
| Networking |
$NWX |
197.50 |
+2.24 |
+1.15% |
-8.21% |
| Internet |
$IIX |
310.33 |
+2.15 |
+0.70% |
+10.15% |
| Broker/Dealer |
$XBD |
82.87 |
+0.36 |
+0.44% |
-0.48% |
| Retail |
$RLX |
663.33 |
+4.11 |
+0.63% |
+26.78% |
| Gold & Silver |
$XAU |
171.31 |
+2.32 |
+1.37% |
-5.16% |
| Bank |
$BKX |
48.42 |
-0.13 |
-0.27% |
+22.96% |
| Biotech |
$BTK |
1,507.46 |
+18.38 |
+1.23% |
+38.12% |
|
|
|
 |
Bullish Action in Outlier While Market Remains in a Correction
Kenneth J. Gruneisen - Passed the CAN SLIM® Master's Exam
Often, when a leading stock is setting up to breakout of a solid base it is highlighted in CANSLIM.net's Mid-Day Breakouts Report. Sometimes stocks are highlighted shortly after a technical breakout, yet while the potential buy candidate may still be considered action-worthy. The most relevant factors are noted in the report which alerts prudent CANSLIM oriented investors to place the issue in their watch list. After doing any necessary backup research, the investor is prepared to act after the stock triggers a technical buy signal (breaks above its pivot point on more than +50% average turnover) but before it gets too extended from a sound base. In the event the stock fails to trigger a technical buy signal and its price declines then it will simply be removed from the watch list. Disciplined investors know to buy as near as possible to the pivot point and avoid chasing stocks after they have rallied more than +5% above their pivot point. It is crucial to always limit losses whenever any stock heads the wrong direction, and disciplined investors sell if a struggling stock ever falls more than -7% from their purchase price.
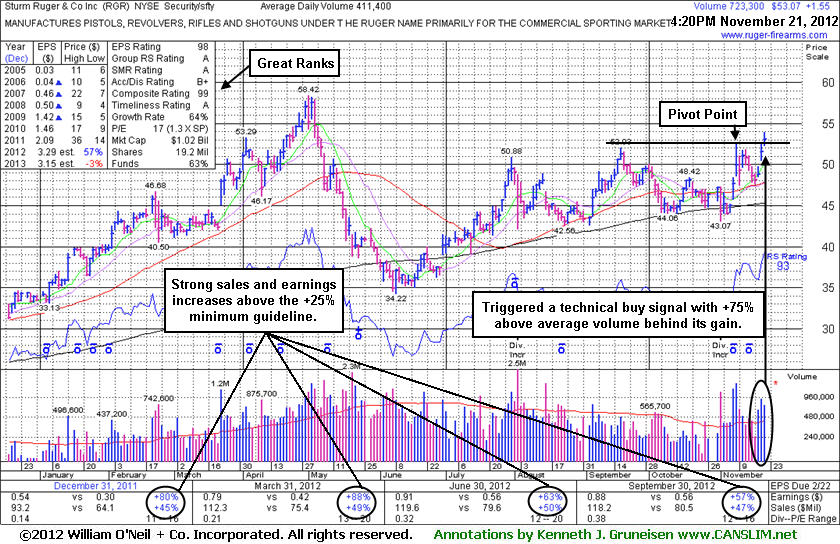
Sturm Ruger & Co Inc (RGR +$1.55 or +3.01% to $53.07) traded up and closed above its pivot point today with volume +75% above average pace. Technically, the gain triggered a buy signal. It still faces a little resistance up through the $58 level. In the 11/20/12 mid-day report (read here) it was highlighted in yellow with pivot point cited based on its 11/08/12 high after a cup-with-handle base with an annotated graph. It already broke out of a "double bottom" base with its volume-driven gain on 11/08/12 clearing the 10/18/12 high of $48.42. The way it encountered resistance near prior highs in the $52 area was a concern following the breakout from the recent double bottom pattern. Its steep decline from its May high urges caution, even though it has rebounded impressively. Additionally, the M criteria remains an overriding concern arguing against new buying efforts until the market produces a follow-through-day, because 3 out of 4 stocks go in the direction of the broader market and the market is still in a correction until noted otherwise.
Since noted on 5/14/12 when dropped from the Featured Stocks list RGR found support near its 200-day moving average (DMA) line during its deep consolidation from highs, then it rebounded impressively. It had first rallied as much as +25.4% higher after it was highlighted in the 3/22/12 mid-day report and shown in that evening's report under the headline "Volume-Driven Breakout Shoots to New High", when a strong finish with more than 4 times average volume helped it clinch a technical buy signal.
It reported earnings +57% on +47% sales revenues for the quarter ended September 30, 2012 versus the year ago period, the 6th consecutive quarterly comparison with a strong earnings increase well above the +25% minimum guideline (C criteria) backed by strong sales revenues growth. It also has a good annual earnings (A criteria) history. The number of top-rated funds owning its shares rose from 282 in Mar '12 to 290 in Sep '12, a slightly reassuring sign concerning the I criteria. Keep in mind that some mutual fund managers are also restricted by their fund family's rules from buying companies that make firearms, tobacco, or alcohol products.
|
|
|
Color Codes Explained :
Y - Better candidates highlighted by our
staff of experts.
G - Previously featured
in past reports as yellow but may no longer be buyable under the
guidelines.
***Last / Change / Volume data in this table is the closing quote data***
Symbol/Exchange
Company Name
Industry Group |
PRICE |
CHANGE
(%Change) |
Day High |
Volume
(% DAV)
(% 50 day avg vol) |
52 Wk Hi
% From Hi |
Featured
Date |
Price
Featured |
Pivot Featured |
|
Max Buy |
CFNL
-
NASDAQ
Cardinal Financial Corp
BANKING - Regional - Southeast Banks
|
$15.07
|
-0.12
-0.76% |
$15.25
|
130,140
84.40% of 50 DAV
50 DAV is 154,200
|
$16.21
-7.06%
|
8/17/2012
|
$12.84
|
PP = $13.31
|
|
MB = $13.98
|
Most Recent Note - 11/20/2012 1:54:09 PM
G - It is extended from its prior base. Prior highs and its 50 DMA line define near-term chart support to watch. More details will be included along with a new annotated graph in this evening's FSU analysis.
>>> The latest Featured Stock Update with an annotated graph appeared on 11/20/2012. Click here.
View all notes |
Alert me of new notes |
CANSLIM.net Company Profile |
SEC |
Zacks Reports |
StockTalk |
News |
Chart |
Request a new note
C
A N
S L
I M


|
CMCSA
-
NASDAQ
Comcast Corp Cl A
MEDIA - CATV Systems
|
$36.49
|
-0.07
-0.19% |
$36.65
|
5,980,807
46.87% of 50 DAV
50 DAV is 12,759,100
|
$37.96
-3.87%
|
6/11/2012
|
$29.94
|
PP = $30.98
|
|
MB = $32.53
|
Most Recent Note - 11/19/2012 7:04:19 PM
G - Gain today on light volume helped it close just 4 cents above its 50 DMA line. See the latest FSU analysis for more details and a new annotated graph.
>>> The latest Featured Stock Update with an annotated graph appeared on 11/19/2012. Click here.
View all notes |
Alert me of new notes |
CANSLIM.net Company Profile |
SEC |
Zacks Reports |
StockTalk |
News |
Chart |
Request a new note
C
A N
S L
I M
|
DVA
-
NYSE
Davita Healthcare Prtns
HEALTH SERVICES - Specialized Health Services
|
$110.01
|
-3.47
-3.06% |
$113.34
|
2,368,635
272.41% of 50 DAV
50 DAV is 869,500
|
$116.50
-5.57%
|
9/5/2012
|
$102.92
|
PP = $100.62
|
|
MB = $105.65
|
 Most Recent Note - 11/21/2012 12:03:41 PM
G - Consolidating -5% off its 52-week high today following a streak of 9 consecutive weekly gains. Fundamental concerns were raised after it reported earnings +3% on +12% sales for the Sep '12 quarter, below the guidelines of the fact-based system.
>>> The latest Featured Stock Update with an annotated graph appeared on 11/8/2012. Click here.
View all notes |
Alert me of new notes |
CANSLIM.net Company Profile |
SEC |
Zacks Reports |
StockTalk |
News |
Chart |
Request a new note
C
A N
S L
I M
|
GPX
-
NYSE
G P Strategies Corp
DIVERSIFIED SERVICES - Education and Training Services
|
$20.30
|
-0.10
-0.49% |
$20.40
|
38,412
62.76% of 50 DAV
50 DAV is 61,200
|
$21.44
-5.32%
|
10/8/2012
|
$20.00
|
PP = $20.77
|
|
MB = $21.81
|
Most Recent Note - 11/20/2012 12:05:59 PM
G - Still holding its ground stubbornly, hovering near its 52-week high. Earnings +0% on +12% sales revenues for the Sep '12 quarter, below the +25% minimum earnings guideline (C criteria) raised fundamental concerns. Deterioration leading to a close below its old high close ($20.27 on 8/17/12) would negate the recent technical breakout, and a violation of its 50 DMA line would be a more worrisome sell signal.
>>> The latest Featured Stock Update with an annotated graph appeared on 11/15/2012. Click here.
View all notes |
Alert me of new notes |
CANSLIM.net Company Profile |
SEC |
Zacks Reports |
StockTalk |
News |
Chart |
Request a new note
C
A N
S L
I M
|
LKQ
-
NASDAQ
L K Q Corp
WHOLESALE - Auto Parts
|
$21.71
|
+0.25
1.16% |
$21.74
|
1,860,212
108.77% of 50 DAV
50 DAV is 1,710,200
|
$21.95
-1.09%
|
8/9/2012
|
$18.97
|
PP = $18.72
|
|
MB = $19.66
|
Most Recent Note - 11/19/2012 7:06:21 PM
G - Today's 3rd consecutive gain came on lighter volume, finishing only -3.2% off its 52-week high. Results below the +25% minimum earnings guideline (C criteria) for Sep '12 recently raised fundamental concerns.
>>> The latest Featured Stock Update with an annotated graph appeared on 11/14/2012. Click here.
View all notes |
Alert me of new notes |
CANSLIM.net Company Profile |
SEC |
Zacks Reports |
StockTalk |
News |
Chart |
Request a new note
C
A N
S L
I M
|
Symbol/Exchange
Company Name
Industry Group |
PRICE |
CHANGE
(%Change) |
Day High |
Volume
(% DAV)
(% 50 day avg vol) |
52 Wk Hi
% From Hi |
Featured
Date |
Price
Featured |
Pivot Featured |
|
Max Buy |
MIDD
-
NASDAQ
Middleby Corp
MANUFACTURING - Diversified Machinery
|
$126.70
|
-0.82
-0.64% |
$127.92
|
52,267
70.92% of 50 DAV
50 DAV is 73,700
|
$128.96
-1.75%
|
10/8/2012
|
$118.46
|
PP = $122.67
|
|
MB = $128.80
|
Most Recent Note - 11/19/2012 7:07:21 PM
Y - Traded up today with below average volume, finishing at its best-ever close. Reported earnings +23% on +18% sales for the Sep '12 quarter, below the +25% minimum earnings guideline (C criteria). The M criteria remains an overriding concern until a FTD confirms a new rally.
>>> The latest Featured Stock Update with an annotated graph appeared on 11/16/2012. Click here.
View all notes |
Alert me of new notes |
CANSLIM.net Company Profile |
SEC |
Zacks Reports |
StockTalk |
News |
Chart |
Request a new note
C
A N
S L
I M
|
RAX
-
NYSE
Rackspace Hosting Inc
INTERNET - Internet Software and; Services
|
$65.77
|
+0.38
0.58% |
$66.43
|
811,113
48.04% of 50 DAV
50 DAV is 1,688,300
|
$69.81
-5.79%
|
11/6/2012
|
$65.44
|
PP = $69.91
|
|
MB = $73.41
|
Most Recent Note - 11/19/2012 1:38:33 PM
G - Today's 3rd consecutive gain has it rebounding toward its 50 DMA line which may act as resistance. Recent gains have lacked great volume conviction following damaging distributional losses.
>>> The latest Featured Stock Update with an annotated graph appeared on 11/6/2012. Click here.
View all notes |
Alert me of new notes |
CANSLIM.net Company Profile |
SEC |
Zacks Reports |
StockTalk |
News |
Chart |
Request a new note
C
A N
S L
I M
|
RGR
-
NYSE
Sturm Ruger & Co Inc
CONSUMER DURABLES - Sporting Goods
|
$53.07
|
+1.55
3.01% |
$53.95
|
723,349
175.83% of 50 DAV
50 DAV is 411,400
|
$58.42
-9.16%
|
11/20/2012
|
$52.23
|
PP = $52.65
|
|
MB = $55.28
|
Most Recent Note - 11/21/2012 5:18:14 PM
Y - Rallied and closed above its pivot point today with +75% above average volume behind its gain while breaking out of a cup-with-handle base. Faces little resistance up through the $58 level. The M criteria remains an overriding concern arguing against new buying efforts until the market produces a follow-through-day. See the latest FSU analysis for more details and a new annotated graph.
>>> The latest Featured Stock Update with an annotated graph appeared on 11/21/2012. Click here.
View all notes |
Alert me of new notes |
CANSLIM.net Company Profile |
SEC |
Zacks Reports |
StockTalk |
News |
Chart |
Request a new note
C
A N
S L
I M
|
RNF
-
NYSE
Rentech Nitrogen Ptnr Lp
CHEMICALS - Agricultural Chemicals
|
$37.44
|
-0.03
-0.08% |
$37.83
|
157,684
39.21% of 50 DAV
50 DAV is 402,200
|
$41.15
-9.02%
|
11/1/2012
|
$39.11
|
PP = $40.15
|
|
MB = $42.16
|
Most Recent Note - 11/19/2012 1:31:00 PM
G - Rebounding back above its 50 DMA line today with a gap up and volume-driven gain helping its technical stance improve. Negative market (M criteria) and a worrisome "negative reversal" were recently noted as concerns.
>>> The latest Featured Stock Update with an annotated graph appeared on 11/2/2012. Click here.
View all notes |
Alert me of new notes |
CANSLIM.net Company Profile |
SEC |
Zacks Reports |
StockTalk |
News |
Chart |
Request a new note
C
A N
S L
I M
|
VSI
-
NYSE
Vitamin Shoppe Inc
SPECIALTY RETAIL - Specialty Retail, Other
|
$58.69
|
-0.22
-0.37% |
$59.50
|
105,946
39.78% of 50 DAV
50 DAV is 266,300
|
$61.89
-5.17%
|
10/15/2012
|
$57.82
|
PP = $60.08
|
|
MB = $63.08
|
Most Recent Note - 11/19/2012 1:34:07 PM
Y -Posting a 3rd consecutive gain today and rallying back above its 50 DMA line. Color code is changed to yellow based on its resilience. It released better than expected earnings +35% on +14% sales revenues for the Sep '12 quarter.
>>> The latest Featured Stock Update with an annotated graph appeared on 11/12/2012. Click here.
View all notes |
Alert me of new notes |
CANSLIM.net Company Profile |
SEC |
Zacks Reports |
StockTalk |
News |
Chart |
Request a new note
C
A N
S L
I M
|
Symbol/Exchange
Company Name
Industry Group |
PRICE |
CHANGE
(%Change) |
Day High |
Volume
(% DAV)
(% 50 day avg vol) |
52 Wk Hi
% From Hi |
Featured
Date |
Price
Featured |
Pivot Featured |
|
Max Buy |
WPI
-
NYSE
Watson Pharmaceuticals
DRUGS - Drugs - Generic
|
$85.26
|
+0.06
0.07% |
$85.44
|
450,163
54.93% of 50 DAV
50 DAV is 819,500
|
$90.00
-5.27%
|
8/24/2012
|
$82.90
|
PP = $81.10
|
|
MB = $85.16
|
Most Recent Note - 11/19/2012 1:35:44 PM
G - Rallying back toward its 50 DMA line today which may act as resistance following last week's violation of that important short-term average. Reported earnings +24% on +19% sales revenues for the Sep '12 quarter, a notch below the +25% minimum guideline (C criteria).
>>> The latest Featured Stock Update with an annotated graph appeared on 11/1/2012. Click here.
View all notes |
Alert me of new notes |
CANSLIM.net Company Profile |
SEC |
Zacks Reports |
StockTalk |
News |
Chart |
Request a new note
C
A N
S L
I M
|
|
|
|
THESE ARE NOT BUY RECOMMENDATIONS!
Comments contained in the body of this report are technical
opinions only. The material herein has been obtained
from sources believed to be reliable and accurate, however,
its accuracy and completeness cannot be guaranteed.
This site is not an investment advisor, hence it does
not endorse or recommend any securities or other investments.
Any recommendation contained in this report may not
be suitable for all investors and it is not to be deemed
an offer or solicitation on our part with respect to
the purchase or sale of any securities. All trademarks,
service marks and trade names appearing in this report
are the property of their respective owners, and are
likewise used for identification purposes only.
This report is a service available
only to active Paid Premium Members.
You may opt-out of receiving report notifications
at any time. Questions or comments may be submitted
by writing to Premium Membership Services 665 S.E. 10 Street, Suite 201 Deerfield Beach, FL 33441-5634 or by calling 1-800-965-8307
or 954-785-1121.
|
|
|

