***Last / Change / Volume data in this table is the closing quote data***
Symbol/Exchange
Company Name
Industry Group |
PRICE |
CHANGE
(%Change) |
Day High |
Volume
(% DAV)
(% 50 day avg vol) |
52 Wk Hi
% From Hi |
Featured
Date |
Price
Featured |
Pivot Featured |
|
Max Buy |
BITA
-
NYSE
Bitauto Hldgs Ltd Ads
INTERNET - Internet Information Providers
|
$30.70
|
+0.73
2.44% |
$31.97
|
780,913
72.67% of 50 DAV
50 DAV is 1,074,600
|
$34.47
-10.94%
|
9/24/2013
|
$16.40
|
PP = $17.31
|
|
MB = $18.18
|
 Most Recent Note - 11/20/2013 1:27:48 PM
G - Small gap up today. Holding its ground near its 52-week high after a "negative reversal" following a streak of 6 consecutive volume-driven gains. Very extended from any sound base, meanwhile, its prior high in the $28 area defines initial support to watch on pullbacks.
>>> FEATURED STOCK ARTICLE : Consolidating After Getting Extended From Prior Base - 11/11/2013
View all notes |
Set NEW NOTE alert |
CANSLIM.net Company Profile |
SEC
News |
Chart |
Request a new note
C
A N
S L
I M


|
BLOX
-
NYSE
Infoblox Inc
COMPUTER HARDWARE - Networking and Communication Dev
|
$41.81
|
-0.14
-0.33% |
$43.35
|
682,733
88.41% of 50 DAV
50 DAV is 772,200
|
$48.97
-14.61%
|
10/11/2013
|
$43.02
|
PP = $45.60
|
|
MB = $47.88
|
Most Recent Note - 11/19/2013 6:31:12 PM
G - Violated its 50 DMA line with volume-driven losses triggering a technical sell signal. Disciplined investors limit losses by selling any stock that falls more than -7% from their purchase price. See the latest FSU analysis for more details and new annotated daily and weekly graphs.
>>> FEATURED STOCK ARTICLE : Volume Driven Losses Violated 50-Day Moving Average Line - 11/19/2013
View all notes |
Set NEW NOTE alert |
CANSLIM.net Company Profile |
SEC
News |
Chart |
Request a new note
C
A N
S L
I M
|
CELG
-
NASDAQ
Celgene Corp
DRUGS - Drug Manufacturers - Major
|
$155.53
|
+1.09
0.71% |
$157.09
|
2,336,456
80.01% of 50 DAV
50 DAV is 2,920,300
|
$161.64
-3.78%
|
9/12/2013
|
$149.50
|
PP = $150.02
|
|
MB = $157.52
|
Most Recent Note - 11/18/2013 1:32:00 PM
G - Rebounding above its 50 DMA line today, but recent gains have been lacking great volume conviction. The prior low ($142.10 on 11/07/13) is the next technical support level where a subsequent violation may trigger a more worrisome technical sell signal. Earnings +21% on +18% sales revenues for the Sep '13 quarter were below the +25% minimum guideline (C criteria) raising fundamental concerns.
>>> FEATURED STOCK ARTICLE : Testing 50-Day Average Following Sub Par Earnings Increase - 11/1/2013
View all notes |
Set NEW NOTE alert |
CANSLIM.net Company Profile |
SEC
News |
Chart |
Request a new note
C
A N
S L
I M
|
EGOV
-
NASDAQ
N I C Inc
INTERNET - Internet Software and Services
|
$23.39
|
-0.09
-0.38% |
$23.87
|
107,049
35.27% of 50 DAV
50 DAV is 303,500
|
$25.99
-10.00%
|
10/18/2013
|
$25.17
|
PP = $23.66
|
|
MB = $24.84
|
Most Recent Note - 11/18/2013 1:33:24 PM
Y - Found support near its 50 DMA line after recently slumping back into its prior base and raising concerns with damaging distributional action. Disciplined investors always limit losses by selling any stock that falls more than -7% from their purchase price.
>>> FEATURED STOCK ARTICLE : Technical Breakout From "Double Bottom" Base on 3 Times Average Volume - 10/18/2013
View all notes |
Set NEW NOTE alert |
CANSLIM.net Company Profile |
SEC
News |
Chart |
Request a new note
C
A N
S L
I M
|
FLT
-
NYSE
Fleetcor Technologies
DIVERSIFIED SERVICES - Business/Management Services
|
$116.98
|
+0.90
0.78% |
$117.71
|
700,791
90.78% of 50 DAV
50 DAV is 772,000
|
$120.51
-2.93%
|
8/19/2013
|
$99.01
|
PP = $100.97
|
|
MB = $106.02
|
Most Recent Note - 11/20/2013 1:31:36 PM
G - Holding its ground near its all-time high, however it has not formed a sound base. Its 50 DMA line ($111.45 now) defines near-term support to watch on pullbacks.
>>> FEATURED STOCK ARTICLE : Perched Near All-Time High Tallying Quiet Gains - 11/13/2013
View all notes |
Set NEW NOTE alert |
CANSLIM.net Company Profile |
SEC
News |
Chart |
Request a new note
C
A N
S L
I M
|
Symbol/Exchange
Company Name
Industry Group |
PRICE |
CHANGE
(%Change) |
Day High |
Volume
(% DAV)
(% 50 day avg vol) |
52 Wk Hi
% From Hi |
Featured
Date |
Price
Featured |
Pivot Featured |
|
Max Buy |
GNRC
-
NYSE
Generac Hldgs Inc
CONSUMER DURABLES - Electronic Equipment
|
$49.68
|
-0.20
-0.40% |
$50.18
|
349,481
42.99% of 50 DAV
50 DAV is 812,900
|
$52.32
-5.05%
|
10/24/2013
|
$47.46
|
PP = $44.24
|
|
MB = $46.45
|
Most Recent Note - 11/20/2013 1:33:04 PM
G - Still holding its ground in a tight range near all-time highs, but it has not formed a sound base. Prior highs in the $44 area define near-term support to watch on pullbacks.
>>> FEATURED STOCK ARTICLE : Consolidating After "Breakway Gap" With 4 Times Average Volume - 10/30/2013
View all notes |
Set NEW NOTE alert |
CANSLIM.net Company Profile |
SEC
News |
Chart |
Request a new note
C
A N
S L
I M
|
JAZZ
-
NASDAQ
Jazz Pharmaceuticals Plc
DRUGS - Biotechnology
|
$111.96
|
+1.96
1.78% |
$114.64
|
664,375
89.74% of 50 DAV
50 DAV is 740,300
|
$111.32
0.58%
|
9/30/2013
|
$93.20
|
PP = $89.10
|
|
MB = $93.56
|
Most Recent Note - 11/20/2013 1:35:08 PM
G- Hitting another new 52-week high with today's 3rd consecutive "wedging" gain average or lighter volume while getting even more extended from any sound base. Disciplined investors avoid chasing stocks more than +5% above prior highs and always limit losses by selling any stock that falls more than -7% from their purchase price.
>>> FEATURED STOCK ARTICLE : Hovering Near All-Time Highs Following Volume-Driven Gains - 11/7/2013
View all notes |
Set NEW NOTE alert |
CANSLIM.net Company Profile |
SEC
News |
Chart |
Request a new note
C
A N
S L
I M
|
KORS
-
NYSE
Michael Kors Hldgs Ltd
RETAIL - Apparel Stores
|
$79.09
|
-0.84
-1.05% |
$80.61
|
3,071,199
66.46% of 50 DAV
50 DAV is 4,621,300
|
$83.13
-4.86%
|
8/6/2013
|
$69.66
|
PP = $66.28
|
|
MB = $69.59
|
Most Recent Note - 11/20/2013 1:37:31 PM
G - Volume totals have been cooling while hovering near all-time highs after volume-driven gains to new high territory. Prior highs in the $78 area define near-term support above its 50 DMA line.
>>> FEATURED STOCK ARTICLE : Hitting New Highs After Choppy Consolidation - 11/6/2013
View all notes |
Set NEW NOTE alert |
CANSLIM.net Company Profile |
SEC
News |
Chart |
Request a new note
C
A N
S L
I M
|
LOPE
-
NASDAQ
Grand Canyon Education
DIVERSIFIED SERVICES - Education and; Training Services
|
$44.15
|
-0.67
-1.49% |
$45.28
|
476,677
112.53% of 50 DAV
50 DAV is 423,600
|
$50.48
-12.54%
|
6/19/2013
|
$31.47
|
PP = $34.17
|
|
MB = $35.88
|
Most Recent Note - 11/20/2013 1:39:09 PM
G - Consolidating since its considerable volume-driven gain on 10/30/13 for a new high. Repeatedly noted - "Reported earnings +17% on +14% sales revenues for the Sep '13 quarter, its 2nd quarterly comparison with an earnings increase below the +25% minimum guideline (C criteria). Fundamental concerns remain while technical action has been reassuring."
>>> FEATURED STOCK ARTICLE : Formed Advanced Base But Fundamental Concerns Remain - 10/14/2013
View all notes |
Set NEW NOTE alert |
CANSLIM.net Company Profile |
SEC
News |
Chart |
Request a new note
C
A N
S L
I M
|
MRLN
-
NASDAQ
Marlin Business Services
DIVERSIFIED SERVICES - Rental and Leasing Services
|
$24.31
|
+0.31
1.29% |
$24.39
|
15,801
58.09% of 50 DAV
50 DAV is 27,200
|
$28.64
-15.12%
|
9/9/2013
|
$23.75
|
PP = $24.03
|
|
MB = $25.23
|
Most Recent Note - 11/19/2013 4:58:51 PM
G - Slumped further below its 50 DMA line with today's damaging loss raising greater concerns and triggering more worrisome technical sell signals.
>>> FEATURED STOCK ARTICLE : Violated 50-Day Moving Average Line Raising Concerns - 11/14/2013
View all notes |
Set NEW NOTE alert |
CANSLIM.net Company Profile |
SEC
News |
Chart |
Request a new note
C
A N
S L
I M
|
Symbol/Exchange
Company Name
Industry Group |
PRICE |
CHANGE
(%Change) |
Day High |
Volume
(% DAV)
(% 50 day avg vol) |
52 Wk Hi
% From Hi |
Featured
Date |
Price
Featured |
Pivot Featured |
|
Max Buy |
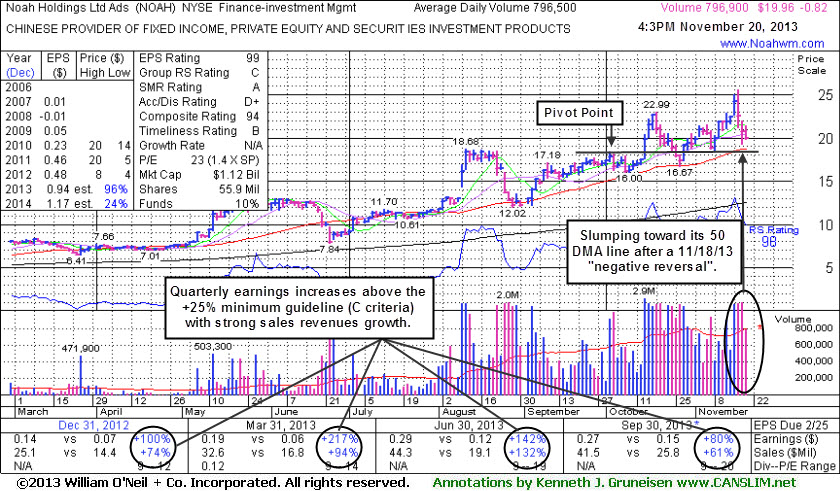
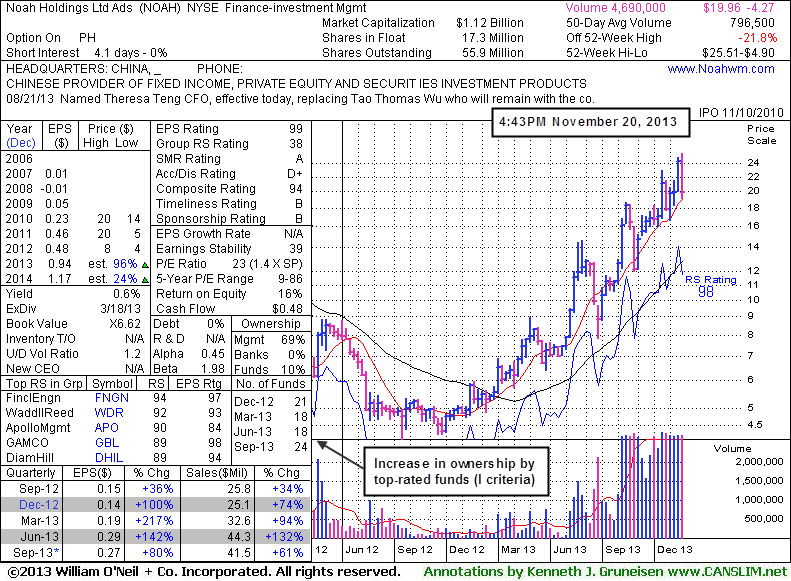
NOAH
-
NYSE
Noah Holdings Ltd Ads
FINANCIAL SERVICES - Asset Management
|
$19.96
|
-0.82
-3.95% |
$21.35
|
796,962
100.06% of 50 DAV
50 DAV is 796,500
|
$25.51
-21.76%
|
10/15/2013
|
$19.10
|
PP = $18.33
|
|
MB = $19.25
|
Most Recent Note - 11/20/2013 5:43:21 PM
G - Slumped toward its 50 DMA line with today's 3rd consecutive loss after a worrisome "negative reversal" at its 52-week high. See the latest FSU analysis for more details and new annotated daily and weekly graphs.
>>> FEATURED STOCK ARTICLE : 50-Day Average And Prior Highs Define Important Support - 11/20/2013
View all notes |
Set NEW NOTE alert |
CANSLIM.net Company Profile |
SEC
News |
Chart |
Request a new note
C
A N
S L
I M
|
OII
-
NYSE
Oceaneering Intl Inc
ENERGY - Oil and Gas Drilling and Explorati
|
$79.93
|
-0.31
-0.39% |
$80.51
|
604,634
91.60% of 50 DAV
50 DAV is 660,100
|
$87.64
-8.80%
|
10/16/2013
|
$83.08
|
PP = $84.74
|
|
MB = $88.98
|
Most Recent Note - 11/19/2013 4:57:01 PM
G - Slumped back below its 50 DMA line raising greater concerns with a loss today on higher volume. Recently reported earnings +23% on +16% sales revenues, below the +25% minimum earnings guideline (C criteria) raising concerns.
>>> FEATURED STOCK ARTICLE : Forming Set-Up Above 50-Day Moving Average Line - 10/16/2013
View all notes |
Set NEW NOTE alert |
CANSLIM.net Company Profile |
SEC
News |
Chart |
Request a new note
C
A N
S L
I M
|
PCLN
-
NASDAQ
Priceline.Com Inc
INTERNET - Internet Software and Services
|
$1,147.09
|
+28.67
2.56% |
$1,163.98
|
975,204
153.31% of 50 DAV
50 DAV is 636,100
|
$1,145.00
0.18%
|
9/13/2013
|
$966.82
|
PP = $995.08
|
|
MB = $1,044.83
|
Most Recent Note - 11/20/2013 12:57:07 PM
G - Hitting yet another new 52-week high with today's gap up gain. Found support at its 50 DMA line on prior pullbacks, however it has not formed any recent sound base pattern. Reported earnings +40% on +33% sales revenues for the Sep '13 quarter versus the year-ago period, improving after a slightly sub par Jun '13 report.
>>> FEATURED STOCK ARTICLE : Rallied to New Highs Following Pullback to 50-day Average - 10/29/2013
View all notes |
Set NEW NOTE alert |
CANSLIM.net Company Profile |
SEC
News |
Chart |
Request a new note
C
A N
S L
I M
|
PRAA
-
NASDAQ
Portfolio Recovery Assoc
DIVERSIFIED SERVICES - Business/Management Services
|
$54.93
|
-0.01
-0.02% |
$56.16
|
479,649
111.03% of 50 DAV
50 DAV is 432,000
|
$63.96
-14.12%
|
10/17/2013
|
$60.75
|
PP = $61.70
|
|
MB = $64.79
|
Most Recent Note - 11/18/2013 1:13:37 PM
G - Holding its ground after undercutting the previously noted low ($56.20 on 10/09/13) defining an important chart support level to watch. Remains below its 50 DMA line after a streak of losses marked by volume raised concerns, and a rebound above that short-term average is needed for its outlook to improve.
>>> FEATURED STOCK ARTICLE : Near 50-Day Moving Average Enduring Distributional Pressure - 11/5/2013
View all notes |
Set NEW NOTE alert |
CANSLIM.net Company Profile |
SEC
News |
Chart |
Request a new note
C
A N
S L
I M
|
PRLB
-
NYSE
Proto Labs Inc
MANUFACTURING - Small Tools and Accessories
|
$76.48
|
-3.41
-4.27% |
$80.23
|
1,002,910
237.54% of 50 DAV
50 DAV is 422,200
|
$89.97
-14.99%
|
7/29/2013
|
$64.86
|
PP = $67.50
|
|
MB = $70.88
|
Most Recent Note - 11/20/2013 1:21:17 PM
G - Suffering another damaging loss with above average volume today after violating its 50 DMA line on the prior session triggering a technical sell signal. Only a prompt rebound above that short-term average would help its outlook improve.
>>> FEATURED STOCK ARTICLE : Undercut 50-Day Moving Average Yet Found Prompt Support - 11/4/2013
View all notes |
Set NEW NOTE alert |
CANSLIM.net Company Profile |
SEC
News |
Chart |
Request a new note
C
A N
S L
I M
|
Symbol/Exchange
Company Name
Industry Group |
PRICE |
CHANGE
(%Change) |
Day High |
Volume
(% DAV)
(% 50 day avg vol) |
52 Wk Hi
% From Hi |
Featured
Date |
Price
Featured |
Pivot Featured |
|
Max Buy |
SFUN
-
NYSE
Soufun Hldgs Ltd Ads A
INTERNET - Internet Information Providers
|
$65.27
|
-2.16
-3.20% |
$68.86
|
882,347
55.55% of 50 DAV
50 DAV is 1,588,400
|
$71.62
-8.87%
|
10/17/2013
|
$58.02
|
PP = $53.87
|
|
MB = $56.56
|
Most Recent Note - 11/18/2013 1:18:03 PM
G - Hitting new all-time highs today. Disciplined investors avoid chasing extended stocks. Prior highs in the $59 area define initial support to watch on pullbacks.
>>> FEATURED STOCK ARTICLE : Perched Near All-Time High After Testing Support - 11/8/2013
View all notes |
Set NEW NOTE alert |
CANSLIM.net Company Profile |
SEC
News |
Chart |
Request a new note
C
A N
S L
I M
|
SSNC
-
NASDAQ
S S & C Technologies
COMPUTER SOFTWARE and SERVICES - Application Software
|
$40.64
|
+0.89
2.24% |
$40.95
|
297,853
68.63% of 50 DAV
50 DAV is 434,000
|
$41.75
-2.66%
|
10/22/2013
|
$39.17
|
PP = $40.04
|
|
MB = $42.04
|
Most Recent Note - 11/18/2013 1:21:56 PM
Y - Volume totals have still been cooling while consolidating since its 11/04/13 breakout gain. That is a sign that very few investors have headed to the exit while it remains perched near its all-time highs. Subsequent losses leading to a close below its old high closes in the $39.50 area would raise concerns and completely negate its recent breakout.
>>> FEATURED STOCK ARTICLE : Volume Totals Cooling Following Recent Volume-Driven Breakout - 11/12/2013
View all notes |
Set NEW NOTE alert |
CANSLIM.net Company Profile |
SEC
News |
Chart |
Request a new note
C
A N
S L
I M
|
SSYS
-
NASDAQ
Stratasys Ltd
COMPUTER HARDWARE - Computer Peripherals
|
$112.24
|
-4.68
-4.00% |
$121.04
|
3,234,384
241.03% of 50 DAV
50 DAV is 1,341,900
|
$134.00
-16.24%
|
10/11/2013
|
$102.94
|
PP = $105.38
|
|
MB = $110.65
|
Most Recent Note - 11/20/2013 1:24:09 PM
G - Pulling back today for a 2nd consecutive volume-driven loss, undercutting prior highs in the $113 area defining initial support. Reported earnings +13% on +153% sales revenues, below the +25% minimum earnings guideline (C criteria) raising fundamental concerns. See the latest FSU analysis for more details and annotated daily and weekly graphs.
>>> FEATURED STOCK ARTICLE : Rallying For New Highs Despite Fundamental Flaw Raising Concern - 11/18/2013
View all notes |
Set NEW NOTE alert |
CANSLIM.net Company Profile |
SEC
News |
Chart |
Request a new note
C
A N
S L
I M
|
STMP
-
NASDAQ
Stamps.Com Inc
INTERNET - Internet Software and Services
|
$45.69
|
-1.34
-2.85% |
$47.12
|
83,968
76.75% of 50 DAV
50 DAV is 109,400
|
$49.40
-7.51%
|
9/24/2013
|
$45.54
|
PP = $46.57
|
|
MB = $48.90
|
Most Recent Note - 11/18/2013 1:24:03 PM
G - Challenging its 52-week high today. Recently held its ground at its 50 DMA line, where more damaging losses would raise greater concerns. Fundamental concerns were raised by waning sales revenues and earnings increases. Reported earnings +24% on +7% sales revenues for the Sep '13 quarter, just below the +25% minimum earnings guideline (C criteria).
>>> FEATURED STOCK ARTICLE : Fundamental Flaw May Prompt Disciplined Investors to Look Elsewhere - 10/31/2013
View all notes |
Set NEW NOTE alert |
CANSLIM.net Company Profile |
SEC
News |
Chart |
Request a new note
C
A N
S L
I M
|
ULTI
-
NASDAQ
Ultimate Software Group
INTERNET - Internet Software and Services
|
$154.25
|
-0.73
-0.47% |
$155.92
|
97,450
65.76% of 50 DAV
50 DAV is 148,200
|
$162.88
-5.30%
|
10/16/2013
|
$142.95
|
PP = $151.18
|
|
MB = $158.74
|
Most Recent Note - 11/18/2013 1:26:52 PM
Y - Volume totals have been cooling while still holding its ground near its 52-week high yet below its "max buy" level, remaining above prior highs defining initial support.
>>> FEATURED STOCK ARTICLE : Hovering Less Than -5% From 52-Week High - 10/17/2013
View all notes |
Set NEW NOTE alert |
CANSLIM.net Company Profile |
SEC
News |
Chart |
Request a new note
C
A N
S L
I M
|
Symbol/Exchange
Company Name
Industry Group |
PRICE |
CHANGE
(%Change) |
Day High |
Volume
(% DAV)
(% 50 day avg vol) |
52 Wk Hi
% From Hi |
Featured
Date |
Price
Featured |
Pivot Featured |
|
Max Buy |
VRX
-
NYSE
Valeant Pharmaceuticals
DRUGS - Drug Manufacturers - Other
|
$106.56
|
+0.64
0.60% |
$107.54
|
769,917
65.44% of 50 DAV
50 DAV is 1,176,600
|
$115.40
-7.66%
|
9/11/2013
|
$100.26
|
PP = $105.50
|
|
MB = $110.78
|
Most Recent Note - 11/20/2013 1:41:17 PM
Y - Consolidating in a tight range near its 50 DMA line with volume totals cooling. Recent lows in the $102 area define near-term support where subsequent violations may trigger technical sell signals. Recently reported earnings +24% on +74% sales revenues for the Sep '13 quarter, a notch below the +25% minimum guideline (C criteria).
>>> FEATURED STOCK ARTICLE : Recent Lows Define Support to Watch Below 50 Day Average - 11/15/2013
View all notes |
Set NEW NOTE alert |
CANSLIM.net Company Profile |
SEC
News |
Chart |
Request a new note
C
A N
S L
I M
|
YNDX
-
NASDAQ
Yandex N V Class A
INTERNET - Internet Information Providers
|
$36.15
|
-0.82
-2.22% |
$37.82
|
2,878,370
108.84% of 50 DAV
50 DAV is 2,644,500
|
$42.00
-13.93%
|
9/5/2013
|
$34.24
|
PP = $34.79
|
|
MB = $36.53
|
Most Recent Note - 11/19/2013 6:34:28 PM
G - Violated its 50 DMA line and closed near the session low with a big loss on lighter than average volume today. Prior lows ($35.59 on 11/08/13 and $34.31 on 10/08/13) defines the next important chart support levels to watch.
>>> FEATURED STOCK ARTICLE : Consolidating After Getting Extended From Sound Base - 10/28/2013
View all notes |
Set NEW NOTE alert |
CANSLIM.net Company Profile |
SEC
News |
Chart |
Request a new note
C
A N
S L
I M
|