You are not logged in.
This means you
CAN ONLY VIEW reports that were published prior to Monday, April 14, 2025.
You
MUST UPGRADE YOUR MEMBERSHIP if you want to see any current reports.
AFTER MARKET UPDATE - TUESDAY, NOVEMBER 20TH, 2012
Previous After Market Report Next After Market Report >>>
|
|
|
|
DOW |
-7.45 |
12,788.51 |
-0.06% |
|
Volume |
644,533,610 |
-9% |
|
Volume |
1,534,678,830 |
-10% |
|
NASDAQ |
+0.61 |
2,916.68 |
+0.02% |
|
Advancers |
1,682 |
53% |
|
Advancers |
1,159 |
45% |
|
S&P 500 |
+0.93 |
1,387.82 |
+0.07% |
|
Decliners |
1,347 |
43% |
|
Decliners |
1,282 |
50% |
|
Russell 2000 |
+0.75 |
793.81 |
+0.09% |
|
52 Wk Highs |
75 |
|
|
52 Wk Highs |
27 |
|
|
S&P 600 |
-3.94 |
457.34 |
-0.85% |
|
52 Wk Lows |
31 |
|
|
52 Wk Lows |
57 |
|
|
 |
Major Averages End Mixed on Lighter Volume
Kenneth J. Gruneisen - Passed the CAN SLIM® Master's Exam
On Tuesday the major averages were mixed and little changed with lighter volume totals on the NYSE and on the Nasdaq exchange versus the prior session's totals, a sign of calm in the market but no enthusiastic institutional buying demand ahead of the Thanksgiving holiday. Advancers led decliners on the NYSE, but decliners narrowly took the lead on the Nasdaq exchange on the very evenly mixed session. The total number of stocks hitting new 52-week highs outnumbered new 52-week lows on the NYSE, but new lows still outnumbered new 52-week highs on the Nasdaq exchange. There were 20 high-ranked companies from the CANSLIM.net Leaders List making new 52-week highs and appearing on the CANSLIM.net BreakOuts Page, matching the prior session total of 20 stocks. There were gains for 6 of the 11 high-ranked companies currently included on the Featured Stocks Page.
Stocks recovered from their session lows as investors shrugged off Moody's downgrade of France and looked to positive economic data. Better-than-expected results in October housing starts are helping lift equities.
Gains in consumer stocks helped boost the market. Homebuilders were leading the space with D.R. Horton Inc (DHI +2.21%) and Lennar Corp (LEN +3.50%) advancing. Financials also showed some strength with Bank of America Corp (BAC +1.48%). On the earnings front, Hewlett-Packard Co (HPQ -11.95%) fell as the company announced it would be taking an $8.8 billion write-off from its previous acquisition of Autonomy. Also among earnings, Best Buy Inc (BBY -13.02%) sank after falling short of analysts' expectations in the quarter.
Regular readers may note that this commentary first mentioned a "market correction" on October 11th, calling for reduced market exposure repeatedly if investors were not already completely in cash. During market corrections the M criteria argues against new buying efforts and urges investors to take a defensive stance to protect precious capital. That stance can change back to a bullish stance where buying is encouraged when at least one of the three major averages produces a solid follow-through day (FTD). A FTD confirming a new rally requires substantial gains on higher (ideally above average) volume, coupled with healthy leadership and a respectable number of stocks hitting new 52-week highs. Historic studies have shown that a FTD occurring between Days 4-7 of a new rally effort has often signaled the beginning of the most substantial market rallies.
Investors should always limit losses if ever any stock falls more than -7% from their purchase price. Following strict sell rules is precisely how this fact-based investment system prompts investors to reduce exposure and protect cash during market downturns. Keep a watchlist of strong acting stocks with all-key criteria in anticipation of the next confirmed uptrend. See the noteworthy candidates included on the Featured Stocks Page.
Watch for an announcement via email concerning the next WEBCAST. The webcast will also be available via an updated link highlighted at the top of the Premium Member Homepage.
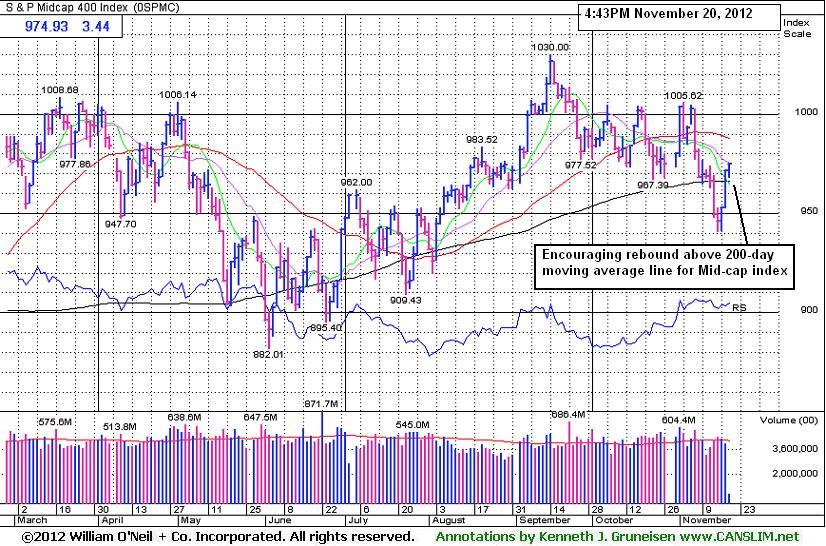
PICTURED: The S&P 400 Mid-Cap Index has made an encouraging and prompt rebound above its 200-day moving average (DMA) line. Bargain hunting is never a part of the fact-based approach supported by CANSLIM.net. Until the major averages produce a new confirmed rally with a follow-through day, disciplined investors know that it is most important to be protecting cash.
|
 Kenneth J. Gruneisen started out as a licensed stockbroker in August 1987, a couple of months prior to the historic stock market crash that took the Dow Jones Industrial Average down -22.6% in a single day. He has published daily fact-based fundamental and technical analysis on high-ranked stocks online for two decades. Through FACTBASEDINVESTING.COM, Kenneth provides educational articles, news, market commentary, and other information regarding proven investment systems that work in good times and bad.
Comments contained in the body of this report are technical opinions only and are not necessarily those of Gruneisen Growth Corp. The material herein has been obtained from sources believed to be reliable and accurate, however, its accuracy and completeness cannot be guaranteed. Our firm, employees, and customers may effect transactions, including transactions contrary to any recommendation herein, or have positions in the securities mentioned herein or options with respect thereto. Any recommendation contained in this report may not be suitable for all investors and it is not to be deemed an offer or solicitation on our part with respect to the purchase or sale of any securities. |
|
 |
Bank Index Posted Encouraging Gains at 200-Day Average
Kenneth J. Gruneisen - Passed the CAN SLIM® Master's Exam
Commodity-linked groups fell as the Gold & Silver Index ($XAU -0.93%) and Oil Services Index ($OSX -0.97%) lost nearly -1% each and the Integrated Oil Index ($XOI -0.19%) inched lower. The Retail Index ($RLX +0.50%) and Broker/Dealer Index ($XBD -0.45%) created a drag on the major averages. The tech sector was mixed as the Semiconductor Index ($SOX -0.37%) and Networking Index ($NWX -0.33%) edged lower, the Internet Index ($IIX +0.21%) edged higher, and the Biotechnology Index ($BTK +1.48%) was a standout gainer.
Charts courtesy www.stockcharts.com
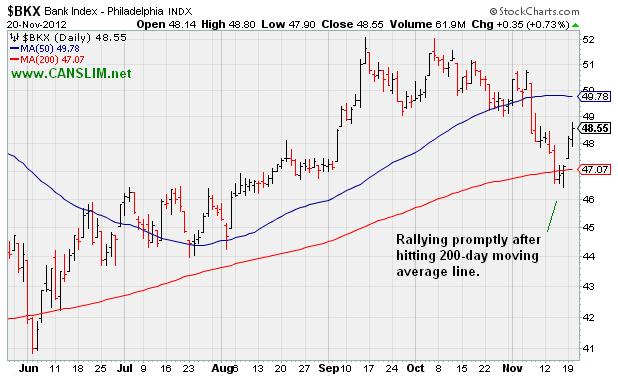
PICTURED: The Bank Index ($BKX +0.73%) has rallied promptly after hitting its 200-day moving average (DMA) line, an encourgaing sign as long as the recent low is not violated. Financials have proven a reliable leading indicator, as long-time readers should know.
| Oil Services |
$OSX |
214.69 |
-2.10 |
-0.97% |
-0.74% |
| Healthcare |
$HMO |
2,455.74 |
-3.57 |
-0.15% |
+7.63% |
| Integrated Oil |
$XOI |
1,197.12 |
-2.33 |
-0.19% |
-2.60% |
| Semiconductor |
$SOX |
361.81 |
-1.33 |
-0.37% |
-0.72% |
| Networking |
$NWX |
195.25 |
-0.64 |
-0.33% |
-9.25% |
| Internet |
$IIX |
308.18 |
+0.65 |
+0.21% |
+9.38% |
| Broker/Dealer |
$XBD |
82.51 |
-0.37 |
-0.45% |
-0.91% |
| Retail |
$RLX |
659.24 |
+3.31 |
+0.50% |
+24.41% |
| Gold & Silver |
$XAU |
168.99 |
-1.59 |
-0.93% |
-6.45% |
| Bank |
$BKX |
48.55 |
+0.35 |
+0.73% |
+23.29% |
| Biotech |
$BTK |
1,489.09 |
+21.76 |
+1.48% |
+36.43% |
|
|
|
 |
Consolidating After Surge of +26% in Just Over 3 Months
Kenneth J. Gruneisen - Passed the CAN SLIM® Master's Exam
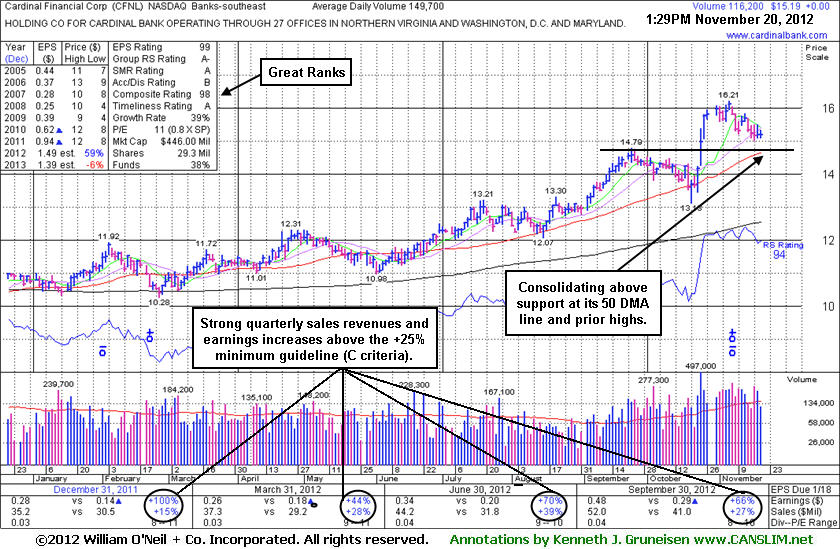
Cardinal Financial Corp (CFNL (CFNL -$0.01 or -0.07% to $15.18) has been repeatedly noted while extended from its prior base - "Prior high ($14.79 on 9/24/12) defines initial support to watch above its 50 DMA line. Disciplined investors may watch out for worrisome technical sell signals while awaiting a new base or secondary buy point and more favorable market."
CFNL has rallied +26.15% from $12.85 when first featured in the 7/20/12 mid-day report (read here). It was last shown in this FSU section on 10/25/12 with an annotated graph under the headline, "Cardinal Financial Flies Against Tough Market Headwinds", as it tallied a 3rd consecutive big gain with heavy volume and finished near the session high at a new 52-week high. Prior analysis included a look at a tactic taught in the Certification where a valid secondary buy point exists from when a stock successfully tests its 10-week moving average (WMA) line up to +5% above its latest highs following an earlier technical breakout. That approach is good for the first test of the 10 WMA only following a valid breakout, however, as subsequent tests of the 10 WMA have historically proven to be more failure prone unless it builds anew base of sufficient length.
The prior FSU analysis also reminded members - "It may go on to produce bigger gains, but keep in mind that the fact-based investment system argues for locking in gains when you have a solid +20% gain. Sometimes it is not worth it to stick around wait for sell signals and technical damage to mount, especially when the market direction is negative and the M criteria is arguing that 3 out of 4 stocks may be expected to decline."
The high-ranked leader hailing from the Banks - Southeast industry group reported earnings +66% on +27% sales revenues for the quarter ended September 30, 2012 versus the year ago period, continuing its track record of strong quarterly earnings comparisons underpinned by encouraging sales revenues increases. It has earned high ranks and matches favorably with the C and A criteria. The number of top-rated funds owning its shares rose from 172 in Sep '11 to 184 in Sep '12, a slightly reassuring sign concerning the I criteria. Its small supply (S criteria) of only 29.3 millions shares outstanding is a favorable characteristic, yet it can contribute to greater price volatility in the event of institutional accumulation or distributional pressure.
|
|
|
Color Codes Explained :
Y - Better candidates highlighted by our
staff of experts.
G - Previously featured
in past reports as yellow but may no longer be buyable under the
guidelines.
***Last / Change / Volume data in this table is the closing quote data***
Symbol/Exchange
Company Name
Industry Group |
PRICE |
CHANGE
(%Change) |
Day High |
Volume
(% DAV)
(% 50 day avg vol) |
52 Wk Hi
% From Hi |
Featured
Date |
Price
Featured |
Pivot Featured |
|
Max Buy |
CFNL
-
NASDAQ
Cardinal Financial Corp
BANKING - Regional - Southeast Banks
|
$15.18
|
-0.01
-0.07% |
$15.33
|
282,382
198.30% of 50 DAV
50 DAV is 142,400
|
$16.21
-6.35%
|
8/17/2012
|
$12.84
|
PP = $13.31
|
|
MB = $13.98
|
 Most Recent Note - 11/20/2012 1:54:09 PM
G - It is extended from its prior base. Prior highs and its 50 DMA line define near-term chart support to watch. More details will be included along with a new annotated graph in this evening's FSU analysis.
>>> The latest Featured Stock Update with an annotated graph appeared on 11/20/2012. Click here.
View all notes |
Alert me of new notes |
CANSLIM.net Company Profile |
SEC |
Zacks Reports |
StockTalk |
News |
Chart |
Request a new note
C
A N
S L
I M


|
CMCSA
-
NASDAQ
Comcast Corp Cl A
MEDIA - CATV Systems
|
$36.56
|
+0.55
1.53% |
$36.62
|
11,059,218
86.82% of 50 DAV
50 DAV is 12,738,600
|
$37.96
-3.69%
|
6/11/2012
|
$29.94
|
PP = $30.98
|
|
MB = $32.53
|
Most Recent Note - 11/19/2012 7:04:19 PM
G - Gain today on light volume helped it close just 4 cents above its 50 DMA line. See the latest FSU analysis for more details and a new annotated graph.
>>> The latest Featured Stock Update with an annotated graph appeared on 11/19/2012. Click here.
View all notes |
Alert me of new notes |
CANSLIM.net Company Profile |
SEC |
Zacks Reports |
StockTalk |
News |
Chart |
Request a new note
C
A N
S L
I M
|
DVA
-
NYSE
Davita Healthcare Prtns
HEALTH SERVICES - Specialized Health Services
|
$113.48
|
-0.52
-0.46% |
$114.24
|
1,107,286
126.34% of 50 DAV
50 DAV is 876,400
|
$116.50
-2.59%
|
9/5/2012
|
$102.92
|
PP = $100.62
|
|
MB = $105.65
|
Most Recent Note - 11/20/2012 1:55:45 PM
G - Still stubbornly holding its ground only -2.8% off its 52-week high today following a streak of 9 consecutive weekly gains. Fundamental concerns were raised after it reported earnings +3% on +12% sales for the Sep '12 quarter, below the guidelines of the fact-based system.
>>> The latest Featured Stock Update with an annotated graph appeared on 11/8/2012. Click here.
View all notes |
Alert me of new notes |
CANSLIM.net Company Profile |
SEC |
Zacks Reports |
StockTalk |
News |
Chart |
Request a new note
C
A N
S L
I M
|
GPX
-
NYSE
G P Strategies Corp
DIVERSIFIED SERVICES - Education and Training Services
|
$20.40
|
-0.13
-0.63% |
$20.75
|
103,081
177.12% of 50 DAV
50 DAV is 58,200
|
$21.44
-4.85%
|
10/8/2012
|
$20.00
|
PP = $20.77
|
|
MB = $21.81
|
Most Recent Note - 11/20/2012 12:05:59 PM
G - Still holding its ground stubbornly, hovering near its 52-week high. Earnings +0% on +12% sales revenues for the Sep '12 quarter, below the +25% minimum earnings guideline (C criteria) raised fundamental concerns. Deterioration leading to a close below its old high close ($20.27 on 8/17/12) would negate the recent technical breakout, and a violation of its 50 DMA line would be a more worrisome sell signal.
>>> The latest Featured Stock Update with an annotated graph appeared on 11/15/2012. Click here.
View all notes |
Alert me of new notes |
CANSLIM.net Company Profile |
SEC |
Zacks Reports |
StockTalk |
News |
Chart |
Request a new note
C
A N
S L
I M
|
LKQ
-
NASDAQ
L K Q Corp
WHOLESALE - Auto Parts
|
$21.46
|
+0.21
0.99% |
$21.56
|
1,833,988
109.64% of 50 DAV
50 DAV is 1,672,800
|
$21.95
-2.23%
|
8/9/2012
|
$18.97
|
PP = $18.72
|
|
MB = $19.66
|
Most Recent Note - 11/19/2012 7:06:21 PM
G - Today's 3rd consecutive gain came on lighter volume, finishing only -3.2% off its 52-week high. Results below the +25% minimum earnings guideline (C criteria) for Sep '12 recently raised fundamental concerns.
>>> The latest Featured Stock Update with an annotated graph appeared on 11/14/2012. Click here.
View all notes |
Alert me of new notes |
CANSLIM.net Company Profile |
SEC |
Zacks Reports |
StockTalk |
News |
Chart |
Request a new note
C
A N
S L
I M
|
Symbol/Exchange
Company Name
Industry Group |
PRICE |
CHANGE
(%Change) |
Day High |
Volume
(% DAV)
(% 50 day avg vol) |
52 Wk Hi
% From Hi |
Featured
Date |
Price
Featured |
Pivot Featured |
|
Max Buy |
MIDD
-
NASDAQ
Middleby Corp
MANUFACTURING - Diversified Machinery
|
$127.52
|
+0.54
0.43% |
$127.72
|
39,821
50.41% of 50 DAV
50 DAV is 79,000
|
$128.96
-1.12%
|
10/8/2012
|
$118.46
|
PP = $122.67
|
|
MB = $128.80
|
Most Recent Note - 11/19/2012 7:07:21 PM
Y - Traded up today with below average volume, finishing at its best-ever close. Reported earnings +23% on +18% sales for the Sep '12 quarter, below the +25% minimum earnings guideline (C criteria). The M criteria remains an overriding concern until a FTD confirms a new rally.
>>> The latest Featured Stock Update with an annotated graph appeared on 11/16/2012. Click here.
View all notes |
Alert me of new notes |
CANSLIM.net Company Profile |
SEC |
Zacks Reports |
StockTalk |
News |
Chart |
Request a new note
C
A N
S L
I M
|
RAX
-
NYSE
Rackspace Hosting Inc
INTERNET - Internet Software and; Services
|
$65.39
|
+0.84
1.30% |
$65.59
|
1,277,460
75.10% of 50 DAV
50 DAV is 1,700,900
|
$69.81
-6.33%
|
11/6/2012
|
$65.44
|
PP = $69.91
|
|
MB = $73.41
|
Most Recent Note - 11/19/2012 1:38:33 PM
G - Today's 3rd consecutive gain has it rebounding toward its 50 DMA line which may act as resistance. Recent gains have lacked great volume conviction following damaging distributional losses.
>>> The latest Featured Stock Update with an annotated graph appeared on 11/6/2012. Click here.
View all notes |
Alert me of new notes |
CANSLIM.net Company Profile |
SEC |
Zacks Reports |
StockTalk |
News |
Chart |
Request a new note
C
A N
S L
I M
|
RGR
-
NYSE
Sturm Ruger & Co Inc
CONSUMER DURABLES - Sporting Goods
|
$51.52
|
+2.69
5.51% |
$52.56
|
895,596
218.81% of 50 DAV
50 DAV is 409,300
|
$58.42
-11.81%
|
11/20/2012
|
$52.23
|
PP = $52.65
|
|
MB = $55.28
|
Most Recent Note - 11/20/2012
Y - Gapped up today and it faces little resistance up through the $58 level. Color code is changed to yellow with pivot point based on its 11/08/12 high after a cup-with-handle base. The M criteria remains an overriding concern arguing against new buying efforts until the market produces a follow-through-day. Since last noted on 5/14/12 when dropped from the Featured Stocks list it found support near its 200 DMA line during its deep consolidation from highs, then it rebounded impressively.

>>> The latest Featured Stock Update with an annotated graph appeared on 3/22/2012. Click here.
View all notes |
Alert me of new notes |
CANSLIM.net Company Profile |
SEC |
Zacks Reports |
StockTalk |
News |
Chart |
Request a new note
C
A N
S L
I M
|
RNF
-
NYSE
Rentech Nitrogen Ptnr Lp
CHEMICALS - Agricultural Chemicals
|
$37.47
|
-0.45
-1.19% |
$38.19
|
188,189
46.55% of 50 DAV
50 DAV is 404,300
|
$41.15
-8.94%
|
11/1/2012
|
$39.11
|
PP = $40.15
|
|
MB = $42.16
|
Most Recent Note - 11/19/2012 1:31:00 PM
G - Rebounding back above its 50 DMA line today with a gap up and volume-driven gain helping its technical stance improve. Negative market (M criteria) and a worrisome "negative reversal" were recently noted as concerns.
>>> The latest Featured Stock Update with an annotated graph appeared on 11/2/2012. Click here.
View all notes |
Alert me of new notes |
CANSLIM.net Company Profile |
SEC |
Zacks Reports |
StockTalk |
News |
Chart |
Request a new note
C
A N
S L
I M
|
VSI
-
NYSE
Vitamin Shoppe Inc
SPECIALTY RETAIL - Specialty Retail, Other
|
$58.91
|
-0.92
-1.54% |
$60.41
|
225,149
78.34% of 50 DAV
50 DAV is 287,400
|
$61.89
-4.81%
|
10/15/2012
|
$57.82
|
PP = $60.08
|
|
MB = $63.08
|
Most Recent Note - 11/19/2012 1:34:07 PM
Y -Posting a 3rd consecutive gain today and rallying back above its 50 DMA line. Color code is changed to yellow based on its resilience. It released better than expected earnings +35% on +14% sales revenues for the Sep '12 quarter.
>>> The latest Featured Stock Update with an annotated graph appeared on 11/12/2012. Click here.
View all notes |
Alert me of new notes |
CANSLIM.net Company Profile |
SEC |
Zacks Reports |
StockTalk |
News |
Chart |
Request a new note
C
A N
S L
I M
|
Symbol/Exchange
Company Name
Industry Group |
PRICE |
CHANGE
(%Change) |
Day High |
Volume
(% DAV)
(% 50 day avg vol) |
52 Wk Hi
% From Hi |
Featured
Date |
Price
Featured |
Pivot Featured |
|
Max Buy |
WPI
-
NYSE
Watson Pharmaceuticals
DRUGS - Drugs - Generic
|
$85.20
|
+0.21
0.25% |
$85.36
|
423,117
50.38% of 50 DAV
50 DAV is 839,800
|
$90.00
-5.33%
|
8/24/2012
|
$82.90
|
PP = $81.10
|
|
MB = $85.16
|
Most Recent Note - 11/19/2012 1:35:44 PM
G - Rallying back toward its 50 DMA line today which may act as resistance following last week's violation of that important short-term average. Reported earnings +24% on +19% sales revenues for the Sep '12 quarter, a notch below the +25% minimum guideline (C criteria).
>>> The latest Featured Stock Update with an annotated graph appeared on 11/1/2012. Click here.
View all notes |
Alert me of new notes |
CANSLIM.net Company Profile |
SEC |
Zacks Reports |
StockTalk |
News |
Chart |
Request a new note
C
A N
S L
I M
|
|
|
|
THESE ARE NOT BUY RECOMMENDATIONS!
Comments contained in the body of this report are technical
opinions only. The material herein has been obtained
from sources believed to be reliable and accurate, however,
its accuracy and completeness cannot be guaranteed.
This site is not an investment advisor, hence it does
not endorse or recommend any securities or other investments.
Any recommendation contained in this report may not
be suitable for all investors and it is not to be deemed
an offer or solicitation on our part with respect to
the purchase or sale of any securities. All trademarks,
service marks and trade names appearing in this report
are the property of their respective owners, and are
likewise used for identification purposes only.
This report is a service available
only to active Paid Premium Members.
You may opt-out of receiving report notifications
at any time. Questions or comments may be submitted
by writing to Premium Membership Services 665 S.E. 10 Street, Suite 201 Deerfield Beach, FL 33441-5634 or by calling 1-800-965-8307
or 954-785-1121.
|
|
|

