You are not logged in.
This means you
CAN ONLY VIEW reports that were published prior to Monday, April 14, 2025.
You
MUST UPGRADE YOUR MEMBERSHIP if you want to see any current reports.
AFTER MARKET UPDATE - MONDAY, NOVEMBER 19TH, 2012
Previous After Market Report Next After Market Report >>>
|
|
|
|
DOW |
+207.65 |
12,795.96 |
+1.65% |
|
Volume |
710,888,430 |
-25% |
|
Volume |
1,704,255,770 |
-20% |
|
NASDAQ |
+62.94 |
2,916.07 |
+2.21% |
|
Advancers |
2,715 |
87% |
|
Advancers |
1,950 |
76% |
|
S&P 500 |
+27.01 |
1,386.89 |
+1.99% |
|
Decliners |
359 |
11% |
|
Decliners |
523 |
20% |
|
Russell 2000 |
+15.34 |
791.62 |
+1.98% |
|
52 Wk Highs |
54 |
|
|
52 Wk Highs |
22 |
|
|
S&P 600 |
-3.94 |
457.34 |
-0.85% |
|
52 Wk Lows |
26 |
|
|
52 Wk Lows |
59 |
|
|
 |
Major Averages Posted Solid Gains With Less Volume
Kenneth J. Gruneisen - Passed the CAN SLIM® Master's Exam
Monday's big gains for the major averages were backed by lighter volume totals on the NYSE and on the Nasdaq exchange versus the prior session's totals, a sign of less enthusiastic institutional buying demand, however options expirations had boosted Friday's reported volume totals. Advancers led decliners by more than 7-1 on the NYSE and by nearly 4-1 on the Nasdaq exchange. The total number of stocks hitting new 52-week highs outnumbered new 52-week lows on the NYSE, but new lows still outnumbered new 52-week highs on the Nasdaq exchange. Leadership improved as there were 20 high-ranked companies from the CANSLIM.net Leaders List making new 52-week highs and appearing on the CANSLIM.net BreakOuts Page, up from the prior session total of 8 stocks. There were gains for all 10 high-ranked companies currently included on the Featured Stocks Page, a list that has been shrinking lately while the market environment has deteriorated.
Stocks advanced from the opening bell and economic data helped lift equities. October existing home sales unexpectedly rose +2.1% and the housing market index rose more than consensus projections. Some investors were encouraged by positive comments from President Obama regarding the fiscal cliff.
Nine of the 10 sectors on the S&P ended higher, led by gains in tech stocks. Shares of Apple Inc (AAPL +7.21%) led the rally, rebounding after touching a nine-month low last week. Energy stocks also showed strength as crude oil rose $2.24 to $89.16 per barrel as tensions in the Middle East remain heightened. Exxon Mobil Corp (XOM +1.41%) and Chevron Corp (CVX +1.90%) rose. On the earnings front, Lowe's Companies Inc (LOW +6.19%) advanced after the company topped analysts expectations in the quarter.
Turning to fixed income, Treasuries ended lower with the benchmark 10-year note down 5/16 of a point to yield 1.61%.
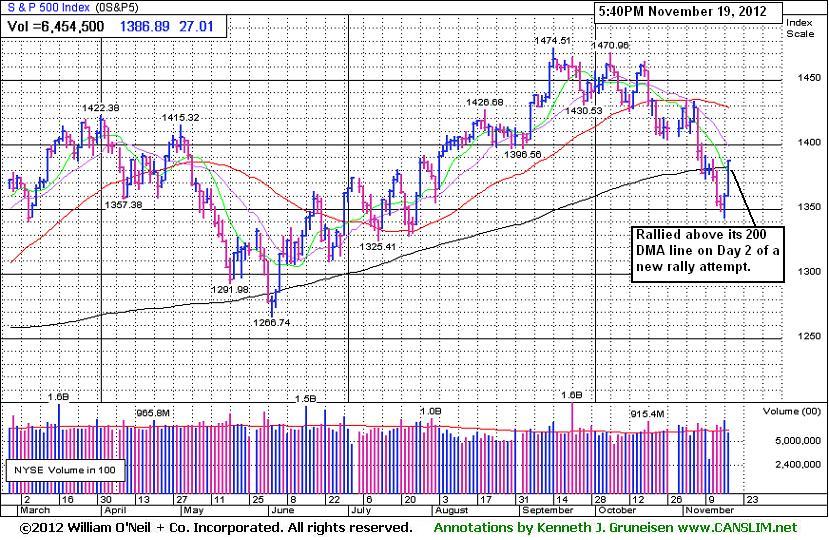
Regular readers may note that this commentary first mentioned a "market correction" on October 11th, calling for reduced market exposure repeatedly if investors were not already completely in cash. During market corrections the M criteria argues against new buying efforts and urges investors to take a defensive stance to protect precious capital. That stance can change back to a bullish stance where buying is encouraged when at least one of the three major averages produces a solid follow-through day (FTD). A FTD confirming a new rally requires substantial gains on higher (ideally above average) volume, coupled with healthy leadership and a respectable number of stocks hitting new 52-week highs. Historic studies have shown that a FTD occurring between Days 4-7 of a new rally effort has often signaled the beginning of the most substantial market rallies.
Investors should always limit losses if ever any stock falls more than -7% from their purchase price. Following strict sell rules is precisely how this fact-based investment system prompts investors to reduce exposure and protect cash during market downturns. Keep a watchlist of strong acting stocks with all-key criteria in anticipation of the next confirmed uptrend. See the noteworthy candidates included on the Featured Stocks Page.
Watch for an announcement via email concerning the next WEBCAST. The webcast will also be available via an updated link highlighted at the top of the Premium Member Homepage.
PICTURED: The S&P 500 Index's gain marked Day 2 of a new rally attempt and helped it rebound above its 200-day moving average (DMA) line. Bargain hunting is never a part of the fact-based approach supported by CANSLIM.net. Until the major averages produce a new confirmed rally with a follow-through day, disciplined investors know that it is most important to be protecting cash.
|
 Kenneth J. Gruneisen started out as a licensed stockbroker in August 1987, a couple of months prior to the historic stock market crash that took the Dow Jones Industrial Average down -22.6% in a single day. He has published daily fact-based fundamental and technical analysis on high-ranked stocks online for two decades. Through FACTBASEDINVESTING.COM, Kenneth provides educational articles, news, market commentary, and other information regarding proven investment systems that work in good times and bad.
Comments contained in the body of this report are technical opinions only and are not necessarily those of Gruneisen Growth Corp. The material herein has been obtained from sources believed to be reliable and accurate, however, its accuracy and completeness cannot be guaranteed. Our firm, employees, and customers may effect transactions, including transactions contrary to any recommendation herein, or have positions in the securities mentioned herein or options with respect thereto. Any recommendation contained in this report may not be suitable for all investors and it is not to be deemed an offer or solicitation on our part with respect to the purchase or sale of any securities. |
|
 |
Retail, Financial, Tech, and Commodity-Linked Groups Rose
Kenneth J. Gruneisen - Passed the CAN SLIM® Master's Exam
The Retail Index ($RLX +2.47%) tallied a solid gain and the financial group underpinned the major averages rise on Monday as the Broker/Dealer Index ($XBD +2.22%) and the Bank Index ($BKX +2.23%) rebounded from recent damaging losses. The tech sector was strong as the Semiconductor Index ($SOX +2.01%), Networking Index ($NWX +1.48%), Internet Index ($IIX +1.59%), and Biotechnology Index ($BTK +1.63%) posted unanimous gains. Defensive groups also rose as the Healthcare Index ($HMO +1.72%) and the Gold & Silver Index ($XAU +2.96%) surged, and gains in energy-related shares gave the Oil Services Index ($OSX +3.22%) and the Integrated Oil Index ($XOI +2.33%) a boost.
Charts courtesy www.stockcharts.com
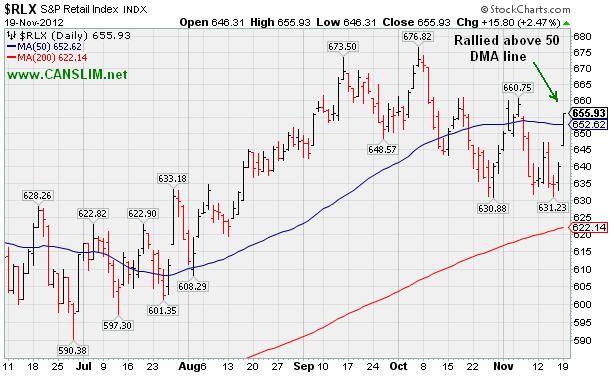
PICTURED: The Retail Index ($RLX +2.47%) rallied above its 50-day moving average (DMA) line with a solid gain on Monday, helping its technical stance improve.
| Oil Services |
$OSX |
216.79 |
+6.77 |
+3.22% |
+0.24% |
| Healthcare |
$HMO |
2,459.32 |
+41.62 |
+1.72% |
+7.79% |
| Integrated Oil |
$XOI |
1,199.45 |
+27.27 |
+2.33% |
-2.41% |
| Semiconductor |
$SOX |
363.14 |
+7.14 |
+2.01% |
-0.36% |
| Networking |
$NWX |
195.90 |
+2.87 |
+1.48% |
-8.95% |
| Internet |
$IIX |
307.53 |
+4.82 |
+1.59% |
+9.15% |
| Broker/Dealer |
$XBD |
82.88 |
+1.80 |
+2.22% |
-0.47% |
| Retail |
$RLX |
655.93 |
+15.80 |
+2.47% |
+26.81% |
| Gold & Silver |
$XAU |
170.58 |
+4.91 |
+2.96% |
-5.57% |
| Bank |
$BKX |
48.20 |
+1.05 |
+2.23% |
+22.40% |
| Biotech |
$BTK |
1,467.33 |
+23.57 |
+1.63% |
+34.44% |
|
|
|
 |
September Quarter Showed Stronger Earnings and Sales Increases
Kenneth J. Gruneisen - Passed the CAN SLIM® Master's Exam
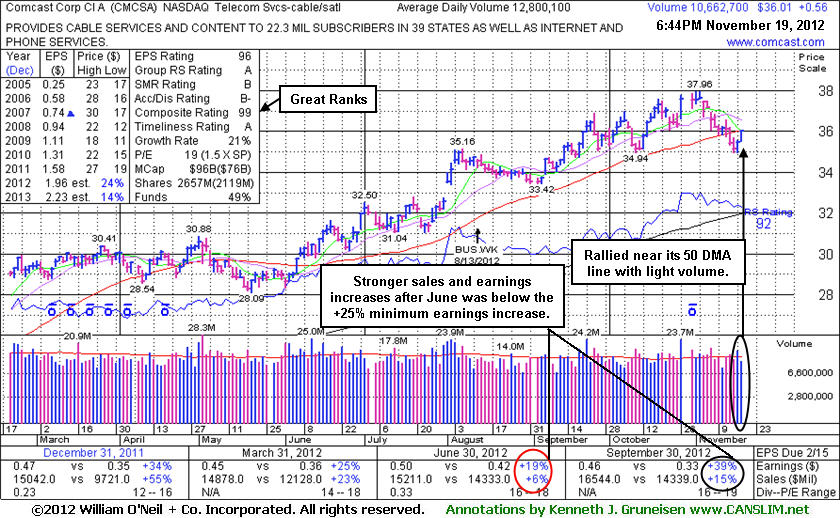
Comcast Corp Cl A (CMCSA +$0.56 or +1.58% to $36.01) posted a gain today on lighter volume, rallying near its 50-day moving average (DMA) line which may now act as a resistance level. It recently reported earnings +39% on +15% sales revenues for the Sep '12 quarter, above the fact-based investment system's +25% minimum guideline for the C criteria, a reassuring follow-up to the previously noted sub par quarter. It is consolidating only -5.1% off its 52-week high with little resistance remaining due to overhead supply up to the $38 level. It has not formed a sound base pattern. Additionally, the M criteria argues that 3 out of 4 stocks tend to go in the same direction as the major averages. Disciplined investors would have the patience to watch for a new confirmed rally and wait for an ideal new base and fresh breakout before considering any new buying efforts.
It has earned high ranks. Its annual earnings (A criteria) history has been strong and leadership from other firms in the Telecom Services - Cable/Satellite industry group is a reassuring sign concerning the L criteria. The number of top-rated funds owning its shares rose from 1,916 in Jun '11 to 2,199 in Sep '12, a reassuring sign concerning the I criteria. Its huge supply of 2.097 billion shares in the float could make it less likely to be a great sprinter, meanwhile, the S criteria calls for investors to usually look at small-cap or mid-cap companies.
|
|
|
Color Codes Explained :
Y - Better candidates highlighted by our
staff of experts.
G - Previously featured
in past reports as yellow but may no longer be buyable under the
guidelines.
***Last / Change / Volume data in this table is the closing quote data***
Symbol/Exchange
Company Name
Industry Group |
PRICE |
CHANGE
(%Change) |
Day High |
Volume
(% DAV)
(% 50 day avg vol) |
52 Wk Hi
% From Hi |
Featured
Date |
Price
Featured |
Pivot Featured |
|
Max Buy |
CFNL
-
NASDAQ
Cardinal Financial Corp
BANKING - Regional - Southeast Banks
|
$15.19
|
+0.02
0.13% |
$15.49
|
230,309
161.73% of 50 DAV
50 DAV is 142,400
|
$16.21
-6.29%
|
8/17/2012
|
$12.84
|
PP = $13.31
|
|
MB = $13.98
|
Most Recent Note - 11/16/2012 2:04:47 PM
G - Rising today with higher volume. It has been repeatedly noted while extended from its prior base - "Prior high ($14.79 on 9/24/12) defines initial support to watch above its 50 DMA line. Disciplined investors may watch out for worrisome technical sell signals while awaiting a new base or secondary buy point and more favorable market."
>>> The latest Featured Stock Update with an annotated graph appeared on 10/25/2012. Click here.
View all notes |
Alert me of new notes |
CANSLIM.net Company Profile |
SEC |
Zacks Reports |
StockTalk |
News |
Chart |
Request a new note
C
A N
S L
I M


|
CMCSA
-
NASDAQ
Comcast Corp Cl A
MEDIA - CATV Systems
|
$36.01
|
+0.56
1.58% |
$36.03
|
10,694,461
83.95% of 50 DAV
50 DAV is 12,738,600
|
$37.96
-5.14%
|
6/11/2012
|
$29.94
|
PP = $30.98
|
|
MB = $32.53
|
 Most Recent Note - 11/19/2012 7:04:19 PM
G - Gain today on light volume helped it close just 4 cents above its 50 DMA line. See the latest FSU analysis for more details and a new annotated graph.
>>> The latest Featured Stock Update with an annotated graph appeared on 11/19/2012. Click here.
View all notes |
Alert me of new notes |
CANSLIM.net Company Profile |
SEC |
Zacks Reports |
StockTalk |
News |
Chart |
Request a new note
C
A N
S L
I M
|
DVA
-
NYSE
Davita Healthcare Prtns
HEALTH SERVICES - Specialized Health Services
|
$114.00
|
+0.98
0.87% |
$114.93
|
987,987
112.73% of 50 DAV
50 DAV is 876,400
|
$116.50
-2.15%
|
9/5/2012
|
$102.92
|
PP = $100.62
|
|
MB = $105.65
|
Most Recent Note - 11/16/2012 2:03:01 PM
G - Holding its ground only -2.4% off its 52-week high today, on track for a 9th consecutive weekly gain. Fundamental concerns were raised after it reported earnings +3% on +12% sales for the Sep '12 quarter, below the guidelines of the fact-based system.
>>> The latest Featured Stock Update with an annotated graph appeared on 11/8/2012. Click here.
View all notes |
Alert me of new notes |
CANSLIM.net Company Profile |
SEC |
Zacks Reports |
StockTalk |
News |
Chart |
Request a new note
C
A N
S L
I M
|
GPX
-
NYSE
G P Strategies Corp
DIVERSIFIED SERVICES - Education and Training Services
|
$20.53
|
+0.13
0.64% |
$20.69
|
77,773
133.63% of 50 DAV
50 DAV is 58,200
|
$21.44
-4.24%
|
10/8/2012
|
$20.00
|
PP = $20.77
|
|
MB = $21.81
|
Most Recent Note - 11/16/2012 12:16:34 PM
G - Hovering near its 52-week high today. Earnings +0% on +12% sales revenues for the Sep '12 quarter, below the +25% minimum earnings guideline (C criteria) raised fundamental concerns. See the latest FSU analysis for more details and a new annotated graph.
>>> The latest Featured Stock Update with an annotated graph appeared on 11/15/2012. Click here.
View all notes |
Alert me of new notes |
CANSLIM.net Company Profile |
SEC |
Zacks Reports |
StockTalk |
News |
Chart |
Request a new note
C
A N
S L
I M
|
LKQ
-
NASDAQ
L K Q Corp
WHOLESALE - Auto Parts
|
$21.25
|
+0.39
1.87% |
$21.40
|
1,481,962
88.59% of 50 DAV
50 DAV is 1,672,800
|
$21.95
-3.19%
|
8/9/2012
|
$18.97
|
PP = $18.72
|
|
MB = $19.66
|
Most Recent Note - 11/19/2012 7:06:21 PM
G - Today's 3rd consecutive gain came on lighter volume, finishing only -3.2% off its 52-week high. Results below the +25% minimum earnings guideline (C criteria) for Sep '12 recently raised fundamental concerns.
>>> The latest Featured Stock Update with an annotated graph appeared on 11/14/2012. Click here.
View all notes |
Alert me of new notes |
CANSLIM.net Company Profile |
SEC |
Zacks Reports |
StockTalk |
News |
Chart |
Request a new note
C
A N
S L
I M
|
Symbol/Exchange
Company Name
Industry Group |
PRICE |
CHANGE
(%Change) |
Day High |
Volume
(% DAV)
(% 50 day avg vol) |
52 Wk Hi
% From Hi |
Featured
Date |
Price
Featured |
Pivot Featured |
|
Max Buy |
MIDD
-
NASDAQ
Middleby Corp
MANUFACTURING - Diversified Machinery
|
$126.98
|
+1.49
1.19% |
$128.87
|
62,837
79.54% of 50 DAV
50 DAV is 79,000
|
$128.73
-1.36%
|
10/8/2012
|
$118.46
|
PP = $122.67
|
|
MB = $128.80
|
Most Recent Note - 11/19/2012 7:07:21 PM
Y - Traded up today with below average volume, finishing at its best-ever close. Reported earnings +23% on +18% sales for the Sep '12 quarter, below the +25% minimum earnings guideline (C criteria). The M criteria remains an overriding concern until a FTD confirms a new rally.
>>> The latest Featured Stock Update with an annotated graph appeared on 11/16/2012. Click here.
View all notes |
Alert me of new notes |
CANSLIM.net Company Profile |
SEC |
Zacks Reports |
StockTalk |
News |
Chart |
Request a new note
C
A N
S L
I M
|
RAX
-
NYSE
Rackspace Hosting Inc
INTERNET - Internet Software and; Services
|
$64.55
|
+1.99
3.18% |
$64.66
|
1,257,679
73.94% of 50 DAV
50 DAV is 1,700,900
|
$69.81
-7.53%
|
11/6/2012
|
$65.44
|
PP = $69.91
|
|
MB = $73.41
|
Most Recent Note - 11/19/2012 1:38:33 PM
G - Today's 3rd consecutive gain has it rebounding toward its 50 DMA line which may act as resistance. Recent gains have lacked great volume conviction following damaging distributional losses.
>>> The latest Featured Stock Update with an annotated graph appeared on 11/6/2012. Click here.
View all notes |
Alert me of new notes |
CANSLIM.net Company Profile |
SEC |
Zacks Reports |
StockTalk |
News |
Chart |
Request a new note
C
A N
S L
I M
|
RNF
-
NYSE
Rentech Nitrogen Ptnr Lp
CHEMICALS - Agricultural Chemicals
|
$37.92
|
+2.18
6.10% |
$38.15
|
396,118
97.98% of 50 DAV
50 DAV is 404,300
|
$41.15
-7.85%
|
11/1/2012
|
$39.11
|
PP = $40.15
|
|
MB = $42.16
|
Most Recent Note - 11/19/2012 1:31:00 PM
G - Rebounding back above its 50 DMA line today with a gap up and volume-driven gain helping its technical stance improve. Negative market (M criteria) and a worrisome "negative reversal" were recently noted as concerns.
>>> The latest Featured Stock Update with an annotated graph appeared on 11/2/2012. Click here.
View all notes |
Alert me of new notes |
CANSLIM.net Company Profile |
SEC |
Zacks Reports |
StockTalk |
News |
Chart |
Request a new note
C
A N
S L
I M
|
VSI
-
NYSE
Vitamin Shoppe Inc
SPECIALTY RETAIL - Specialty Retail, Other
|
$59.83
|
+2.06
3.57% |
$60.69
|
327,749
114.04% of 50 DAV
50 DAV is 287,400
|
$61.89
-3.33%
|
10/15/2012
|
$57.82
|
PP = $60.08
|
|
MB = $63.08
|
Most Recent Note - 11/19/2012 1:34:07 PM
Y -Posting a 3rd consecutive gain today and rallying back above its 50 DMA line. Color code is changed to yellow based on its resilience. It released better than expected earnings +35% on +14% sales revenues for the Sep '12 quarter.
>>> The latest Featured Stock Update with an annotated graph appeared on 11/12/2012. Click here.
View all notes |
Alert me of new notes |
CANSLIM.net Company Profile |
SEC |
Zacks Reports |
StockTalk |
News |
Chart |
Request a new note
C
A N
S L
I M
|
WPI
-
NYSE
Watson Pharmaceuticals
DRUGS - Drugs - Generic
|
$84.99
|
+1.59
1.91% |
$84.99
|
761,982
90.73% of 50 DAV
50 DAV is 839,800
|
$90.00
-5.57%
|
8/24/2012
|
$82.90
|
PP = $81.10
|
|
MB = $85.16
|
Most Recent Note - 11/19/2012 1:35:44 PM
G - Rallying back toward its 50 DMA line today which may act as resistance following last week's violation of that important short-term average. Reported earnings +24% on +19% sales revenues for the Sep '12 quarter, a notch below the +25% minimum guideline (C criteria).
>>> The latest Featured Stock Update with an annotated graph appeared on 11/1/2012. Click here.
View all notes |
Alert me of new notes |
CANSLIM.net Company Profile |
SEC |
Zacks Reports |
StockTalk |
News |
Chart |
Request a new note
C
A N
S L
I M
|
Symbol/Exchange
Company Name
Industry Group |
PRICE |
CHANGE
(%Change) |
Day High |
Volume
(% DAV)
(% 50 day avg vol) |
52 Wk Hi
% From Hi |
Featured
Date |
Price
Featured |
Pivot Featured |
|
Max Buy |
|
|
|
THESE ARE NOT BUY RECOMMENDATIONS!
Comments contained in the body of this report are technical
opinions only. The material herein has been obtained
from sources believed to be reliable and accurate, however,
its accuracy and completeness cannot be guaranteed.
This site is not an investment advisor, hence it does
not endorse or recommend any securities or other investments.
Any recommendation contained in this report may not
be suitable for all investors and it is not to be deemed
an offer or solicitation on our part with respect to
the purchase or sale of any securities. All trademarks,
service marks and trade names appearing in this report
are the property of their respective owners, and are
likewise used for identification purposes only.
This report is a service available
only to active Paid Premium Members.
You may opt-out of receiving report notifications
at any time. Questions or comments may be submitted
by writing to Premium Membership Services 665 S.E. 10 Street, Suite 201 Deerfield Beach, FL 33441-5634 or by calling 1-800-965-8307
or 954-785-1121.
|
|
|

