You are not logged in.
This means you
CAN ONLY VIEW reports that were published prior to Monday, April 14, 2025.
You
MUST UPGRADE YOUR MEMBERSHIP if you want to see any current reports.
AFTER MARKET UPDATE - THURSDAY, NOVEMBER 19TH, 2009
Previous After Market Report Next After Market Report >>>
|
|
|
|
DOW |
-93.87 |
10,332.44 |
-0.90% |
|
Volume |
1,082,881,680 |
+2% |
|
Volume |
2,336,598,660 |
+15% |
|
NASDAQ |
-36.32 |
2,156.82 |
-1.66% |
|
Advancers |
566 |
18% |
|
Advancers |
569 |
20% |
|
S&P 500 |
-14.90 |
1,094.90 |
-1.34% |
|
Decliners |
2,483 |
79% |
|
Decliners |
2,146 |
76% |
|
Russell 2000 |
-14.47 |
585.68 |
-2.41% |
|
52 Wk Highs |
46 |
|
|
52 Wk Highs |
33 |
|
|
S&P 600 |
-7.74 |
309.38 |
-2.44% |
|
52 Wk Lows |
8 |
|
|
52 Wk Lows |
23 |
|
|
 |
Leadership Wanes Amid More Distributional Pressure
Adam Sarhan, Contributing Writer,
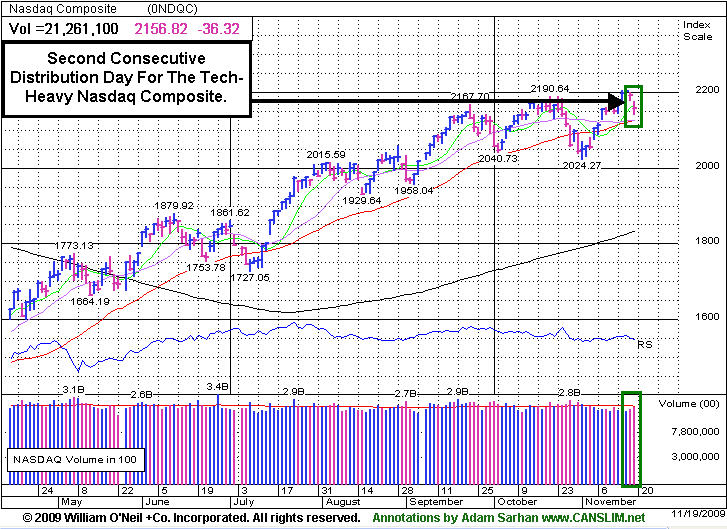
Stocks fell across the globe as the US dollar rallied and concern spread regarding the underlying health of the economic recovery. Volume, a critical component of institutional demand, was higher than Wednesday's levels across the board which marked a distribution day for the major averages. Decliners trumped advancers by about a 4-to-1 ratio on the NYSE and Nasdaq exchange. There were only 10 high-ranked companies from the CANSLIM.net Leaders List making a new 52-week high and appearing on the CANSLIM.net BreakOuts Page, lower than the 40 issues that appeared on the prior session. In terms of new leadership, it was encouraging to see new 52-week highs outnumber new 52-week lows on the NYSE and Nasdaq exchange.
Stocks experienced their largest single day decline this month after the latest round of ominous economic data was released. The tepid economic data led many to question how long the global economic recovery will last and sent investors flocking to the US dollar. Before Thursday's opening bell, the Labor Department said jobless claims (a.k.a the number of Americans filing claims for unemployment benefits) was unchanged at a 10-month low. Stocks also got hit after a report was released that showed mortgage delinquencies surged. So far, since the financial crisis began in 2007, writedowns (a.k.a losses) of mortgage-backed debt has surpassed $1.7 trillion at some of the world's largest financial firms. The spike in mortgage delinquencies was due to a 26-year high in unemployment and a down tick in wages. The Mortgage Bankers Association said that out of every six home loans insured by the Federal Housing Administration there is at least one late payment and +3.32% of those loans were in foreclosure last quarter. This was the highest reading for both measures in at least 30 years and bodes poorly for the troubled housing market.
Elsewhere, the Organization for Economic Cooperation and Development (OECD) doubled its growth forecast for industrialized nations in 2010 to +1.9%. However, the group said that record debt levels may burden future growth. Separately, the Federal Reserve Bank of Philadelphia released its general economic index which topped estimates and suggests a slight improvement in that region. Billionaire investor, Bill Gross, who runs the world’s largest bond fund- Pacific Investment Management Co. (PIMCO) in Newport Beach, California, published a report today and said that he believes record low interest rates may cause new asset bubbles for stocks and risky bonds.
Looking at the market, leading stocks came under a little pressure today but for the most part continue to hold up well. The market caught a bid (rallied) in the last hour of trade which is an encouraging sign and shows that buyers are still out there and willing to show up and defend support. Highly liquid technology stocks continue to be an important area of strength as investors continue to pile into a very narrow group of stocks. Gold and silver stocks are another important area that continues to outperform the major averages. As always, it is imperative to isolate strength and let the market guide you.
PICTURED: The Nasdaq Composite suffered a second straight distribution day on Thursday.
|
|
|
 |
Energy, Technology, and Financial Groups Lead Decliners
Kenneth J. Gruneisen - Passed the CAN SLIM® Master's Exam
The Oil Services Index ($OSX -3.49%) and Integrated Oil Index ($XOI -1.88%) fell as energy shares were dragged lower among widespread losses Thursday. The Semiconductor Index ($SOX -3.43%), Networking Index ($NWX -2.24%), Biotechnology Index ($BTK -1.68%), and Internet Index ($IIX -1.53%) ended unanimously lower, contributing to the tech-heavy Nasdaq Composite Index's and small-cap indexes' larger losses. The Healthcare Index ($HMO -1.17%) also fell and the Retail Index ($RLX -0.90%) was negative, meanwhile the Gold & Silver Index ($XAU +0.63%) was a standout with its modest gain.
Charts courtesy www.stockcharts.com
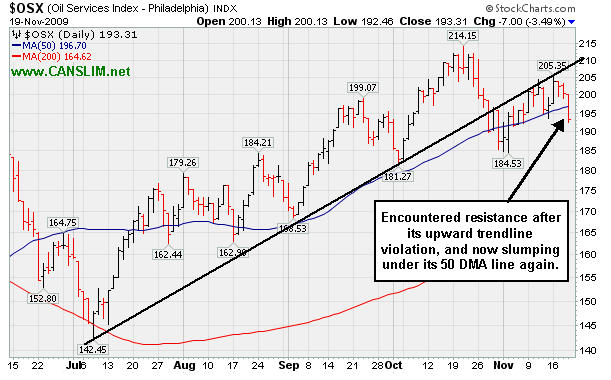
PICTURED: The Oil Services Index ($OSX -3.49%) sank under its 50-day moving average line again after recently encountering resistance at its upward trendline connecting its July lows.
| Oil Services |
$OSX |
193.31 |
-7.00 |
-3.49% |
+59.25% |
| Healthcare |
$HMO |
1,304.27 |
-15.44 |
-1.17% |
+35.84% |
| Integrated Oil |
$XOI |
1,080.75 |
-20.76 |
-1.88% |
+10.32% |
| Semiconductor |
$SOX |
310.50 |
-11.03 |
-3.43% |
+46.34% |
| Networking |
$NWX |
228.56 |
-5.24 |
-2.24% |
+58.84% |
| Internet |
$IIX |
224.91 |
-3.49 |
-1.53% |
+68.13% |
| Broker/Dealer |
$XBD |
115.98 |
-2.97 |
-2.50% |
+49.71% |
| Retail |
$RLX |
400.82 |
-3.63 |
-0.90% |
+43.53% |
| Gold & Silver |
$XAU |
185.85 |
+1.17 |
+0.63% |
+50.06% |
| Bank |
$BKX |
43.78 |
-0.89 |
-1.99% |
-1.22% |
| Biotech |
$BTK |
869.85 |
-14.89 |
-1.68% |
+34.41% |
|
|
|
 |
Healthy Consolidation Above 50 DMA Line For Software Firm
Kenneth J. Gruneisen - Passed the CAN SLIM® Master's Exam
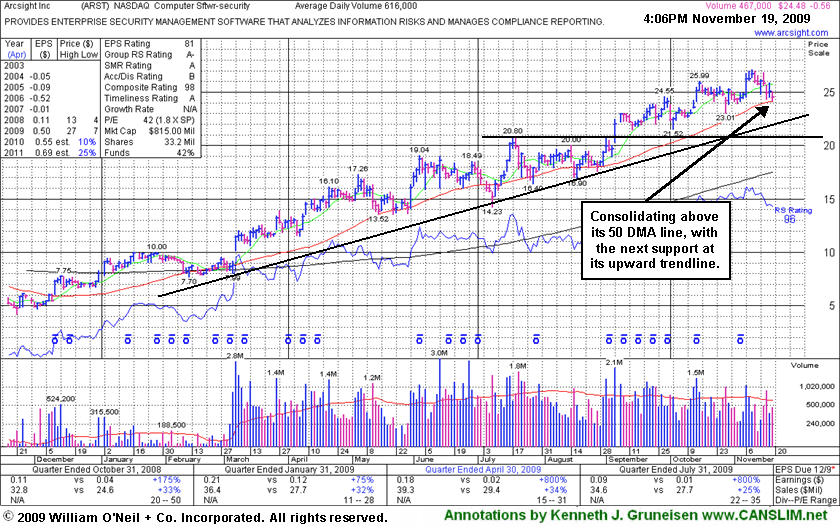
ArcSight, Inc. (ARST -$0.56 or -2.24% to $24.48) is consolidating above its 50-day moving average (DMA) line. Its color code remained green while we dismissed its 10/15/09 high ($25.99) as a new pivot point, with concern that it is now a later stage breakout without a recent base of substantial length. It has produced only one gain backed by above average volume in 5 weeks, however ARST stubbornly held its ground and it has encountered very little distributional pressure since its 9/04/09 breakout. The 50 DMA line is always an important technical support level to watch on pullbacks. In this case, the next technical support would be the upward trendline connecting its chart lows since March.
Keep in mind that ARST was considered a "late-stage" breakout possibility when featured after it had already made a considerable 5-fold rally from its November '08 low. ARST was first featured in yellow at $19.91 in the 9/01/09 mid-day report with an annotated daily graph (read here) and it was also featured with more detailed analysis in the September 2009 CANSLIM.net News with an annotated weekly graph (read here).
|
|
|
Color Codes Explained :
Y - Better candidates highlighted by our
staff of experts.
G - Previously featured
in past reports as yellow but may no longer be buyable under the
guidelines.
***Last / Change / Volume quote data in this table corresponds with the timestamp on the note***
Symbol/Exchange
Company Name
Industry Group |
Last |
Chg. |
Vol
% DAV |
Date Featured |
Price Featured |
Latest Pivot Point
Featured |
Status |
| Latest Max Buy Price |
ARST
-
|
$24.48
|
-0.56
|
471,171
76% DAV
616,000
|
9/1/2009
(Date
Featured) |
$19.91
(Price
Featured) |
PP = $20.90 |
G |
| MB = $21.95 |
Most Recent Note - 11/19/2009 4:50:28 PM
G - Small loss today on below average but volume above the prior session total. Moderate distributional action this week has it consolidating near its 50 DMA line. ARST was first featured in yellow at $19.91 in the 9/01/09 mid-day report with an annotated daily graph (read here).
>>> The latest Featured Stock Update with an annotated graph appeared on 11/19/2009. click here.
|
|
C
A
S
I |
News |
Chart |
SEC
View all notes Alert
me of new notes
Company
Profile
|
ASIA
-
|
$25.08
|
-0.78
|
435,566
43% DAV
1,011,800
|
10/14/2009
(Date
Featured) |
$23.05
(Price
Featured) |
PP = $22.19 |
G |
| MB = $23.30 |
Most Recent Note - 11/19/2009 4:57:00 PM
G - Second consecutive loss on light volume while still hovering near its 2009 highs, extended from its latest sound base. Featured 10/14/09 in the mid-day report (read here) as it gapped up for a new 52-week high with 5 times average volume, triggering a technical buy signal by blasting above its pivot point. First featured in the August 2009 CANSLIM.net News (read here).
>>> The latest Featured Stock Update with an annotated graph appeared on 11/12/2009. click here.
|
|
C
A
S
I |
News |
Chart |
SEC
View all notes Alert
me of new notes
Company
Profile
|
BIDU
- NASDAQ
Baidu Inc Ads
INTERNET - Internet Information Providers
|
$428.01
|
-7.11
|
1,416,284
62% DAV
2,269,600
|
9/8/2009
(Date
Featured) |
$351.80
(Price
Featured) |
PP = $368.59 |
G |
| MB = $387.02 |
Most Recent Note - 11/19/2009 4:58:39 PM
G - Second consecutive small loss today while quietly hovering near all-time highs. Proved resilient near its 50 DMA line after its 10/27/09 gap down. As recently noted, "Choppy action has not allowed it to form a sound base in recent weeks." BIDU traded up as much as +23% from its price when featured in yellow in the 9/08/09 Mid-Day BreakOuts Report (read here).
>>> The latest Featured Stock Update with an annotated graph appeared on 11/10/2009. click here.
|
|
C
A
S
I |
News |
Chart |
SEC
View all notes Alert
me of new notes
Company
Profile
|
CACC
- NASDAQ
Credit Acceptance Corp
FINANCIAL SERVICES - Credit Services
|
$34.90
|
-0.10
|
30,567
86% DAV
35,600
|
9/29/2009
(Date
Featured) |
$33.48
(Price
Featured) |
PP = $37.10 |
Y |
| MB = $38.96 |
Most Recent Note - 11/19/2009 5:18:43 PM
Y - Color code is changed to yellow with new pivot point and max buy levels noted while it is now trading near the middle of its range after a 5-week flat base and still continuing its consolidation in a very orderly fashion above prior chart highs and its 50 DMA line in the $32 area. The Finance - Consumer/Commercial Loans firm has maintained a great track record of annual and quarterly sales revenues and earnings increases. It was featured on 9/29/09 in yellow in the mid-day report (read here).
>>> The latest Featured Stock Update with an annotated graph appeared on 11/16/2009. click here.
|
|
C
A
S
I |
News |
Chart |
SEC
View all notes Alert
me of new notes
Company
Profile
|
CRM
- NYSE
Salesforce.com Inc
INTERNET - Internet Software & Services
|
$62.58
|
-1.03
|
1,686,625
93% DAV
1,815,800
|
8/16/2009
(Date
Featured) |
$47.12
(Price
Featured) |
PP = $45.59 |
G |
| MB = $47.87 |
Most Recent Note - 11/19/2009 5:23:04 PM
G - Third consecutive loss, pulling back after another strong quarterly report for the period ended October 31, 2009. It is not near any sound base, but after finding prompt support at its 50 DMA line it is within close range of its prior high.
>>> The latest Featured Stock Update with an annotated graph appeared on 11/9/2009. click here.
|
|
C
A
S
I |
News |
Chart |
SEC
View all notes Alert
me of new notes
Company
Profile
|
GMCR
- NASDAQ
Green Mtn Coffee Roastrs
FOOD & BEVERAGE - Processed & Packaged Goods
|
$65.13
|
-0.73
|
1,728,405
126% DAV
1,370,600
|
10/5/2009
(Date
Featured) |
$71.11
(Price
Featured) |
PP = $75.89 |
G |
| MB = $79.68 |
Most Recent Note - 11/19/2009 5:25:11 PM
G - Another loss today on slightly above average volume led to more technical deterioration under its recent lows near $65, closing at its lowest price since 9/15/09, raising more serious concerns. It has triggered a sell signal by its 50 DMA line violation. Gapped down on 11/12/09 after reporting strong quarterly results for the period ended Sept 30, 2009. As recently noted, "Its choppy action in recent weeks has not allowed for a sound new base to form."
>>> The latest Featured Stock Update with an annotated graph appeared on 11/11/2009. click here.
|
|
C
A
S
I |
News |
Chart |
SEC
View all notes Alert
me of new notes
Company
Profile
|
HEAT
-
|
$13.84
|
+0.04
|
1,508,991
251% DAV
602,200
|
11/17/2009
(Date
Featured) |
$12.00
(Price
Featured) |
PP = $12.61 |
G |
| MB = $13.24 |
Most Recent Note - 11/19/2009 5:35:37 PM
G - Closed in the upper part of its trading range after dipping under its max buy level intra-day, ending with a gain on heavy volume for a 4th consecutive session. Its color code was changed to green. It was first featured in yellow in the 11/17/09 mid-day report (read here) when technically rising from a "double bottom" base, reaching a new all-time high. On 9/18/09 it completed an additional share offering. There is limited history for this small Chinese firm in the Pollution Control - Equipment group, however its reported annual earnings (A criteria) history has been strong, and the 3 latest quarters show sales revenues and earnings increases well above the +25% guideline.
>>> The latest Featured Stock Update with an annotated graph appeared on 11/17/2009. click here.
|
|
C
A
S
I |
News |
Chart |
SEC
View all notes Alert
me of new notes
Company
Profile
|
LFT
-
|
$33.58
|
+0.97
|
693,636
148% DAV
469,400
|
11/17/2009
(Date
Featured) |
$31.77
(Price
Featured) |
PP = $33.04 |
Y |
| MB = $34.69 |
Most Recent Note - 11/19/2009 5:42:12 PM
Y - Gain with +47% above average volume today in the face of a negative overall market helped it close above its pivot point. Volume today was borderline with the +50% above average guideline for a proper breakout, yet provided a confirmation to the prior session's "breakaway gap" from a choppy 14-week base. Recent highs in the $31 area are an initial support level to watch. A proposed offering of additional shares on 11/16/09 seems well received by the market. Its fundamentals remain strong.
>>> The latest Featured Stock Update with an annotated graph appeared on 11/18/2009. click here.
|
|
C
A
S
I |
News |
Chart |
SEC
View all notes Alert
me of new notes
Company
Profile
|
|
|
|
THESE ARE NOT BUY RECOMMENDATIONS!
Comments contained in the body of this report are technical
opinions only. The material herein has been obtained
from sources believed to be reliable and accurate, however,
its accuracy and completeness cannot be guaranteed.
This site is not an investment advisor, hence it does
not endorse or recommend any securities or other investments.
Any recommendation contained in this report may not
be suitable for all investors and it is not to be deemed
an offer or solicitation on our part with respect to
the purchase or sale of any securities. All trademarks,
service marks and trade names appearing in this report
are the property of their respective owners, and are
likewise used for identification purposes only.
This report is a service available
only to active Paid Premium Members.
You may opt-out of receiving report notifications
at any time. Questions or comments may be submitted
by writing to Premium Membership Services 665 S.E. 10 Street, Suite 201 Deerfield Beach, FL 33441-5634 or by calling 1-800-965-8307
or 954-785-1121.
|
|
|


