You are not logged in.
This means you
CAN ONLY VIEW reports that were published prior to Sunday, February 25, 2024.
You
MUST UPGRADE YOUR MEMBERSHIP if you want to see any current reports.
AFTER MARKET UPDATE - WEDNESDAY, NOVEMBER 18TH, 2020
Previous After Market Report Next After Market Report >>>
|
|
|
|
DOW |
-344.93 |
29,438.42 |
-1.16% |
|
Volume |
989,752,438 |
+4% |
|
Volume |
4,683,790,500 |
+14% |
|
NASDAQ |
-98.00 |
11,801.34 |
-0.82% |
|
Advancers |
1,134 |
38% |
|
Advancers |
1,347 |
39% |
|
S&P 500 |
-41.74 |
3,567.79 |
-1.16% |
|
Decliners |
1,873 |
62% |
|
Decliners |
2,135 |
61% |
|
Russell 2000 |
-22.60 |
1,769.32 |
-1.26% |
|
52 Wk Highs |
162 |
|
|
52 Wk Highs |
222 |
|
|
S&P 600 |
-13.24 |
1,015.33 |
-1.29% |
|
52 Wk Lows |
3 |
|
|
52 Wk Lows |
9 |
|
|
 |
Major Indices Ended Lower While Churning Higher Volume
Kenneth J. Gruneisen - Passed the CAN SLIM® Master's Exam
The Dow fell 344 points, while the S&P 500 and Nasdaq Composite declined 1.2% and 0.8%, respectively. The selloff was broad, with the small-cap Russell 2000 index losing 0.9%. The reported volume totals were higher than the prior session on the NYSE and on the Nasdaq exchange. Breadth was negative as decliners led advancers by a 3-2 margin on the NYSE and on the Nasdaq exchange. There were 60 high-ranked companies from the Leaders List that hit new 52-week highs and were listed on the BreakOuts Page, versus the total of 52 on the prior session. New 52-week highs totals expanded and easily outnumbered new 52-week lows totals which were in the single digits on both exchanges. The major indices confirmed a new uptrend (M criteria) with recent follow-through gains backed by higher volume and more leadership. Investors are reminded to always make buying and selling decisions based based on the strict criteria and rules of the fact-based investment system. 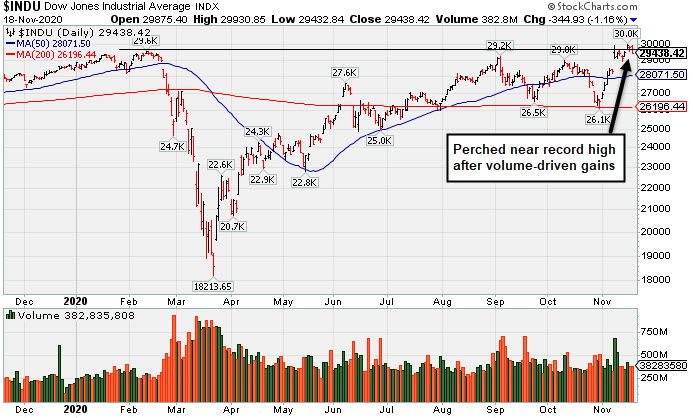 PICTURED: The Dow Jones Industrial Average is perched near its record high following volume-driven gains.
U.S. stocks reversed early session gains to end lower on Wednesday, as investors weighed the outlook of the COVID-19 pandemic. Risk sentiment slipped after New York City became the latest area to reinstate virus-inspired restrictions. City officials announced its public school system would close starting tomorrow “out of an abundance of caution” after the city reached a 3% virus positivity rate. The update came as the country faces a continued upswing in COVID infections, with the seven day average of U.S. cases surpassing 150,000 for the first time on Monday. Still, vaccine optimism eased some concerns. Earlier today, Pfizer (PFE +0.78%) and BioNTech (BNTX +4.04%) released revised late-stage trial data which showed that their vaccine candidate was 95% effective in preventing COVID 19, better than the initially reported 90% efficacy.
All 11 S&P 500 sectors ended in negative territory, with six groups losing more than 1%. In corporate news, Boeing (BA -3.21%) reversed and closed lower following news the Federal Aviation Administration cleared the aerospace giant’s 737 Max jet for service. Target (TGT +2.34%) rose after beating analyst profit and revenue projections and posting a 20% increase in same-store-sales. Lowe’s (LOW -8.21%) fell as the home-improvement retailer missed consensus earnings estimates. - Treasuries were little changed, with the yield on the benchmark 10-year note flat at 0.87%. In commodities, WTI crude edged up 0.7% to $41.71/barrel after an official government report showed a smaller-than-anticipated uptick in U.S. crude stockpiles. |
 Kenneth J. Gruneisen started out as a licensed stockbroker in August 1987, a couple of months prior to the historic stock market crash that took the Dow Jones Industrial Average down -22.6% in a single day. He has published daily fact-based fundamental and technical analysis on high-ranked stocks online for two decades. Through FACTBASEDINVESTING.COM, Kenneth provides educational articles, news, market commentary, and other information regarding proven investment systems that work in good times and bad.
Comments contained in the body of this report are technical opinions only and are not necessarily those of Gruneisen Growth Corp. The material herein has been obtained from sources believed to be reliable and accurate, however, its accuracy and completeness cannot be guaranteed. Our firm, employees, and customers may effect transactions, including transactions contrary to any recommendation herein, or have positions in the securities mentioned herein or options with respect thereto. Any recommendation contained in this report may not be suitable for all investors and it is not to be deemed an offer or solicitation on our part with respect to the purchase or sale of any securities. |
|
 |
Commodity-Linked Groups Led Financial, Retail and Tech Lower
Kenneth J. Gruneisen - Passed the CAN SLIM® Master's Exam
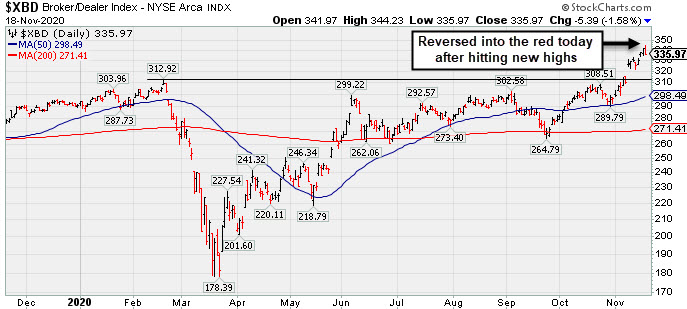
The Retail Index ($RLX -1.08%) lost ground and financial shares also had a negative influence on the major averages as the Broker/Dealer Index ($XBD -1.58%) and Bank Index ($BKX -1.15%) both fell. The Biotech Index ($BTK -2.32%) led the tech sector's retreat while the Semiconductor Index ($SOX -0.73%) and Networking Index ($NWX -0.68%) bothn edged lower. Commodity-linked grous had a negatve bias as the Gold & Silver Index ($XAU -3.21%) and Integrated Oil Index ($XOI -2.44%) outpaced the Oil Services Index ($OSX -0.93%) to the downside.
PICTURED: The Broker/Dealer Index ($XBD -1.58%) reversed into the red today after hitting new highs.
| Oil Services |
$OSX |
36.92 |
-0.35 |
-0.93% |
-52.84% |
| Integrated Oil |
$XOI |
724.78 |
-18.15 |
-2.44% |
-42.96% |
| Semiconductor |
$SOX |
2,530.30 |
-18.66 |
-0.73% |
+36.80% |
| Networking |
$NWX |
623.30 |
-4.28 |
-0.68% |
+6.84% |
| Broker/Dealer |
$XBD |
335.97 |
-5.39 |
-1.58% |
+15.70% |
| Retail |
$RLX |
3,405.64 |
-37.06 |
-1.08% |
+39.05% |
| Gold & Silver |
$XAU |
136.70 |
-4.54 |
-3.21% |
+27.85% |
| Bank |
$BKX |
89.04 |
-1.04 |
-1.15% |
-21.45% |
| Biotech |
$BTK |
5,401.68 |
-128.35 |
-2.32% |
+6.60% |
|
|
|
 |
Featured Stocks
Kenneth J. Gruneisen - Passed the CAN SLIM® Master's Exam
|
|
|
Color Codes Explained :
Y - Better candidates highlighted by our
staff of experts.
G - Previously featured
in past reports as yellow but may no longer be buyable under the
guidelines.
***Last / Change / Volume data in this table is the closing quote data***
Symbol/Exchange
Company Name
Industry Group |
PRICE |
CHANGE
(%Change) |
Day High |
Volume
(% DAV)
(% 50 day avg vol) |
52 Wk Hi
% From Hi |
Featured
Date |
Price
Featured |
Pivot Featured |
|
Max Buy |
 CRL
-
NYSE
CRL
-
NYSE
Charles River Labs Intl
DRUGS - Biotechnology
|
$234.11
|
-1.87
-0.79% |
$237.29
|
208,320
59.86% of 50 DAV
50 DAV is 348,000
|
$257.88
-9.22%
|
7/15/2020
|
$192.66
|
PP = $189.95
|
|
MB = $199.45
|
 Most Recent Note - 11/18/2020 5:38:35 PM
G - After a "negative reversal" at its all-time high on 11/09/20 support is defined by an upward trendline and its 50 DMA line ($231). More damaging losses would raise greater concerns and may trigger a worrisome technical sell signal. Reported Sep '20 quarterly earnings +38% on +11% sales revenues versus the year ago period, above the +25% minimum earnings guideline (C criteria).
>>> FEATURED STOCK ARTICLE : Earnings Due; Consolidating Near Prior High and Above 50 DMA Line - 10/27/2020 |
View all notes |
Set NEW NOTE alert |
Company Profile |
SEC
News |
Chart |
Request a new note
C
A
S
I |
AMD
-
NASDAQ
Advanced Micro Devices
ELECTRONICS - Semiconductor - Broad Line
|
$82.54
|
-0.82
-0.98% |
$83.96
|
29,762,326
57.70% of 50 DAV
50 DAV is 51,577,000
|
$94.28
-12.45%
|
11/18/2020
|
$82.54
|
PP = $88.72
|
|
MB = $93.16
|
Most Recent Note - 11/18/2020 5:35:54 PM
Y - Color code is changed to yellow with new pivot point cited based on its 10/08/20 high while still building on a "double bottom" base. Volume totals are cooling while consolidating above its 50 DMA line ($80.66). Prior lows in the $73 area define important near term support. Subsequent gains above the pivot point backed by at least +40% above average volume are needed to trigger trigger a technical buy signal.
>>> FEATURED STOCK ARTICLE : Weak Action Raised Concern While Testing Recent Low - 11/3/2020 |
View all notes |
Set NEW NOTE alert |
Company Profile |
SEC
News |
Chart |
Request a new note
C
A
S
I |
TER
-
NASDAQ
Teradyne Inc
ELECTRONICS - Semiconductor Equipment and Mate
|
$104.82
|
-1.09
-1.03% |
$106.44
|
1,185,817
52.35% of 50 DAV
50 DAV is 2,265,000
|
$107.24
-2.26%
|
10/21/2020
|
$92.22
|
PP = $93.54
|
|
MB = $98.22
|
Most Recent Note - 11/16/2020 5:45:03 PM
G - Posted a big gain today with below average (but higher) volume for a new all-time high. Reported earnings +53% on +41% sales revenues for the Sep '20 quarter versus the year ago period, its 4th consecutive quarterly comparison with earnings above the +25% minimum earnings guideline (C criteria). Sequential comparisons show encouraging acceleration in its sales revenues growth rate. Its annual earnings (A criteria) history has been strong.
>>> FEATURED STOCK ARTICLE : Recent Gains for New Highs Lacked Great Volume Conviction - 11/11/2020 |
View all notes |
Set NEW NOTE alert |
Company Profile |
SEC
News |
Chart |
Request a new note
C
A
S
I |
TREX
-
NYSE
Trex Company Inc
MATERIALS and CONSTRUCTION - General Building Materials
|
$72.67
|
-0.18
-0.25% |
$73.55
|
721,173
87.52% of 50 DAV
50 DAV is 824,000
|
$81.23
-10.54%
|
6/26/2020
|
$54.53
|
PP = $66.47
|
|
MB = $69.79
|
Most Recent Note - 11/13/2020 5:48:04 PM
G - Rebounded near its 50 DMA line ($72.51) with today's gain. Found support when testing the prior low ($63.32 on 9/21/20). Recently noted that it reported Sep '20 quarterly earnings +14% on +19% sales revenues versus the year ago period, below the +25% minimum guideline (C criteria) raising fundamental concerns.
>>> FEATURED STOCK ARTICLE : Rebound Above 50-Day Moving Average Helped Technical Stance - 11/4/2020 |
View all notes |
Set NEW NOTE alert |
Company Profile |
SEC
News |
Chart |
Request a new note
C
A
S
I |
CLFD
-
NASDAQ
Clearfield Inc
TELECOMMUNICATIONS - Cables / Satalite Equipment
|
$23.03
|
+0.57
2.54% |
$23.80
|
95,776
96.74% of 50 DAV
50 DAV is 99,000
|
$25.97
-11.32%
|
11/17/2020
|
$22.06
|
PP = $26.07
|
|
MB = $27.37
|
Most Recent Note - 11/17/2020 6:23:33 PM
Y - Suffered a volume-driven loss today testing support at its 50 DMA line ($21.74). More damaging losses would raise concerns. It was highlighted in yellow with pivot point cited based on its 11/09/20 high plus 10 cents in the earlier mid-day report. It has formed an advanced "ascending base" marked by 3 pullbacks of 10-20% after a big breakaway gap on 7/24/20. Subsequent gains above the pivot point marked by +40% above average volume are needed to trigger a proper technical buy signal. Reported earnings +57% on +14% sales revenues for the Sep '20 quarter versus the year ago period, its 3rd consecutive quarterly earnings comparison above the +25% minimum guideline (C criteria). Annual earnings (A criteria) history has improved after a downturn in FY '17. See the latest FSU analysis for more details and a new annotated graph.
>>> FEATURED STOCK ARTICLE : Formed Ascending Base Following Earlier Breakway Gap - 11/17/2020 |
View all notes |
Set NEW NOTE alert |
Company Profile |
SEC
News |
Chart |
Request a new note
C
A
S
I |
Symbol/Exchange
Company Name
Industry Group |
PRICE |
CHANGE
(%Change) |
Day High |
Volume
(% DAV)
(% 50 day avg vol) |
52 Wk Hi
% From Hi |
Featured
Date |
Price
Featured |
Pivot Featured |
|
Max Buy |
LGIH
-
NASDAQ
L G I Homes Inc
Bldg-Resident/Comml
|
$110.45
|
+1.50
1.38% |
$112.75
|
176,288
66.22% of 50 DAV
50 DAV is 266,200
|
$132.98
-16.94%
|
10/1/2020
|
$123.17
|
PP = $124.04
|
|
MB = $130.24
|
Most Recent Note - 11/16/2020 5:43:31 PM
G - Encountered more distributional pressure today while sputtering below its 50 DMA line ($116) which may act as resistance after a damaging volume-driven loss on the prior session. A rebound above the 50 DMA line is needed for its outlook to improve. Reported Sep '20 quarterly earnings +27% on +11% sales revenues versus the year ago period.
>>> FEATURED STOCK ARTICLE : Rebound Toward 50-Day Average Which May Act as Resistance - 11/10/2020 |
View all notes |
Set NEW NOTE alert |
Company Profile |
SEC
News |
Chart |
Request a new note
C
A
S
I |
NOW
-
NYSE
Servicenow Inc
Computer Sftwr-Enterprse
|
$507.12
|
-5.98
-1.17% |
$513.56
|
1,015,877
77.49% of 50 DAV
50 DAV is 1,311,000
|
$537.53
-5.66%
|
8/20/2020
|
$453.34
|
PP = $454.79
|
|
MB = $477.53
|
Most Recent Note - 11/17/2020 6:25:03 PM
G - Consolidating above its 50 DMA line ($492) while still hovering near its all-time high. Tested the prior low ($472 on 11/03/20) noted as important support where a damaging violation raises greater concerns. Recently reported Sep '20 quarterly earnings +22% on +30% sales revenues versus the year ago period, below the +25% minimum guideline (C criteria) of the fact-based investment system.
>>> FEATURED STOCK ARTICLE : Found Prompt Support at 50 DMA Line After Earnings News - 10/29/2020 |
View all notes |
Set NEW NOTE alert |
Company Profile |
SEC
News |
Chart |
Request a new note
C
A
S
I |
VEEV
-
NYSE
Veeva Systems Inc Cl A
Computer Sftwr-Medical
|
$265.18
|
-0.33
-0.12% |
$267.87
|
1,512,956
190.07% of 50 DAV
50 DAV is 796,000
|
$313.99
-15.55%
|
10/6/2020
|
$287.71
|
PP = $298.86
|
|
MB = $313.80
|
Most Recent Note - 11/16/2020 5:39:53 PM
G - Slumped again today with higher volume indicative of more damaging distributional pressure after volume-driven losses violating its 50 DMA line ($281.74) and undercutting the prior low ($263). Only a prompt rebound above the 50 DMA line would help its outlook improve. See the latest FSU analysis for more details and a new annotated graph.
>>> FEATURED STOCK ARTICLE : Weak Technical Action Raised Recent Concerns - 11/16/2020 |
View all notes |
Set NEW NOTE alert |
Company Profile |
SEC
News |
Chart |
Request a new note
C
A
S
I |
ALRM
-
NASDAQ
Alarm.com Holdings Inc
Security/Sfty
|
$69.93
|
-0.16
-0.23% |
$71.50
|
592,202
169.69% of 50 DAV
50 DAV is 349,000
|
$79.38
-11.90%
|
11/6/2020
|
$71.88
|
PP = $74.76
|
|
MB = $78.50
|
Most Recent Note - 11/18/2020 12:11:32 PM
Y - It stalled after reaching a new all-time high. Previously noted - "Subsequent gains above the pivot point may help clinch a convincing technical buy signal. Reported earnings +32% on +24% sales revenues for the Sep '20 quarter versus the year ago period, an improvement after +3% earnings in the Jun quarter. Prior quarterly comparisons were near or above the +25% minimum earnings guideline (C criteria). Annual earnings (A criteria) growth has been strong, a good match with the fact-based investment system."
>>> FEATURED STOCK ARTICLE : Encountered Distributional Pressure as it Hit a New High - 11/9/2020 |
View all notes |
Set NEW NOTE alert |
Company Profile |
SEC
News |
Chart |
Request a new note
C
A
S
I |
TEAM
-
NASDAQ
Atlassian Corp Plc Cl A
Comp Sftwr-Spec Enterprs
|
$193.70
|
-2.82
-1.43% |
$203.00
|
3,090,929
180.23% of 50 DAV
50 DAV is 1,715,000
|
$216.30
-10.45%
|
10/12/2020
|
$193.77
|
PP = $199.60
|
|
MB = $209.58
|
Most Recent Note - 11/18/2020 12:45:58 PM
G - Consolidating above its 50 DMA line ($189.79), it recently found prompt support after undercutting the prior low ($180). Reported earnings +7% on +26% sales revenues for the Sep '20 quarter versus the year ago period, well below the +25% minimum earnings guideline (C criteria), raising concerns.
>>> FEATURED STOCK ARTICLE : Weak Technical Action Followed Disappointing Fundamental News - 11/2/2020 |
View all notes |
Set NEW NOTE alert |
Company Profile |
SEC
News |
Chart |
Request a new note
C
A
S
I |
Symbol/Exchange
Company Name
Industry Group |
PRICE |
CHANGE
(%Change) |
Day High |
Volume
(% DAV)
(% 50 day avg vol) |
52 Wk Hi
% From Hi |
Featured
Date |
Price
Featured |
Pivot Featured |
|
Max Buy |
YETI
-
NYSE
Yeti Holdings Inc
Leisure-Products
|
$57.48
|
-0.39
-0.67% |
$58.82
|
1,954,420
153.77% of 50 DAV
50 DAV is 1,271,000
|
$62.72
-8.35%
|
11/5/2020
|
$57.25
|
PP = $55.14
|
|
MB = $57.90
|
Most Recent Note - 11/13/2020 5:51:08 PM
Y - Rebounded impressively after an abrupt pulllback. Its 50 DMA line ($50.02) defines near-term support above prior lows
>>> FEATURED STOCK ARTICLE : Finished Strong After Breakout Gain Was Noted in Mid-Day Report - 11/5/2020 |
View all notes |
Set NEW NOTE alert |
Company Profile |
SEC
News |
Chart |
Request a new note
C
A
S
I |
AAXN
-
NASDAQ
Axon Enterprise Inc
Security/Sfty
|
$119.83
|
+0.78
0.66% |
$121.85
|
358,062
59.28% of 50 DAV
50 DAV is 604,000
|
$128.39
-6.67%
|
11/6/2020
|
$122.75
|
PP = $113.00
|
|
MB = $118.65
|
Most Recent Note - 11/16/2020 5:41:17 PM
G - Volume totals have been cooling while stubbornly holding its ground near its all-time high. Bullish action came after reporting Sep '20 quarterly earnings +43% on +27% sales revenues versus the year ago period. It broke out of a cup-with-high-handle base with volume drying up during the handle.
>>> FEATURED STOCK ARTICLE : Breakaway Gap From Cup-With-High-Handle Pattern - 11/6/2020 |
View all notes |
Set NEW NOTE alert |
Company Profile |
SEC
News |
Chart |
Request a new note
C
A
S
I |
QTWO
-
NYSE
Q2 Holdings Inc
Computer Sftwr-Financial
|
$109.22
|
+2.30
2.15% |
$109.91
|
546,045
138.24% of 50 DAV
50 DAV is 395,000
|
$109.27
-0.05%
|
11/12/2020
|
$105.14
|
PP = $106.54
|
|
MB = $111.87
|
Most Recent Note - 11/13/2020 12:29:43 PM
Y - Pulling back today yet still hovering near its high. Encountered distributional pressure on the prior sessoion as it churned heavy volme and ended lower after highlighted in yellow with new pivot point cited based on its 8/06/20 high plus 10 cents. Subsequent confirming gains above the pivot point backed by at least +40% above average volume may help clinch a convincing technical buy signal. Showed great earning increases with strong underlying sales revenues growth for the Jun and Sep '20 quarters versus the year ago periods. Annual earnings growth has been strong. Completed new Public Offerings on 6/06/19 and 5/13/20. See the latest FSU analysis for more details and an annotated graph.
>>> FEATURED STOCK ARTICLE : Churning Action Near Prior High Indicative of Distributional Pressure - 11/12/2020 |
View all notes |
Set NEW NOTE alert |
Company Profile |
SEC
News |
Chart |
Request a new note
C
A
S
I |
|
|
|
THESE ARE NOT BUY RECOMMENDATIONS!
Comments contained in the body of this report are technical
opinions only. The material herein has been obtained
from sources believed to be reliable and accurate, however,
its accuracy and completeness cannot be guaranteed.
This site is not an investment advisor, hence it does
not endorse or recommend any securities or other investments.
Any recommendation contained in this report may not
be suitable for all investors and it is not to be deemed
an offer or solicitation on our part with respect to
the purchase or sale of any securities. All trademarks,
service marks and trade names appearing in this report
are the property of their respective owners, and are
likewise used for identification purposes only.
This report is a service available
only to active Paid Premium Members.
You may opt-out of receiving report notifications
at any time. Questions or comments may be submitted
by writing to Premium Membership Services 665 S.E. 10 Street, Suite 201 Deerfield Beach, FL 33441-5634 or by calling 1-800-965-8307
or 954-785-1121.
|
|
|