You are not logged in.
This means you
CAN ONLY VIEW reports that were published prior to Monday, April 14, 2025.
You
MUST UPGRADE YOUR MEMBERSHIP if you want to see any current reports.
AFTER MARKET UPDATE - WEDNESDAY, NOVEMBER 18TH, 2009
Previous After Market Report Next After Market Report >>>
|
|
|
|
DOW |
-11.11 |
10,426.31 |
-0.11% |
|
Volume |
1,063,354,250 |
+9% |
|
Volume |
2,033,181,590 |
+6% |
|
NASDAQ |
-10.64 |
2,193.14 |
-0.48% |
|
Advancers |
1,380 |
44% |
|
Advancers |
1,062 |
37% |
|
S&P 500 |
-0.52 |
1,109.80 |
-0.05% |
|
Decliners |
1,640 |
52% |
|
Decliners |
1,648 |
58% |
|
Russell 2000 |
-2.19 |
600.15 |
-0.36% |
|
52 Wk Highs |
178 |
|
|
52 Wk Highs |
80 |
|
|
S&P 600 |
-1.19 |
317.12 |
-0.37% |
|
52 Wk Lows |
2 |
|
|
52 Wk Lows |
14 |
|
|
 |
Mild Distribution As Nasdaq's Loss Comes On Higher Volume
Adam Sarhan, Contributing Writer,
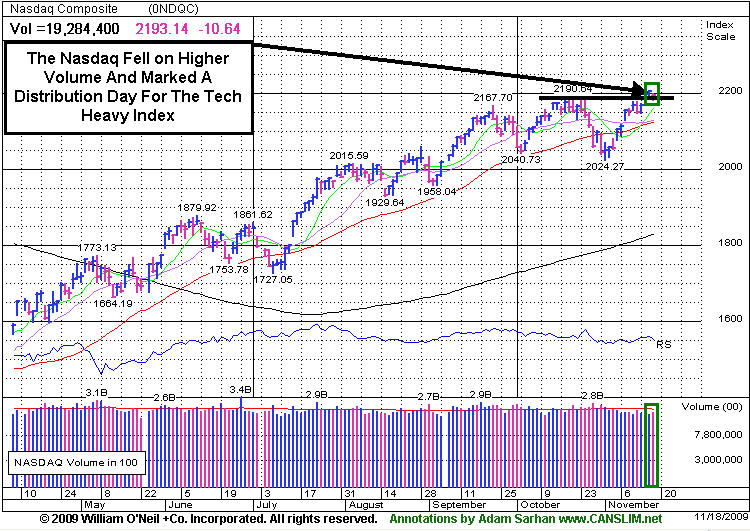
The major averages closed lower after a series of mixed economic data was released. Volume, a critical component of institutional demand, was heavier than Tuesday's levels across the board which marked a distribution day for the Nasdaq Composite Index, but percentage-wise the losses were too small on NYSE indices to constitute a distribution day. Decliners led advancers by an 8-to-7 ratio on the NYSE and by a 3-to-2 ratio on the Nasdaq exchange. There were 40 high-ranked companies from the CANSLIM.net Leaders List making a new 52-week high and appearing on the CANSLIM.net BreakOuts Page, the same number of issues that appeared on the prior session. In terms of new leadership, it was encouraging to see new 52-week highs outnumber new 52-week lows on the NYSE and Nasdaq exchange.
The big economic news of the day was released before the market opened, at 8:30AM EST. In Washington D.C., the Labor Department released a stronger-than-expected consumer price index (CPI) which ignited inflationary concerns. Headline CPI rose +0.3% which was higher than the Street's forecast for a +0.2% gain. Core CPI, which excludes food and energy, was unchanged from last month's reading of a +0.2% gain. However, core prices also topped the Street's estimate for a +0.1% gain and is the component of the report that the Federal Reserve tends to focus on. The uptick in consumer prices sparked concern that companies will have little room to raise prices this holiday season (which curbs earnings) due to the fact that unemployment is at a 26-year high of +10.2% and wages fell -5.2% in September from the same period last year. The Commerce Department released a separate report which showed that housing starts unexpectedly tanked last month. Housing starts (a.k.a registrations for new construction for residential housing units), slid -10.6% in October which was well below estimates. Permits for new construction slid -28.9% from the same period last year which led many to question the sustainability of the housing recovery.
Those of you who have read this commentary over the past 5 years know that we like to analyze the news, yet we pay a lot more attention on how the market reacts to the news. That said, the market has reacted and continues to react rather well to the latest round of economic and earnings data. The vast majority of third quarter earnings are now behind us and the major averages remain perched just under fresh 2009 highs! Barring some unforeseen event, earnings were down for the average company in the S&P 500 for the ninth straight quarter but managed to exceed the average estimate, which is one reason why the markets have reacted so well to earnings. That coupled with the notion that the "worst is behind us" explains the market's collective "take" on Q3 earnings. In addition, economic data, although not impressive, has improved markedly from this time last year which suggests the global government stimulus packages are working. The benchmark S&P 500 has surged a whopping +64% from its 12-year low in March as global GDP has rebounded. The eight-month rally has pushed the index’s p/e ratio (i.e. valuation) to 22.3 which is the highest reading since 2002 according to Bloomberg.com. The two primary concerns regarding this rally is the dearth of high quality leadership triggering technical buy signals and that volume has waned in recent weeks.
PICTURED: The Nasdaq Composite Index fell on higher volume and marked a distribution day for the tech-heavy index.
|
|
|
 |
Mild Gains In Financial Group Offset By Broader Losses
Kenneth J. Gruneisen - Passed the CAN SLIM® Master's Exam
Slightly positive action from the Bank Index ($BKX +1.36%) and Broker/Dealer Index ($XBD +0.60%) was not enough to offset mild losses elsewhere. The Retail Index ($RLX +0.05%) was flat while the tech sector traded with a modestly negative bias, sending the Networking Index ($NWX -1.42%), Biotechnology Index ($BTK -1.34%), Semiconductor Index ($SOX -0.85%), and Internet Index ($IIX -0.35%) lower. Defensive areas were also on the decline as the Oil Services Index ($OSX -1.07%), Gold & Silver Index ($XAU -1.45%), Healthcare Index ($HMO -0.93%), and Integrated Oil Index ($XOI -0.17%) created an additional drag on the major averages.
Charts courtesy www.stockcharts.com
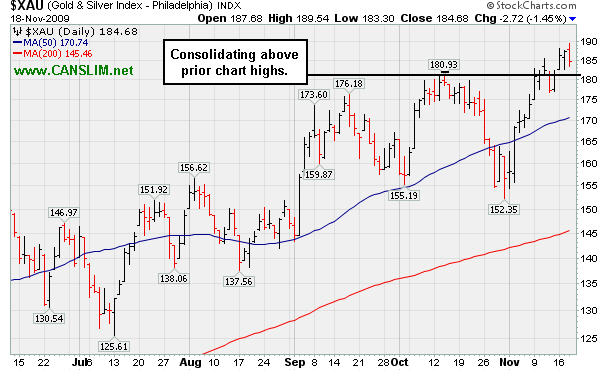
PICTURED: The Gold & Silver Index ($XAU -1.45%) is consolidating above prior chart highs.
| Oil Services |
$OSX |
200.31 |
-2.16 |
-1.07% |
+65.01% |
| Healthcare |
$HMO |
1,319.71 |
-12.43 |
-0.93% |
+37.44% |
| Integrated Oil |
$XOI |
1,101.51 |
-1.86 |
-0.17% |
+12.44% |
| Semiconductor |
$SOX |
321.53 |
-2.77 |
-0.85% |
+51.54% |
| Networking |
$NWX |
233.80 |
-3.37 |
-1.42% |
+62.49% |
| Internet |
$IIX |
228.40 |
-0.81 |
-0.35% |
+70.74% |
| Broker/Dealer |
$XBD |
118.95 |
+0.71 |
+0.60% |
+53.54% |
| Retail |
$RLX |
404.45 |
+0.22 |
+0.05% |
+44.83% |
| Gold & Silver |
$XAU |
184.68 |
-2.72 |
-1.45% |
+49.12% |
| Bank |
$BKX |
44.67 |
+0.60 |
+1.36% |
+0.79% |
| Biotech |
$BTK |
884.74 |
-12.05 |
-1.34% |
+36.71% |
|
|
|
 |
Longtop Pops To New All Time High But Closes Weak
Kenneth J. Gruneisen - Passed the CAN SLIM® Master's Exam
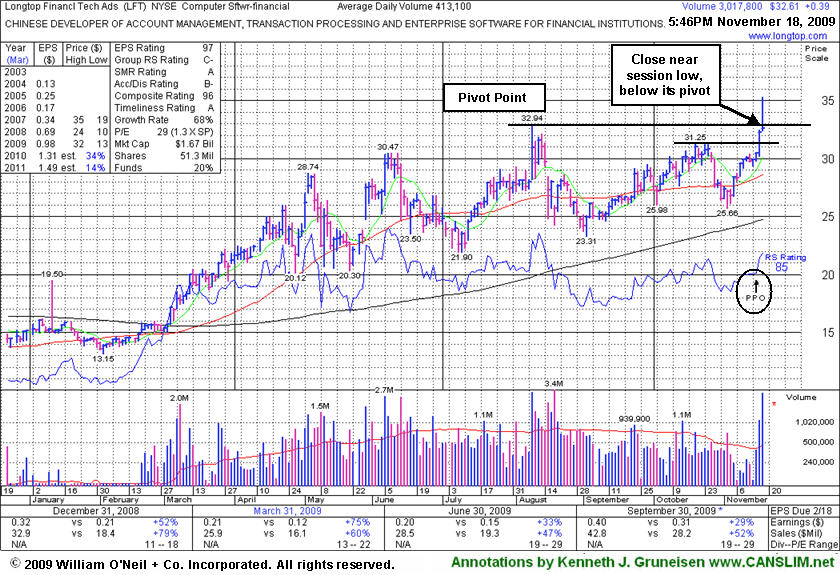
Longtop Financl Tech Ads (LFT +$0.39 or +1.21% to $32.61) opened with a breakaway gap up today that helped it blast from a choppy 14-week base, confirming a powerful technical breakout with heavy volume. However, its close near the session low raised some concerns because it technically put it back below its pivot point after it had briefly traded above its "max buy" price and above Oct 2007 all-time high. Recent highs in the $31 area are an initial support level to watch.
The newspaper described it differently, mentioning a "deep handle" with light volume. However, the correction from its $31.25 high to its $25.65 low was more than just a deep handle. It retraced more than 50% of its prior rally from its $23.31 low, making it not a proper cup-with-handle. That is why it was described as a choppy base instead. From the book "How To Make Money In Stocks" we have studied many examples that rose many-fold in price. The book emphasizes that there is no need to get in "early", because any stock that goes to $60 must first clear $32, $33,and $34. Point being, we prefer to be careful about following the rules.
A proposed offering of additional shares on 11/16/09 seems well received by the market. Its fundamentals remain strong. The number of top-rated funds owning an interest in its shares rose from 20 funds in Dec '08 to 42 funds in Jun '09, which is reassuring concerning the L criteria. It has reported strong annual and quarterly earnings increases (good concerning the C & A criteria) backed by strong sales revenues increases. Return on Equity of +20% is above the +17% guideline. Its progress could be hindered by future share offerings. This Chinese Computer Software firm had filed a registration of approximately 16 million shares for resale which was noted in previous analysis. LFT was first featured at $22.19 on Thursday, April 02, 2009 in the CANSLIM.net Mid Day Breakouts Report (read here).
|
|
|
Color Codes Explained :
Y - Better candidates highlighted by our
staff of experts.
G - Previously featured
in past reports as yellow but may no longer be buyable under the
guidelines.
***Last / Change / Volume quote data in this table corresponds with the timestamp on the note***
Symbol/Exchange
Company Name
Industry Group |
Last |
Chg. |
Vol
% DAV |
Date Featured |
Price Featured |
Latest Pivot Point
Featured |
Status |
| Latest Max Buy Price |
ARST
-
|
$25.04
|
+0.12
|
374,562
60% DAV
623,200
|
9/1/2009
(Date
Featured) |
$19.91
(Price
Featured) |
PP = $20.90 |
G |
| MB = $21.95 |
Most Recent Note - 11/18/2009 4:53:24 PM
G - Small gain today on light volume after distributional action this week which has it consolidating near its 50 DMA line. ARST was first featured in yellow at $19.91 in the 9/01/09 mid-day report with an annotated daily graph (read here).
>>> The latest Featured Stock Update with an annotated graph appeared on 11/6/2009. click here.
|
|
C
A
S
I |
News |
Chart |
SEC
View all notes Alert
me of new notes
Company
Profile
|
ASIA
-
|
$25.86
|
-0.07
|
478,010
47% DAV
1,008,500
|
10/14/2009
(Date
Featured) |
$23.05
(Price
Featured) |
PP = $22.19 |
G |
| MB = $23.30 |
Most Recent Note - 11/18/2009 4:55:06 PM
G - Quietly holding its ground, perched at 2009 highs, extended from its latest sound base. Featured 10/14/09 in the mid-day report (read here) as it gapped up for a new 52-week high with 5 times average volume, triggering a technical buy signal by blasting above its pivot point. First featured in the August 2009 CANSLIM.net News (read here).
>>> The latest Featured Stock Update with an annotated graph appeared on 11/12/2009. click here.
|
|
C
A
S
I |
News |
Chart |
SEC
View all notes Alert
me of new notes
Company
Profile
|
BIDU
- NASDAQ
Baidu Inc Ads
INTERNET - Internet Information Providers
|
$435.12
|
-6.38
|
1,704,483
75% DAV
2,275,700
|
9/8/2009
(Date
Featured) |
$351.80
(Price
Featured) |
PP = $368.59 |
G |
| MB = $387.02 |
Most Recent Note - 11/18/2009 5:01:56 PM
G - Quietly hovering near all-time highs. Proved resilient near its 50 DMA line after its 10/27/09 gap down. As recently noted, "Choppy action has not allowed it to form a sound base in recent weeks." BIDU traded up as much as +23% from its price when featured in yellow in the 9/08/09 Mid-Day BreakOuts Report (read here).
>>> The latest Featured Stock Update with an annotated graph appeared on 11/10/2009. click here.
|
|
C
A
S
I |
News |
Chart |
SEC
View all notes Alert
me of new notes
Company
Profile
|
CACC
- NASDAQ
Credit Acceptance Corp
FINANCIAL SERVICES - Credit Services
|
$35.00
|
+0.19
|
20,889
58% DAV
35,800
|
9/29/2009
(Date
Featured) |
$33.48
(Price
Featured) |
PP = $32.60 |
G |
| MB = $34.23 |
Most Recent Note - 11/18/2009 5:06:00 PM
G - Still continuing its consolidation in an orderly fashion above prior chart highs and its 50 DMA line in the $32 area coinciding as an important support level to watch on pullbacks. The Finance - Consumer/Commercial Loans firm has maintained a great track record of annual and quarterly sales revenues and earnings increases. It was featured on 9/29/09 in yellow in the mid-day report (read here).
>>> The latest Featured Stock Update with an annotated graph appeared on 11/16/2009. click here.
|
|
C
A
S
I |
News |
Chart |
SEC
View all notes Alert
me of new notes
Company
Profile
|
CRM
- NYSE
Salesforce.com Inc
INTERNET - Internet Software & Services
|
$63.61
|
-2.00
|
6,069,112
349% DAV
1,738,300
|
8/16/2009
(Date
Featured) |
$47.12
(Price
Featured) |
PP = $45.59 |
G |
| MB = $47.87 |
Most Recent Note - 11/18/2009 5:28:14 PM
G - Gapped down today for a loss on higher volume yet closed near its intra-day high following another strong quarterly report for the period ended October 31, 2009. It is not near any sound base, but after finding prompt support at its 50 DMA line it is within close range of its prior high.
>>> The latest Featured Stock Update with an annotated graph appeared on 11/9/2009. click here.
|
|
C
A
S
I |
News |
Chart |
SEC
View all notes Alert
me of new notes
Company
Profile
|
GMCR
- NASDAQ
Green Mtn Coffee Roastrs
FOOD & BEVERAGE - Processed & Packaged Goods
|
$65.86
|
-2.94
|
2,224,188
166% DAV
1,343,000
|
10/5/2009
(Date
Featured) |
$71.11
(Price
Featured) |
PP = $75.89 |
G |
| MB = $79.68 |
Most Recent Note - 11/18/2009 5:31:07 PM
G - Considerable loss today on heavy volume led to technical deterioration under its recent lows near $65, closing at its lowest price since 9/15/09, raising more serious concerns. It has triggered a sell signal by its 50 DMA line violation. Gapped down on 11/12/09 after reporting strong quarterly results for the period ended Sept 30, 2009. As recently noted, "Its choppy action in recent weeks has not allowed for a sound new base to form."
>>> The latest Featured Stock Update with an annotated graph appeared on 11/11/2009. click here.
|
|
C
A
S
I |
News |
Chart |
SEC
View all notes Alert
me of new notes
Company
Profile
|
HEAT
-
|
$13.80
|
+1.31
|
1,413,205
244% DAV
579,400
|
11/17/2009
(Date
Featured) |
$12.00
(Price
Featured) |
PP = $12.61 |
G |
| MB = $13.24 |
Most Recent Note - 11/18/2009 5:35:13 PM
G - Gain today with volume heavy for the 3rd consecutive session helped it blast more than 5% above its pivot point. Its color code is changed to green. It was first featured in yellow in the 11/17/09 mid-day report (read here) when technically rising from a "double bottom" base, reaching a new all-time high. On 9/18/09 it completed an additional share offering. There is limited history for this small Chinese firm in the Pollution Control - Equipment group, however its reported annual earnings (A criteria) history has been strong, and the 3 latest quarters show sales revenues and earnings increases well above the +25% guideline.
>>> The latest Featured Stock Update with an annotated graph appeared on 11/17/2009. click here.
|
|
C
A
S
I |
News |
Chart |
SEC
View all notes Alert
me of new notes
Company
Profile
|
LFT
-
|
$32.61
|
+0.39
|
3,020,926
731% DAV
413,100
|
11/17/2009
(Date
Featured) |
$31.77
(Price
Featured) |
PP = $33.04 |
Y |
| MB = $34.69 |
Most Recent Note - 11/18/2009 5:40:32 PM
Y - Breakaway gap up today helped it blast from a choppy 14-week base, confirming a powerful technical breakout with heavy volume. However, its close near the session low raised some concerns because it technically put it back below its pivot point after it had briefly traded above its "max buy" price and above Oct 2007 all-time high. Recent highs in the $31 area are an initial support level to watch. A proposed offering of additional shares on 11/16/09 seems well received by the market. Its fundamentals remain strong.
>>> The latest Featured Stock Update with an annotated graph appeared on 11/18/2009. click here.
|
|
C
A
S
I |
News |
Chart |
SEC
View all notes Alert
me of new notes
Company
Profile
|
|
|
|
THESE ARE NOT BUY RECOMMENDATIONS!
Comments contained in the body of this report are technical
opinions only. The material herein has been obtained
from sources believed to be reliable and accurate, however,
its accuracy and completeness cannot be guaranteed.
This site is not an investment advisor, hence it does
not endorse or recommend any securities or other investments.
Any recommendation contained in this report may not
be suitable for all investors and it is not to be deemed
an offer or solicitation on our part with respect to
the purchase or sale of any securities. All trademarks,
service marks and trade names appearing in this report
are the property of their respective owners, and are
likewise used for identification purposes only.
This report is a service available
only to active Paid Premium Members.
You may opt-out of receiving report notifications
at any time. Questions or comments may be submitted
by writing to Premium Membership Services 665 S.E. 10 Street, Suite 201 Deerfield Beach, FL 33441-5634 or by calling 1-800-965-8307
or 954-785-1121.
|
|
|


