You are not logged in.
This means you
CAN ONLY VIEW reports that were published prior to Monday, April 14, 2025.
You
MUST UPGRADE YOUR MEMBERSHIP if you want to see any current reports.
AFTER MARKET UPDATE - WEDNESDAY, NOVEMBER 17TH, 2010
Previous After Market Report Next After Market Report >>>
|
|
|
|
DOW |
-15.62 |
11,007.88 |
-0.14% |
|
Volume |
953,191,147 |
-30% |
|
Volume |
1,831,764,538 |
-19% |
|
NASDAQ |
+6.17 |
2,476.01 |
+0.25% |
|
Advancers |
1,807 |
59% |
|
Advancers |
1,374 |
50% |
|
S&P 500 |
+0.25 |
1,178.59 |
+0.02% |
|
Decliners |
1,182 |
38% |
|
Decliners |
1,245 |
45% |
|
Russell 2000 |
+2.43 |
707.77 |
+0.34% |
|
52 Wk Highs |
19 |
|
|
52 Wk Highs |
42 |
|
|
S&P 600 |
+0.43 |
376.34 |
+0.11% |
|
52 Wk Lows |
22 |
|
|
52 Wk Lows |
46 |
|
|
 |
Indices' Weakness Labeled Another Correction Following Noted Deterioration
Kenneth J. Gruneisen - Passed the CAN SLIM® Master's Exam
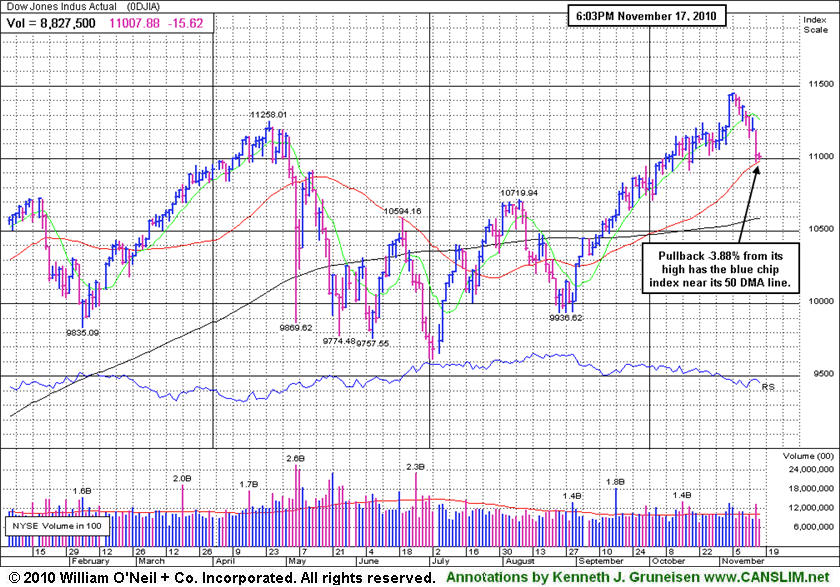
On Wednesday advancers outnumbered decliners by a 3-to-2 ratio on the NYSE, however advancers only narrowly led decliners on the Nasdaq exchange. Volume totals were reported lighter than Tuesday's totals on the Nasdaq exchange and on the NYSE, indicating that buying demand was not picking up from the institutional crowd. New 52-week lows outnumbered new 52-week highs for a second day in a row on both major exchanges, after it was noted in the prior commentary that new highs had been until then outnumbering new lows since August 31, 2010. There were only 5 high-ranked companies from the CANSLIM.net Leaders List making new 52-week highs and appearing on the CANSLIM.net BreakOuts Page, down from the total of 8 issues on the prior session. Leadership has waned significantly since November 4th, when were 188 stocks appearing on the CANSLIM.net BreakOuts Page and significantly more new highs showing up on the Nasdaq and NYSE. Additionally, the newspaper's latest read on the market is that the latest confirmed rally which began with the September 1st follow-through day has ended, and the broad market (M criteria) is back in a correction.
Economic reports were lackluster. The annual increase in core consumer prices was the smallest on record in October. Housing starts in the same month slumped to their lowest level in more than a year. Commodity prices were under pressure after the Chinese government said it will take measures to stabilize prices. Crude oil fell almost $2 a barrel to a four-week low, even after the U.S. Energy Department said U.S. supplies dropped the most in 15 months.
There were gains for 20 of the 29 high-ranked stocks currently listed on the Featured Stocks Page, however, among the list's 9 decliners was Network Appliance Inc (NTAP -6.53%), which dove with more than 3 times average volume for a 5th consecutive loss. The Computer - Data Storage firm violated its 50-day moving average (DMA) line and prior highs which were previously cited as important chart support to watch, triggering technical sell signals.
Based on the recent deterioration and dearth of leadership, investors should reduce margin exposure and refrain from new buying efforts. Disciplined investors would wait until a new confirmed rally with a follow-through day suggests that another sustainable advance may be at hand. Keep your focus on the action in the major averages and high-ranked leaders to know that your investment portfolio is in proper step with the market direction (M criteria).
PICTURED: The Dow Jones Industrial Average's pullback -3.88% from its latest high has the blue chip index near its 50-day moving average (DMA) line. Meanwhile, the other major averages have slightly more cushion between their current levels ands their respective short-term averages.
|
 Kenneth J. Gruneisen started out as a licensed stockbroker in August 1987, a couple of months prior to the historic stock market crash that took the Dow Jones Industrial Average down -22.6% in a single day. He has published daily fact-based fundamental and technical analysis on high-ranked stocks online for two decades. Through FACTBASEDINVESTING.COM, Kenneth provides educational articles, news, market commentary, and other information regarding proven investment systems that work in good times and bad.
Comments contained in the body of this report are technical opinions only and are not necessarily those of Gruneisen Growth Corp. The material herein has been obtained from sources believed to be reliable and accurate, however, its accuracy and completeness cannot be guaranteed. Our firm, employees, and customers may effect transactions, including transactions contrary to any recommendation herein, or have positions in the securities mentioned herein or options with respect thereto. Any recommendation contained in this report may not be suitable for all investors and it is not to be deemed an offer or solicitation on our part with respect to the purchase or sale of any securities. |
|
 |
Financial Groups Among Worst Performers Weighing On Market
Kenneth J. Gruneisen - Passed the CAN SLIM® Master's Exam
Financial shares were an influential negative on the major averages again as the Bank Index ($BKX -1.40%) and Broker/Dealer Index ($XBD -0.39%) ended lower. While the Retail Index ($RLX +0.80%), Healthcare Index ($HMO +0.66%), and Internet Index ($IIX +0.64%) posted modest gains, the Semiconductor Index ($SOX -0.06%), Biotechnology Index ($BTK +0.04%), and Networking Index ($NWX +0.09%) finished virtually flat. The Oil Services Index ($OSX +1.32%) tacked on a solid gain while the Integrated Oil Index ($XOI +0.09%) and Gold & Silver Index ($XAU +0.22%) barely edged higher.
Charts courtesy www.stockcharts.com
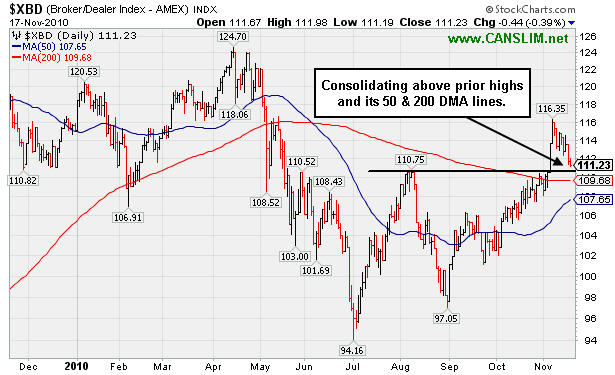
PICTURED: The Broker/Dealer Index ($XBD -0.39%) ended lower, consolidating above prior highs and its 50-day moving average (DMA) line and 200 DMA line. It is obviously in better technical shape than the Bank Index. However, any subsequent deterioration in this index would bode poorly for any new rally's chances.
| Oil Services |
$OSX |
221.05 |
+2.87 |
+1.32% |
+13.41% |
| Healthcare |
$HMO |
1,639.05 |
+10.78 |
+0.66% |
+11.28% |
| Integrated Oil |
$XOI |
1,098.71 |
+1.00 |
+0.09% |
+2.86% |
| Semiconductor |
$SOX |
373.85 |
-0.22 |
-0.06% |
+3.87% |
| Networking |
$NWX |
261.53 |
+0.24 |
+0.09% |
+13.19% |
| Internet |
$IIX |
295.10 |
+1.87 |
+0.64% |
+26.19% |
| Broker/Dealer |
$XBD |
111.23 |
-0.43 |
-0.39% |
-3.32% |
| Retail |
$RLX |
474.29 |
+3.76 |
+0.80% |
+15.37% |
| Gold & Silver |
$XAU |
207.19 |
+0.46 |
+0.22% |
+23.14% |
| Bank |
$BKX |
45.78 |
-0.65 |
-1.40% |
+7.19% |
| Biotech |
$BTK |
1,160.19 |
+0.41 |
+0.04% |
+23.15% |
|
|
|
 |
High-Ranked Networking Firm In Sinking Broader Market
Kenneth J. Gruneisen - Passed the CAN SLIM® Master's Exam
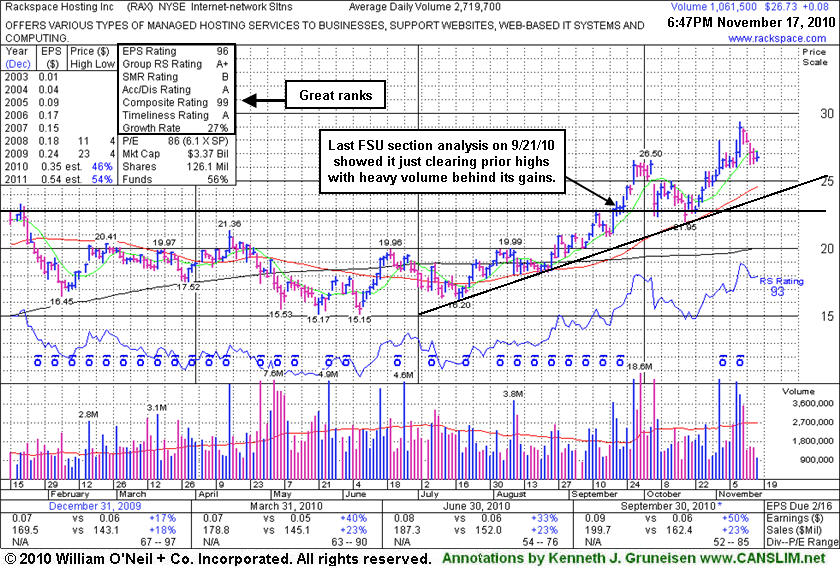
Rackspace Hosting Inc (RAX +$0.08 or +0.30% to $26.73) edged higher today on light volume. Weakness after a gap down on Monday has it slumping toward prior highs near $26 that define initial chart support above its 50-day moving average (DMA) line and an upward trendline connecting its July-October lows. This high-ranked Internet - Network Solutions firm is -8.9% from last week's all-time highs. Since it was last analyzed in this FSU section on 9/21/10 with an annotated graph under the headline "No Overhead Supply Left To Act As Resistance" it made quick progress, then found support near its old chart highs while going through a choppy consolidation. A subsequent rally to new highs was marked by heavy volume again, and now the volume totals have been cooling while it is consolidating, but it is extended from a proper base. Additionally, the M criteria is arguing against new buying efforts again based on recently noted deterioration in the major average and a sudden evaporation of leadership (new highs) since November 4th when new highs totals on the exchanges recently peaked.
No overhead supply remains to hinder its progress. This high-ranked Internet-Networking Solutions firm has earned very high ranks, and 3 of the past 4 quarterly earnings comparisons showed better than +25% increases. Its annual earnings history (A criteria) since trading began in 2008 has been good.
|
|
|
Color Codes Explained :
Y - Better candidates highlighted by our
staff of experts.
G - Previously featured
in past reports as yellow but may no longer be buyable under the
guidelines.
***Last / Change / Volume data in this table is the closing quote data***
Symbol/Exchange
Company Name
Industry Group |
PRICE |
CHANGE
(%Change) |
Day High |
Volume
(% DAV)
(% 50 day avg vol) |
52 Wk Hi
% From Hi |
Featured
Date |
Price
Featured |
Pivot Featured |
|
Max Buy |
ABV
-
NYSE
Comp De Bebidas Adr
FOOD and BEVERAGE - Beverages - Brewers
|
$138.19
|
+3.48
2.58% |
$139.47
|
553,419
84.40% of 50 DAV
50 DAV is 655,700
|
$145.36
-4.93%
|
11/4/2010
|
$142.35
|
PP = $143.63
|
|
MB = $150.81
|
 Most Recent Note - 11/17/2010 3:32:56 PM
G - Gain today on light volume follows losses with higher (near average) volume while consolidating above a recent low ($133.38 on 10/27/10) that defines support above its 50 DMA line. Color code was changed to green based upon its latest weakness, yet it remains only -4.8% off its all time high.
>>> The latest Featured Stock Update with an annotated graph appeared on 10/11/2010. Click here.
View all notes |
Alert me of new notes |
CANSLIM.net Company Profile |
SEC |
Zacks Reports |
StockTalk |
News |
Chart |
Request a new note
C
A N
S L
I M


|
ARUN
-
NASDAQ
Aruba Networks Inc
COMPUTER HARDWARE - Networking andamp; Communication Dev
|
$21.32
|
-0.03
-0.14% |
$21.79
|
3,646,080
152.53% of 50 DAV
50 DAV is 2,390,400
|
$23.85
-10.61%
|
8/30/2010
|
$18.12
|
PP = $18.51
|
|
MB = $19.44
|
Most Recent Note - 11/17/2010 4:56:58 PM
G - Enduring distributional pressure yet remaining near its 50 DMA line, important near-term support to watch. Reported earnings news after the close for its latest quarter ended October 31, 2010.
>>> The latest Featured Stock Update with an annotated graph appeared on 10/26/2010. Click here.
View all notes |
Alert me of new notes |
CANSLIM.net Company Profile |
SEC |
Zacks Reports |
StockTalk |
News |
Chart |
Request a new note
C
A N
S L
I M
|
BIDU
-
NASDAQ
Baidu Inc Ads
INTERNET - Internet Information Providers
|
$106.92
|
+3.32
3.20% |
$108.44
|
11,237,989
94.52% of 50 DAV
50 DAV is 11,889,200
|
$115.04
-7.06%
|
9/17/2010
|
$85.73
|
PP = $88.42
|
|
MB = $92.84
|
Most Recent Note - 11/17/2010 3:26:46 PM
G - Up on lighter volume today after enduring mild distributional pressure and slumping toward its 50 DMA line. It may produce more climactic gains, however it is extended from a sound base pattern now and a riskier "late stage" candidate. BIDU is up 11-fold from when it was first featured in yellow on October 30, 2006 (read here). Following a deep correction and Bear Market, it has been a fixture on the Featured Stocks page and rallied +212% in the 14 months since returning to prominence September 8, 2009 (read here).
>>> The latest Featured Stock Update with an annotated graph appeared on 10/7/2010. Click here.
View all notes |
Alert me of new notes |
CANSLIM.net Company Profile |
SEC |
Zacks Reports |
StockTalk |
News |
Chart |
Request a new note
C
A N
S L
I M
|
CACC
-
NASDAQ
Credit Acceptance Corp
FINANCIAL SERVICES - Credit Services
|
$56.18
|
+0.79
1.43% |
$56.90
|
8,175
32.44% of 50 DAV
50 DAV is 25,200
|
$63.45
-11.46%
|
11/3/2010
|
$59.86
|
PP = $63.55
|
|
MB = $66.73
|
Most Recent Note - 11/17/2010 3:35:17 PM
G - Gain today with light volume halts an 8-session slide that violated the previously noted chart low ($55.07 on 10/04/10), raising concerns. Long ago chart high ($53.97) are the next likely support level above its 200 DMA line.
>>> The latest Featured Stock Update with an annotated graph appeared on 10/29/2010. Click here.
View all notes |
Alert me of new notes |
CANSLIM.net Company Profile |
SEC |
Zacks Reports |
StockTalk |
News |
Chart |
Request a new note
C
A N
S L
I M
|
CMG
-
NYSE
Chipotle Mexican Grill
LEISURE - Restaurants
|
$230.96
|
+5.87
2.61% |
$231.80
|
650,309
80.68% of 50 DAV
50 DAV is 806,000
|
$240.78
-4.08%
|
9/1/2010
|
$158.31
|
PP = $155.52
|
|
MB = $163.30
|
Most Recent Note - 11/17/2010 2:56:53 PM
G - Consolidating near all-time highs, enduring mild distributional pressure this week after recent volume-driven gains. It may produce more climactic gains, however it is very extended from any sound base pattern. Its 50 DMA line (now $192) defines the nearest chart support level.
>>> The latest Featured Stock Update with an annotated graph appeared on 10/28/2010. Click here.
View all notes |
Alert me of new notes |
CANSLIM.net Company Profile |
SEC |
Zacks Reports |
StockTalk |
News |
Chart |
Request a new note
C
A N
S L
I M
|
Symbol/Exchange
Company Name
Industry Group |
PRICE |
CHANGE
(%Change) |
Day High |
Volume
(% DAV)
(% 50 day avg vol) |
52 Wk Hi
% From Hi |
Featured
Date |
Price
Featured |
Pivot Featured |
|
Max Buy |
CTRP
-
NASDAQ
Ctrip.Com Intl Ltd Adr
LEISURE - Resorts and Casinos
|
$45.90
|
+0.52
1.15% |
$46.73
|
1,715,279
87.22% of 50 DAV
50 DAV is 1,966,700
|
$53.16
-13.66%
|
9/24/2010
|
$46.75
|
PP = $47.11
|
|
MB = $49.47
|
Most Recent Note - 11/16/2010 4:24:30 PM
G - Slumped further below its 50 DMA line today. The loss with above average volume raised greater concerns as it closed below its old high close ($45.80 from 6/21/10) completely negating its prior breakout and all gains since its breakout shown in the last FSU section analysis.
>>> The latest Featured Stock Update with an annotated graph appeared on 9/28/2010. Click here.
View all notes |
Alert me of new notes |
CANSLIM.net Company Profile |
SEC |
Zacks Reports |
StockTalk |
News |
Chart |
Request a new note
C
A N
S L
I M
|
DECK
-
NASDAQ
Deckers Outdoor Corp
CONSUMER NON-DURABLES - Textile - Apparel Footwear
|
$61.54
|
+1.57
2.62% |
$62.39
|
999,005
83.57% of 50 DAV
50 DAV is 1,195,400
|
$63.55
-3.16%
|
10/27/2010
|
$54.16
|
PP = $54.86
|
|
MB = $57.60
|
Most Recent Note - 11/17/2010 3:29:20 PM
G - Posting a gain today, but it is extended from its latest sound base, consolidating above prior highs defining important chart support to watch well above its 50 DMA line.
>>> The latest Featured Stock Update with an annotated graph appeared on 10/27/2010. Click here.
View all notes |
Alert me of new notes |
CANSLIM.net Company Profile |
SEC |
Zacks Reports |
StockTalk |
News |
Chart |
Request a new note
C
A N
S L
I M
|
EZPW
-
NASDAQ
Ezcorp Inc Cl A
SPECIALTY RETAIL - Specialty Retail, Other
|
$24.50
|
-0.52
-2.08% |
$25.00
|
276,992
92.12% of 50 DAV
50 DAV is 300,700
|
$25.65
-4.48%
|
11/5/2010
|
$24.02
|
PP = $23.85
|
|
MB = $25.04
|
Most Recent Note - 11/17/2010 3:05:22 PM
G - Consolidating near its all-time high while recently enduring mild distributional pressure. Prior highs in the $22-23 area define chart support to watch above its 50 DMA line.
>>> The latest Featured Stock Update with an annotated graph appeared on 11/6/2010. Click here.
View all notes |
Alert me of new notes |
CANSLIM.net Company Profile |
SEC |
Zacks Reports |
StockTalk |
News |
Chart |
Request a new note
C
A N
S L
I M
|
FFIV
-
NASDAQ
F 5 Networks Inc
INTERNET - Internet Software and Services
|
$115.01
|
-0.94
-0.81% |
$118.83
|
3,770,650
141.38% of 50 DAV
50 DAV is 2,667,000
|
$127.95
-10.11%
|
6/16/2010
|
$74.50
|
PP = $74.10
|
|
MB = $77.81
|
Most Recent Note - 11/17/2010 3:37:24 PM
G - Pulling back from all-time highs today for a 3rd consecutive small loss. It is extended from any sound base pattern. Prior highs in the $112 area define initial chart support.
>>> The latest Featured Stock Update with an annotated graph appeared on 11/15/2010. Click here.
View all notes |
Alert me of new notes |
CANSLIM.net Company Profile |
SEC |
Zacks Reports |
StockTalk |
News |
Chart |
Request a new note
C
A N
S L
I M
|
FOSL
-
NASDAQ
Fossil Inc
CONSUMER DURABLES - Recreational Goods, Other
|
$66.82
|
+0.96
1.46% |
$67.10
|
615,797
80.10% of 50 DAV
50 DAV is 768,800
|
$70.07
-4.64%
|
10/20/2010
|
$54.12
|
PP = $55.61
|
|
MB = $58.39
|
Most Recent Note - 11/16/2010 11:00:58 AM
G - Extended from any sound base, it is consolidating in a tight range for the past week with volume totals cooling. An upward trendline connecting its July-October lows defines support to watch above its 50 DMA line.
>>> The latest Featured Stock Update with an annotated graph appeared on 10/5/2010. Click here.
View all notes |
Alert me of new notes |
CANSLIM.net Company Profile |
SEC |
Zacks Reports |
StockTalk |
News |
Chart |
Request a new note
C
A N
S L
I M
|
Symbol/Exchange
Company Name
Industry Group |
PRICE |
CHANGE
(%Change) |
Day High |
Volume
(% DAV)
(% 50 day avg vol) |
52 Wk Hi
% From Hi |
Featured
Date |
Price
Featured |
Pivot Featured |
|
Max Buy |
HMSY
-
NASDAQ
H M S Holdings Corp
COMPUTER SOFTWARE and SERVICES - Healthcare Information Service
|
$60.40
|
-0.06
-0.10% |
$60.73
|
136,167
63.42% of 50 DAV
50 DAV is 214,700
|
$62.91
-3.99%
|
9/27/2010
|
$57.97
|
PP = $58.36
|
|
MB = $61.28
|
Most Recent Note - 11/15/2010 1:22:18 PM
Y - Perched less than -3% off its 52-week high with no resistance remaining due to overhead supply. Prompt support showed up near its 50 DMA line while trading was volatile near its latest earnings report. Any subsequent violation of its 50 DMA could raise greater concerns.
>>> The latest Featured Stock Update with an annotated graph appeared on 9/27/2010. Click here.
View all notes |
Alert me of new notes |
CANSLIM.net Company Profile |
SEC |
Zacks Reports |
StockTalk |
News |
Chart |
Request a new note
C
A N
S L
I M
|
HS
-
NYSE
Healthspring Inc
HEALTH SERVICES - Health Care Plans
|
$27.85
|
+0.57
2.09% |
$28.00
|
420,815
58.04% of 50 DAV
50 DAV is 725,100
|
$29.80
-6.54%
|
8/27/2010
|
$19.91
|
PP = $19.75
|
|
MB = $20.74
|
Most Recent Note - 11/17/2010 3:11:50 PM
G - Hovering -6.6% off its 52-week high, and volume totals have recently been cooling while consolidating above its 50 DMA line which acted as support.
>>> The latest Featured Stock Update with an annotated graph appeared on 10/22/2010. Click here.
View all notes |
Alert me of new notes |
CANSLIM.net Company Profile |
SEC |
Zacks Reports |
StockTalk |
News |
Chart |
Request a new note
C
A N
S L
I M
|
IGTE
-
NASDAQ
Igate Corp
COMPUTER SOFTWARE and SERVICES - Information Technology Service
|
$21.96
|
-0.14
-0.63% |
$22.16
|
474,003
67.99% of 50 DAV
50 DAV is 697,200
|
$22.90
-4.10%
|
10/26/2010
|
$17.29
|
PP = $19.55
|
|
MB = $20.53
|
Most Recent Note - 11/15/2010 4:37:00 PM
G - A small gain on below average volume today ended 5 cents off its best ever close. Extended from its latest base, its prior chart highs in the $19 area define initial chart support above its 50 DMA line.
>>> The latest Featured Stock Update with an annotated graph appeared on 11/11/2010. Click here.
View all notes |
Alert me of new notes |
CANSLIM.net Company Profile |
SEC |
Zacks Reports |
StockTalk |
News |
Chart |
Request a new note
C
A N
S L
I M
|
JOBS
-
NASDAQ
Fifty One Job Inc Ads
DIVERSIFIED SERVICES - Staffing and; Outsourcing Service
|
$47.13
|
+2.07
4.59% |
$47.78
|
173,077
80.46% of 50 DAV
50 DAV is 215,100
|
$51.75
-8.93%
|
10/13/2010
|
$42.07
|
PP = $40.60
|
|
MB = $42.63
|
Most Recent Note - 11/17/2010 2:50:30 PM
G - Gain today on lighter volume follows recent distribution, and it has violated the previously noted initial support defined buy an upward trendline connecting its September-November lows. Its 50 DMA line is the next important support to watch.
>>> The latest Featured Stock Update with an annotated graph appeared on 11/16/2010. Click here.
View all notes |
Alert me of new notes |
CANSLIM.net Company Profile |
SEC |
Zacks Reports |
StockTalk |
News |
Chart |
Request a new note
C
A N
S L
I M
|
LFT
-
NYSE
Longtop Financl Tech Ads
COMPUTER SOFTWARE and SERVICES - Business Software and Services
|
$39.77
|
+0.33
0.84% |
$40.00
|
419,929
81.52% of 50 DAV
50 DAV is 515,100
|
$42.86
-7.21%
|
11/5/2010
|
$41.83
|
PP = $40.96
|
|
MB = $43.01
|
Most Recent Note - 11/15/2010 10:06:26 AM
G - Violated prior highs in the $40-41 area and slumped quickly below its 50 DMA line today, raising concerns. Color code is changed to green, and only a prompt rebound above the $40 would help its outlook.
>>> The latest Featured Stock Update with an annotated graph appeared on 10/14/2010. Click here.
View all notes |
Alert me of new notes |
CANSLIM.net Company Profile |
SEC |
Zacks Reports |
StockTalk |
News |
Chart |
Request a new note
C
A N
S L
I M
|
Symbol/Exchange
Company Name
Industry Group |
PRICE |
CHANGE
(%Change) |
Day High |
Volume
(% DAV)
(% 50 day avg vol) |
52 Wk Hi
% From Hi |
Featured
Date |
Price
Featured |
Pivot Featured |
|
Max Buy |
LULU
-
NASDAQ
Lululemon Athletica
MANUFACTURING - Textile Manufacturing
|
$47.08
|
+0.00
0.00% |
$48.14
|
1,013,368
85.32% of 50 DAV
50 DAV is 1,187,700
|
$49.75
-5.37%
|
10/8/2010
|
$47.66
|
PP = $46.67
|
|
MB = $49.00
|
Most Recent Note - 11/16/2010 4:14:49 PM
Y - Finished higher after a gap down today, making a bullish "positive reversal" on the session. Its 50 DMA line is an initial support level above recent lows in the $42 area.
>>> The latest Featured Stock Update with an annotated graph appeared on 10/8/2010. Click here.
View all notes |
Alert me of new notes |
CANSLIM.net Company Profile |
SEC |
Zacks Reports |
StockTalk |
News |
Chart |
Request a new note
C
A N
S L
I M
|
MWIV
-
NASDAQ
M W I Veterinary Supply
HEALTH SERVICES - Medical Instruments and; Supplies
|
$57.41
|
-0.04
-0.07% |
$58.36
|
79,933
142.48% of 50 DAV
50 DAV is 56,100
|
$63.94
-10.21%
|
11/4/2010
|
$61.79
|
PP = $59.60
|
|
MB = $62.58
|
Most Recent Note - 11/16/2010 4:44:01 PM
Y - Small gap down today, testing its 50 DMA line which has been repeatedly noted as a very important support level.
>>> The latest Featured Stock Update with an annotated graph appeared on 11/2/2010. Click here.
View all notes |
Alert me of new notes |
CANSLIM.net Company Profile |
SEC |
Zacks Reports |
StockTalk |
News |
Chart |
Request a new note
C
A N
S L
I M
|
NEOG
-
NASDAQ
Neogen Corp
DRUGS - Diagnostic Substances
|
$34.44
|
-0.64
-1.82% |
$35.14
|
71,889
83.11% of 50 DAV
50 DAV is 86,500
|
$36.90
-6.67%
|
9/1/2010
|
$30.79
|
PP = $30.49
|
|
MB = $32.01
|
Most Recent Note - 11/17/2010 3:38:53 PM
G - Pulling back near its 50 DMA line which recently has been a reliable support level. Any subsequent violation could raise concerns and trigger sell signals. It recently stalled after quietly claiming a new all-time high.
>>> The latest Featured Stock Update with an annotated graph appeared on 10/13/2010. Click here.
View all notes |
Alert me of new notes |
CANSLIM.net Company Profile |
SEC |
Zacks Reports |
StockTalk |
News |
Chart |
Request a new note
C
A N
S L
I M
|
NFLX
-
NASDAQ
Netflix Inc
SPECIALTY RETAIL - Music and Video Stores
|
$166.68
|
+1.28
0.77% |
$168.38
|
2,687,172
47.94% of 50 DAV
50 DAV is 5,605,300
|
$184.74
-9.78%
|
11/9/2010
|
$173.10
|
PP = $184.84
|
|
MB = $194.08
|
Most Recent Note - 11/17/2010 3:07:38 PM
Y - Consolidating near all-time highs, yet just above support at its 50 DMA line. A subsequent breakout with heavy volume would signal a new (or add-on) technical buy signal, however it is a riskier "late stage" set-up.
>>> The latest Featured Stock Update with an annotated graph appeared on 10/1/2010. Click here.
View all notes |
Alert me of new notes |
CANSLIM.net Company Profile |
SEC |
Zacks Reports |
StockTalk |
News |
Chart |
Request a new note
C
A N
S L
I M
|
NTAP
-
NASDAQ
Netapp Inc
COMPUTER HARDWARE - Data Storage Devices
|
$49.25
|
-3.44
-6.53% |
$54.77
|
27,610,214
386.25% of 50 DAV
50 DAV is 7,148,300
|
$57.96
-15.03%
|
9/8/2010
|
$46.98
|
PP = $44.99
|
|
MB = $47.24
|
Most Recent Note - 11/17/2010 5:46:27 PM
G - Down considerably today with more than 3 times average volume for a 5th consecutive loss, it violated its 50 DMA line and prior highs which were previously cited as important chart support to watch, triggering technical sell signals.
>>> The latest Featured Stock Update with an annotated graph appeared on 11/3/2010. Click here.
View all notes |
Alert me of new notes |
CANSLIM.net Company Profile |
SEC |
Zacks Reports |
StockTalk |
News |
Chart |
Request a new note
C
A N
S L
I M
|
Symbol/Exchange
Company Name
Industry Group |
PRICE |
CHANGE
(%Change) |
Day High |
Volume
(% DAV)
(% 50 day avg vol) |
52 Wk Hi
% From Hi |
Featured
Date |
Price
Featured |
Pivot Featured |
|
Max Buy |
ORCL
-
NASDAQ
Oracle Corp
COMPUTER SOFTWARE and SERVICES - Application Software
|
$27.91
|
+0.33
1.20% |
$28.11
|
24,632,218
59.70% of 50 DAV
50 DAV is 41,258,100
|
$29.82
-6.41%
|
9/20/2010
|
$27.32
|
PP = $26.73
|
|
MB = $28.07
|
Most Recent Note - 11/17/2010 3:10:21 PM
Y - Small gain today, trading back above its 50 DMA line. Recent weakness raised concerns even while the volume totals were below average. More damaging losses below its latest chart lows near $27.50 would raise greater concerns.
>>> The latest Featured Stock Update with an annotated graph appeared on 9/20/2010. Click here.
View all notes |
Alert me of new notes |
CANSLIM.net Company Profile |
SEC |
Zacks Reports |
StockTalk |
News |
Chart |
Request a new note
C
A N
S L
I M
|
PAY
-
NYSE
Verifone Systems Inc
COMPUTER HARDWARE - Transaction Automation Systems
|
$32.91
|
+1.07
3.36% |
$33.19
|
5,635,039
437.60% of 50 DAV
50 DAV is 1,287,700
|
$35.94
-8.43%
|
8/25/2010
|
$24.30
|
PP = $23.74
|
|
MB = $24.93
|
Most Recent Note - 11/17/2010 2:54:46 PM
G - Solid gain today on heavy volume, rallying on news it will acquire Hypercom Corp (HYC) for $7.32 in an all-stock deal. Perched above prior highs ($31.40) and its 50 DMA line while consolidating. It has the look of an advanced "ascending base" pattern after an impressive rally from its 7/26/10 breakout.
>>> The latest Featured Stock Update with an annotated graph appeared on 10/25/2010. Click here.
View all notes |
Alert me of new notes |
CANSLIM.net Company Profile |
SEC |
Zacks Reports |
StockTalk |
News |
Chart |
Request a new note
C
A N
S L
I M
|
RAX
-
NYSE
Rackspace Hosting Inc
INTERNET - Internet Software and; Services
|
$26.73
|
+0.08
0.30% |
$27.37
|
1,065,603
39.43% of 50 DAV
50 DAV is 2,702,400
|
$29.35
-8.93%
|
9/21/2010
|
$22.84
|
PP = $23.61
|
|
MB = $24.79
|
Most Recent Note - 11/15/2010 9:54:06 AM
G - Gapped down today, slumping toward prior highs near $26 that define initial chart support above its 50 DMA line. This high-ranked Internet - Network Solutions firm is -8% from last week's all-time highs.
>>> The latest Featured Stock Update with an annotated graph appeared on 11/17/2010. Click here.
View all notes |
Alert me of new notes |
CANSLIM.net Company Profile |
SEC |
Zacks Reports |
StockTalk |
News |
Chart |
Request a new note
C
A N
S L
I M
|
ROVI
-
NASDAQ
Rovi Corp
COMPUTER SOFTWARE andamp; SERVICES - Security Software andamp; Services
|
$53.36
|
+1.34
2.58% |
$52.46
|
1,714,743
108.50% of 50 DAV
50 DAV is 1,580,400
|
$53.61
-0.47%
|
10/29/2010
|
$49.99
|
PP = $53.10
|
|
MB = $55.76
|
Most Recent Note - 11/17/2010 3:02:39 PM
Y - Touched a new 2010 high with today's solid gain, and it is in healthy shape. However, concerns have risen amid broader market (M criteria) weakness while there suddenly is a dearth of leadership, compared to the beginning of November, when there were many stocks hitting new highs.
>>> The latest Featured Stock Update with an annotated graph appeared on 10/20/2010. Click here.
View all notes |
Alert me of new notes |
CANSLIM.net Company Profile |
SEC |
Zacks Reports |
StockTalk |
News |
Chart |
Request a new note
C
A N
S L
I M
|
SHOO
-
NASDAQ
Steven Madden Limited
CONSUMER NON-DURABLES - Textile - Apparel Footwear
|
$41.65
|
+0.36
0.87% |
$41.57
|
236,395
68.38% of 50 DAV
50 DAV is 345,700
|
$44.85
-7.13%
|
9/15/2010
|
$38.94
|
PP = $40.27
|
|
MB = $42.28
|
Most Recent Note - 11/17/2010 3:16:02 PM
G - Gain today on light volume, still finding support above its 50 DMA line and prior chart highs in the $40 area. It may be forming a "double bottom" type base, but it is currently short of the minimum 8-weeks length of a proper double bottom pattern. More damaging losses leading to a close below its short-term average would raise concerns and trigger technical sell signals.
>>> The latest Featured Stock Update with an annotated graph appeared on 9/29/2010. Click here.
View all notes |
Alert me of new notes |
CANSLIM.net Company Profile |
SEC |
Zacks Reports |
StockTalk |
News |
Chart |
Request a new note
C
A N
S L
I M
|
Symbol/Exchange
Company Name
Industry Group |
PRICE |
CHANGE
(%Change) |
Day High |
Volume
(% DAV)
(% 50 day avg vol) |
52 Wk Hi
% From Hi |
Featured
Date |
Price
Featured |
Pivot Featured |
|
Max Buy |
SLW
-
NYSE
Silver Wheaton Corp
METALS and; MINING - Silver
|
$32.82
|
+1.13
3.57% |
$31.90
|
11,016,361
126.93% of 50 DAV
50 DAV is 8,679,400
|
$37.20
-11.77%
|
8/25/2010
|
$21.40
|
PP = $21.99
|
|
MB = $23.09
|
Most Recent Note - 11/17/2010 3:24:52 PM
G - Gain today follows a few heavy distribution days in the past week or so. Recently noted - "Very extended from any sound base, it has been sputtering since its worrisome negative reversal on 11/09/10. Its 50 DMA line and prior highs in the $28 area define the nearest chart support."
>>> The latest Featured Stock Update with an annotated graph appeared on 10/18/2010. Click here.
View all notes |
Alert me of new notes |
CANSLIM.net Company Profile |
SEC |
Zacks Reports |
StockTalk |
News |
Chart |
Request a new note
C
A N
S L
I M
|
UA
-
NYSE
Under Armour Inc Cl A
CONSUMER NON-DURABLES - Textile - Apparel Clothing
|
$50.91
|
+0.91
1.82% |
$51.39
|
735,036
95.34% of 50 DAV
50 DAV is 771,000
|
$52.30
-2.66%
|
9/9/2010
|
$39.99
|
PP = $40.10
|
|
MB = $42.11
|
Most Recent Note - 11/16/2010 4:34:02 PM
G - Extended from any sound base and support at its 50 DMA line, it posted a gain today and bucked a mostly negative market. It has not encountered any distributional pressure and could produce more climactic gains. Some fundamental flaws with respect to the fact-based investment system have been recently noted as concerns.
>>> The latest Featured Stock Update with an annotated graph appeared on 11/4/2010. Click here.
View all notes |
Alert me of new notes |
CANSLIM.net Company Profile |
SEC |
Zacks Reports |
StockTalk |
News |
Chart |
Request a new note
C
A N
S L
I M
|
ULTA
-
NASDAQ
Ulta Salon Cosm & Frag
SPECIALTY RETAIL - Specialty Retail, Other
|
$31.50
|
-0.07
-0.22% |
$31.73
|
149,857
27.23% of 50 DAV
50 DAV is 550,300
|
$33.50
-5.97%
|
9/3/2010
|
$26.36
|
PP = $25.89
|
|
MB = $27.18
|
Most Recent Note - 11/15/2010 4:50:38 PM
G - Volume totals have been continually drying up since its big gain on 10/12/10. It is within close striking distance of its 52-week highs and its all-time high of $35.63 in Nov '07. Its 50 DMA line defines initial support to watch above prior chart highs in the $26 area. It could produce more climactic gains, however it is currently extended from any sound base.
>>> The latest Featured Stock Update with an annotated graph appeared on 11/1/2010. Click here.
View all notes |
Alert me of new notes |
CANSLIM.net Company Profile |
SEC |
Zacks Reports |
StockTalk |
News |
Chart |
Request a new note
C
A N
S L
I M
|
VIT
-
NYSE
Vanceinfo Tech Inc Ads
COMPUTER SOFTWARE and SERVICES - Business Software and Services
|
$34.50
|
+0.08
0.23% |
$34.77
|
1,503,770
247.57% of 50 DAV
50 DAV is 607,400
|
$38.43
-10.23%
|
7/8/2010
|
$25.20
|
PP = $26.58
|
|
MB = $27.91
|
Most Recent Note - 11/17/2010 3:21:12 PM
G - It has managed a positive reversal following a weak start today. Earlier weakness led to a brief violation of its 50 DMA line that defines important chart support to watch.
>>> The latest Featured Stock Update with an annotated graph appeared on 10/21/2010. Click here.
View all notes |
Alert me of new notes |
CANSLIM.net Company Profile |
SEC |
Zacks Reports |
StockTalk |
News |
Chart |
Request a new note
C
A N
S L
I M
|
|
 |
|
| Subscriber Questions: |
November 15, 2010 |
Dear Ken,
I am a free member and wondering what additional information you may have published concerning NTAP. I look forward to your comments and may consider upgrading to your pay services. Thanks!
Best regards, Missy |
| Ken's Response: |
November 17, 2010 |
Dear Missy,
Thanks for writing in. I received your info request and wanted to share this information about NTAP. As mentioned in this evening's commentary "Network Appliance Inc (NTAP -6.53%) dove with more than 3 times average volume for a 5th consecutive loss. The Computer - Data Storage firm violated its 50-day moving average (DMA) line and prior highs which were previously cited as important chart support to watch, triggering technical sell signals."
Prior to today's action, NTAP had recently been noted as - "Consolidating above its 50 DMA line and prior highs that define important chart support to watch. It is extended from any sound base." It is up +15% from when it was featured in the 9/08/10 CANSLIM.net mid-day report noted -"Hit a new 52-week high today, rising from an ascending base type pattern. Color code is changed to yellow with pivot point based on its 52-week high plus ten cents. Recent quarterly comparisons (C criteria) showed accelerating sales revenues and strong earnings increases, but a down turn in its FY '09 earnings is a concern with respect to its annual earnings (A criteria) history."
The latest analysis on NTAP from our "Featured Stock Update" section is included below:
Wedging To New Highs Without Great Volume Conviction- Wednesday, November 03, 2010
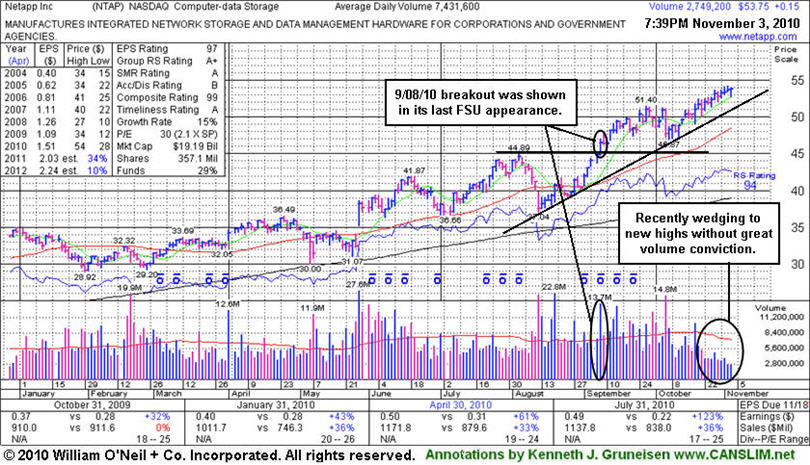
Network Appliance Inc. (NTAP +$0.15 or +0.28% to $53.75) posted another small gain today with light volume for a new high close. An upward trendline defines initial support above recent lows near $47 and its 50-day moving average (DMA) line. It has shown healthy action since its last appearance with an annotated graph on 9/08/10 under the headline "Gains For New Highs Today Backed By Nearly Twice Average Volume". Increasing institutional ownership (I criteria) is a very reassuring sign, having climbed from 308 top-rated funds in Sept '09 to 368 top-rated funds in Sep '10. There is no resistance remaining, making higher prices more likely for this high-ranked leader. However, its recent price/volume action is termed "wedging" as it has crept to new highs without great volume conviction. It has not formed a sound base pattern recently, and disciplined investors know that it is usually best to avoid chasing stocks that are extended from a sound base. Patience may allow for it to form a proper base. Recent quarterly comparisons (C criteria) showed accelerating sales revenues and strong earnings increases, but a down turn in its FY '09 earnings has been noted as a concern with respect to its annual earnings (A criteria) history. Long ago, this stock was featured on Thursday, March 30th, 2006 in the CANSLIM.net Mid Day Breakouts Report (read here). In May 2006, weak action resulted in it being dropped from the Featured Stocks list.
UPGRADE your membership to gain unlimited access to all of the analysis we provide on high-ranked leaders for the next year!
http://premium.canslim.net/orderforms1/specialoffer.asp?aff=addinfo.
Best regards,

Kenneth J. Gruneisen
Founder & Contributing Writer for CANSLIM.net
www.canslim.net |
|
|
|
THESE ARE NOT BUY RECOMMENDATIONS!
Comments contained in the body of this report are technical
opinions only. The material herein has been obtained
from sources believed to be reliable and accurate, however,
its accuracy and completeness cannot be guaranteed.
This site is not an investment advisor, hence it does
not endorse or recommend any securities or other investments.
Any recommendation contained in this report may not
be suitable for all investors and it is not to be deemed
an offer or solicitation on our part with respect to
the purchase or sale of any securities. All trademarks,
service marks and trade names appearing in this report
are the property of their respective owners, and are
likewise used for identification purposes only.
This report is a service available
only to active Paid Premium Members.
You may opt-out of receiving report notifications
at any time. Questions or comments may be submitted
by writing to Premium Membership Services 665 S.E. 10 Street, Suite 201 Deerfield Beach, FL 33441-5634 or by calling 1-800-965-8307
or 954-785-1121.
|
|
|

