You are not logged in.
This means you
CAN ONLY VIEW reports that were published prior to Monday, April 14, 2025.
You
MUST UPGRADE YOUR MEMBERSHIP if you want to see any current reports.
AFTER MARKET UPDATE - TUESDAY, NOVEMBER 17TH, 2009
Previous After Market Report Next After Market Report >>>
|
|
|
|
DOW |
+30.46 |
10,437.42 |
+0.29% |
|
Volume |
971,980,940 |
-15% |
|
Volume |
1,924,080,750 |
-11% |
|
NASDAQ |
+5.93 |
2,203.78 |
+0.27% |
|
Advancers |
1,349 |
43% |
|
Advancers |
1,259 |
44% |
|
S&P 500 |
+1.02 |
1,110.32 |
+0.09% |
|
Decliners |
1,652 |
53% |
|
Decliners |
1,443 |
50% |
|
Russell 2000 |
-0.53 |
602.34 |
-0.09% |
|
52 Wk Highs |
187 |
|
|
52 Wk Highs |
116 |
|
|
S&P 600 |
-0.91 |
318.31 |
-0.29% |
|
52 Wk Lows |
6 |
|
|
52 Wk Lows |
17 |
|
|
 |
Quiet Gains Help Latest Rally Continue Higher
Adam Sarhan, Contributing Writer,
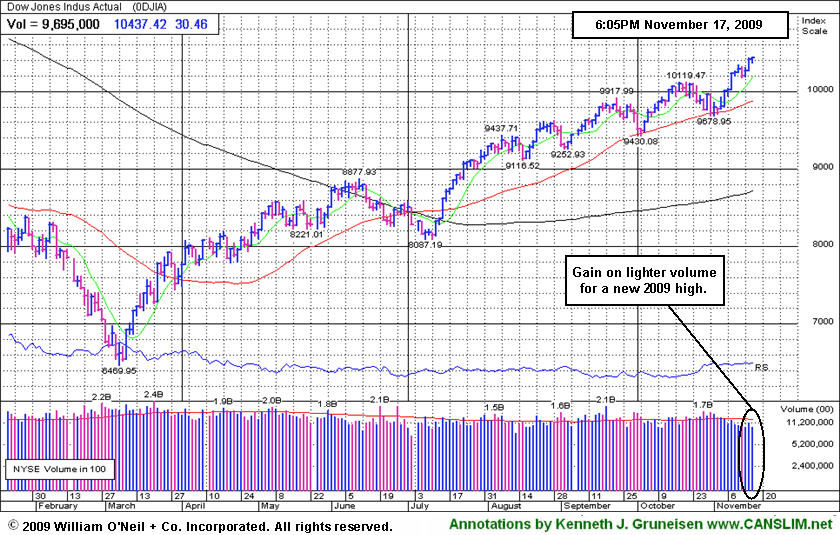
The bulls flexed their muscles today and sent the major averages higher even as the US dollar rallied! Volume, a critical component of institutional demand, was lower than Monday's levels which indicated a lack of buying from the institutional crowd. However, the fact that the major averages were down for most of the session and closed near their intra day highs helps offset that concern. Advancers narrowly trailed decliners on both the NYSE and on the Nasdaq exchange. There were 40 high-ranked companies from the CANSLIM.net Leaders List making a new 52-week high and appearing on the CANSLIM.net BreakOuts Page, down from the 61 issues that appeared on the prior session. In terms of new leadership, it was encouraging to see new 52-week highs outnumber new 52-week lows on the NYSE and Nasdaq exchange.
The major averages managed to close above near term support (formerly resistance) as the bulls continue to control this market. Most liquid leaders advanced today which reiterates the importance of keeping a close eye on the leaders. The universe of high ranked leading stocks remains uncomfortably thin which is exactly how this market has been performing since the March lows.
Turning to the economic front, inflation concerns eased after the government released a weaker than expected producer price index (PPI). The headline reading increased +0.3% last month after sliding -0.6% in September. October's reading was lower than the Street's estimate of a +0.5% rebound. However, the "big" news in the report was that the core rate, which excludes food and energy, unexpectedly fell -0.6%, following a -0.1% decline in September. This was lower than the Street's forecast for a +0.1% gain which helped allay inflation concerns. A separate report showed that the country's manufacturing sector continued to grow, albeit at a very slow rate. At 1:00pm EST, the National Association of Home Builders released their housing market index which was unchanged at 17 in November which gave investors some clue on how the housing starts will fare when the government releases that report tomorrow.
PICTURED: The Dow Jones Industrial Average quietly rose to a new 2009 high.
|
|
|
 |
Mixed Group Action With No Great Conviction
Kenneth J. Gruneisen - Passed the CAN SLIM® Master's Exam
The Internet Index ($IIX +0.50%), Networking Index ($NWX +0.53%), and Gold & Silver Index ($XAU +0.61%) posted modest gains which helped the major market averages stay in positive territory for the close. Financial shares were mixed as the Bank Index ($BKX +1.05%) rose, the Broker/Dealer Index ($XBD -0.91%) fell. Weakness in the Retail Index ($RLX -1.38%) weighed on the major market averages. The Biotechnology Index ($BTK -0.67%) and Oil Services Index ($OSX -0.65%) also closed modestly lower, meanwhile there was little change from the Healthcare Index ($HMO -0.14%), Integrated Oil Index ($XOI -0.00%), and Semiconductor Index ($SOX +0.15%).
Charts courtesy www.stockcharts.com
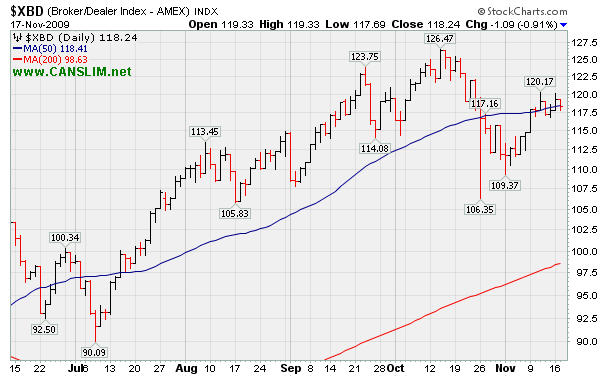
PICTURED: The Broker/Dealer Index ($XBD -0.91%) is consolidating near its 50-day moving average line.
| Oil Services |
$OSX |
202.47 |
-1.33 |
-0.65% |
+66.79% |
| Healthcare |
$HMO |
1,332.14 |
-1.86 |
-0.14% |
+38.74% |
| Integrated Oil |
$XOI |
1,103.37 |
-0.01 |
-0.00% |
+12.63% |
| Semiconductor |
$SOX |
324.30 |
+0.47 |
+0.15% |
+52.85% |
| Networking |
$NWX |
237.17 |
+1.25 |
+0.53% |
+64.83% |
| Internet |
$IIX |
229.21 |
+1.13 |
+0.50% |
+71.35% |
| Broker/Dealer |
$XBD |
118.24 |
-1.09 |
-0.91% |
+52.63% |
| Retail |
$RLX |
404.23 |
-5.64 |
-1.38% |
+44.75% |
| Gold & Silver |
$XAU |
187.40 |
+1.13 |
+0.61% |
+51.31% |
| Bank |
$BKX |
44.07 |
+0.46 |
+1.05% |
-0.56% |
| Biotech |
$BTK |
896.79 |
-6.02 |
-0.67% |
+38.57% |
|
|
|
 |
Close Near Pivot Point Equaled Best Ever
Kenneth J. Gruneisen - Passed the CAN SLIM® Master's Exam
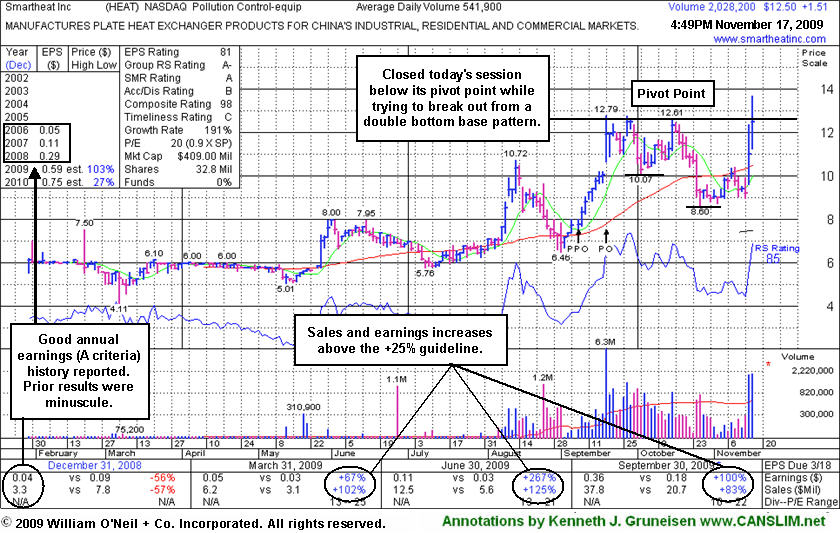
Smartheat Inc (HEAT + 1.50 or +13.65% to $12.49) matched its best ever close to the penny, and volume was almost 4 times average behind its big gain. It ended near the middle of its intra-day range after reaching a new all-time high, closing the session just under its pivot point. In today's mid-day report it was highlighted in yellow and noted when technically rising from a "double bottom" base pattern (read here). The second consecutive big gain on heavy volume helped it blast further above its 50-day moving average line. The action could be a sign it is encountering resistance as it tries to move into new high ground. To convincingly clinch a technical buy signal one would like to see more definitive proof of institutional buying demand. Pyramiding into the stock might allow careful investors to accumulate shares methodically without paying more than the $13.24 "max buy" price, which is 5% above its $12.61 pivot point.
As is proper for a double bottom base, the consolidation took place over a period of at least an 8 week span, and the second low undercut the first low. The lower low is the crucial "shakeout" during which weaker hands decide to unload their shares, helping exhaust selling pressure. That kind of price action makes it an ideal set-up for a more powerful breakout, but a buy signal should be confirmed by a gain with at least +50% above average volume and a solid close above a stock's pivot point. Note that on 9/18/09 it completed an additional share offering. There is limited history for this small Chinese firm in the Pollution Control - Equipment group, however its reported annual earnings (A criteria) history has been strong. The 3 latest quarters show sales revenues and earnings increases well above the +25% guideline, satisfying the C criteria.
|
|
|
Color Codes Explained :
Y - Better candidates highlighted by our
staff of experts.
G - Previously featured
in past reports as yellow but may no longer be buyable under the
guidelines.
***Last / Change / Volume quote data in this table corresponds with the timestamp on the note***
Symbol/Exchange
Company Name
Industry Group |
Last |
Chg. |
Vol
% DAV |
Date Featured |
Price Featured |
Latest Pivot Point
Featured |
Status |
| Latest Max Buy Price |
ARST
-
|
$24.92
|
-0.89
|
895,949
143% DAV
628,400
|
9/1/2009
(Date
Featured) |
$19.91
(Price
Featured) |
PP = $20.90 |
G |
| MB = $21.95 |
Most Recent Note - 11/17/2009 6:19:47 PM
G - Gapped down today for a loss on heavier volume after a negative reversal on the prior session. Color code remains green while dismissing its 10/15/09 high as a new pivot point, with concern over its "late stage" action without a recent base of substantial length. ARST was first featured in yellow at $19.91 in the 9/01/09 mid-day report with an annotated daily graph (read here).
>>> The latest Featured Stock Update with an annotated graph appeared on 11/6/2009. click here.
|
|
C
A
S
I |
News |
Chart |
SEC
View all notes Alert
me of new notes
Company
Profile
|
ASIA
-
|
$25.93
|
+0.20
|
628,722
63% DAV
1,004,800
|
10/14/2009
(Date
Featured) |
$23.05
(Price
Featured) |
PP = $22.19 |
G |
| MB = $23.30 |
Most Recent Note - 11/17/2009 6:20:22 PM
G - Small gain on light volume today for another new high close. It is extended from its latest sound base. Featured 10/14/09 in the mid-day report (read here) as it gapped up for a new 52-week high with 5 times average volume, triggering a technical buy signal by blasting above its pivot point. First featured in the August 2009 CANSLIM.net News (read here).
>>> The latest Featured Stock Update with an annotated graph appeared on 11/12/2009. click here.
|
|
C
A
S
I |
News |
Chart |
SEC
View all notes Alert
me of new notes
Company
Profile
|
BIDU
- NASDAQ
Baidu Inc Ads
INTERNET - Internet Information Providers
|
$441.50
|
+3.18
|
1,296,450
56% DAV
2,298,500
|
9/8/2009
(Date
Featured) |
$351.80
(Price
Featured) |
PP = $368.59 |
G |
| MB = $387.02 |
Most Recent Note - 11/17/2009 6:21:02 PM
G - Quiet volume today helped it rally to another new all-time high. Proved resilient near its 50 DMA line after its 10/27/09 gap down. As recently noted, "Choppy action has not allowed it to form a sound base in recent weeks." BIDU traded up as much as +23% from its price when featured in yellow in the 9/08/09 Mid-Day BreakOuts Report (read here).
>>> The latest Featured Stock Update with an annotated graph appeared on 11/10/2009. click here.
|
|
C
A
S
I |
News |
Chart |
SEC
View all notes Alert
me of new notes
Company
Profile
|
CACC
- NASDAQ
Credit Acceptance Corp
FINANCIAL SERVICES - Credit Services
|
$34.81
|
+0.06
|
19,842
55% DAV
36,100
|
9/29/2009
(Date
Featured) |
$33.48
(Price
Featured) |
PP = $32.60 |
G |
| MB = $34.23 |
Most Recent Note - 11/17/2009 6:21:32 PM
G - Continuing its consolidation in an orderly fashion above prior chart highs and its 50 DMA line in the $32 area coinciding as an important support level to watch on pullbacks. The Finance - Consumer/Commercial Loans firm has maintained a great track record of annual and quarterly sales revenues and earnings increases. It was featured on 9/29/09 in yellow in the mid-day report (read here).
>>> The latest Featured Stock Update with an annotated graph appeared on 11/16/2009. click here.
|
|
C
A
S
I |
News |
Chart |
SEC
View all notes Alert
me of new notes
Company
Profile
|
CRM
- NYSE
Salesforce.com Inc
INTERNET - Internet Software & Services
|
$65.61
|
-1.24
|
4,069,130
240% DAV
1,693,300
|
8/16/2009
(Date
Featured) |
$47.12
(Price
Featured) |
PP = $45.59 |
G |
| MB = $47.87 |
Most Recent Note - 11/17/2009 6:22:37 PM
G - Loss today on higher volume indicates distributional pressure. It is extended from any sound base. Found support and rallied up from its 50 DMA line last week after noted technical deterioration raised some concerns. Recent chart lows in the $56 area are important support now, and any violation would raise more serious concerns and trigger more worrisome technical sell signals.
>>> The latest Featured Stock Update with an annotated graph appeared on 11/9/2009. click here.
|
|
C
A
S
I |
News |
Chart |
SEC
View all notes Alert
me of new notes
Company
Profile
|
GMCR
- NASDAQ
Green Mtn Coffee Roastrs
FOOD & BEVERAGE - Processed & Packaged Goods
|
$68.80
|
-1.16
|
740,776
55% DAV
1,347,700
|
10/5/2009
(Date
Featured) |
$71.11
(Price
Featured) |
PP = $75.89 |
G |
| MB = $79.68 |
Most Recent Note - 11/17/2009 6:23:13 PM
G - Consolidating near its 50 DMA line. Holding its ground following a gap down on 11/12/09 after reporting strong quarterly results for the period ended Sept 30, 2009. As recently noted, "Its choppy action in recent weeks has not allowed for a sound new base to form." Deterioration under its recent lows near $65 would raise more serious concerns and trigger a worrisome technical sell signal.
>>> The latest Featured Stock Update with an annotated graph appeared on 11/11/2009. click here.
|
|
C
A
S
I |
News |
Chart |
SEC
View all notes Alert
me of new notes
Company
Profile
|
HEAT
-
|
$12.49
|
+1.50
|
2,029,850
375% DAV
541,900
|
11/17/2009
(Date
Featured) |
$12.00
(Price
Featured) |
PP = $12.61 |
Y |
| MB = $13.24 |
Most Recent Note - 11/17/2009 6:25:22 PM
Y - Closed below its pivot point, leaving a need for a more definitive buy signal after its gap up today for a second consecutive big gain on very heavy volume. It was featured in the mid-day report when technically rising from a "double bottom" base, reaching a new all-time high. It . On 9/18/09 it completed an additional share offering. There is limited history for this small Chinese firm in the Pollution Control - Equipment group, however its reported annual earnings (A criteria) history has been strong, and the 3 latest quarters show sales revenues and earnings increases well above the +25% guideline.
>>> The latest Featured Stock Update with an annotated graph appeared on 11/17/2009. click here.
|
|
C
A
S
I |
News |
Chart |
SEC
View all notes Alert
me of new notes
Company
Profile
|
LFT
-
|
$32.22
|
+1.78
|
1,114,402
280% DAV
398,700
|
11/17/2009
(Date
Featured) |
$31.77
(Price
Featured) |
PP = $33.04 |
Y |
| MB = $34.69 |
Most Recent Note - 11/17/2009 6:26:43 PM
Y - Gain today with above average volume cleared its October high and approached its August highs, ending at a new 2009 high close. It has formed a choppy 14-week base, and gains with volume above its pivot point (based on its 8/10/09 high) are still needed to confirm a proper technical breakout. Based on weak action LFT was previously dropped from the Featured Stocks list on 9/02/09, yet it has rebounded impressively and its fundamentals remain strong.
>>> The latest Featured Stock Update with an annotated graph appeared on 8/25/2009. click here.
|
|
C
A
S
I |
News |
Chart |
SEC
View all notes Alert
me of new notes
Company
Profile
|
|
|
|
THESE ARE NOT BUY RECOMMENDATIONS!
Comments contained in the body of this report are technical
opinions only. The material herein has been obtained
from sources believed to be reliable and accurate, however,
its accuracy and completeness cannot be guaranteed.
This site is not an investment advisor, hence it does
not endorse or recommend any securities or other investments.
Any recommendation contained in this report may not
be suitable for all investors and it is not to be deemed
an offer or solicitation on our part with respect to
the purchase or sale of any securities. All trademarks,
service marks and trade names appearing in this report
are the property of their respective owners, and are
likewise used for identification purposes only.
This report is a service available
only to active Paid Premium Members.
You may opt-out of receiving report notifications
at any time. Questions or comments may be submitted
by writing to Premium Membership Services 665 S.E. 10 Street, Suite 201 Deerfield Beach, FL 33441-5634 or by calling 1-800-965-8307
or 954-785-1121.
|
|
|


