You are not logged in.
This means you
CAN ONLY VIEW reports that were published prior to Friday, March 21, 2025.
You
MUST UPGRADE YOUR MEMBERSHIP if you want to see any current reports.
AFTER MARKET UPDATE - FRIDAY, NOVEMBER 16TH, 2012
Previous After Market Report Next After Market Report >>>
|
|
|
|
DOW |
+45.93 |
12,588.31 |
+0.37% |
|
Volume |
948,563,290 |
+22% |
|
Volume |
2,120,228,800 |
+7% |
|
NASDAQ |
+16.19 |
2,853.13 |
+0.57% |
|
Advancers |
2,281 |
72% |
|
Advancers |
1,448 |
57% |
|
S&P 500 |
+6.55 |
1,359.88 |
+0.48% |
|
Decliners |
800 |
25% |
|
Decliners |
999 |
39% |
|
Russell 2000 |
+6.80 |
776.28 |
+0.88% |
|
52 Wk Highs |
14 |
|
|
52 Wk Highs |
14 |
|
|
S&P 600 |
+3.30 |
437.45 |
+0.76% |
|
52 Wk Lows |
156 |
|
|
52 Wk Lows |
173 |
|
|
 |
Major Averages Posted Gains With Encouraging Volume Increases
Kenneth J. Gruneisen - Passed the CAN SLIM® Master's Exam
Despite Friday's gains, the major averages finished lower on the week as the Dow and Nasdaq both declined -1.8% while the S&P 500 lost -1.5%. The volume totals were reported higher on the NYSE and on the Nasdaq exchange versus the prior session's totals, an encouraging sign of better institutional buying demand behind Friday's gains. Advancers led decliners by nearly 3-1 on the NYSE and by 3-2 on the Nasdaq exchange. The total number of stocks hitting new 52-week lows still solidly outnumbered new 52-week highs on the NYSE and on the Nasdaq exchange, however. Leadership showed a modest improvement as there were 8 high-ranked companies from the CANSLIM.net Leaders List making new 52-week highs and appearing on the CANSLIM.net BreakOuts Page, up from the prior session total of 5 stocks. There were gains for 8 of the 11 high-ranked companies currently included on the Featured Stocks Page, a list that has been shrinking lately while the market environment has deteriorated.
Stocks recovered from an early decline to finish higher on Friday. The major averages ended the session in positive territory amid optimism surrounding the initial meeting between President Obama and Congressional leaders to discuss the fiscal cliff. The market had opened lower following data that showed industrial production unexpectedly fell -0.4% and capacity utilization declined to 77.8% in October.
Nine of 10 sectors were up on the session. Utilities were the best performing group with Duke Energy Corp (DUK +1.72%) on the rise. Telecom was the worst performing sector as Verizon Communications Inc (VZ -0.72%) declined. On the earnings front, Gap Inc (GPS +0.99%) rose after posting better-than-expected quarterly results and increasing its full year outlook. However, Dell Inc (DELL -7.22%) fell as the PC maker's profits fell short of expectations.
The 10-year note rose 1/16 to yield 1.58%.
Regular readers may note that this commentary first mentioned a "market correction" on October 11th, calling for reduced market exposure repeatedly if investors were not already completely in cash. During market corrections the M criteria argues against new buying efforts and urges investors to take a defensive stance to protect precious capital. That stance can change back to a bullish stance where buying is encouraged when at least one of the three major averages produces a solid follow-through day (FTD). A FTD confirming a new rally requires substantial gains on higher (ideally above average) volume, coupled with healthy leadership and a respectable number of stocks hitting new 52-week highs. Historic studies have shown that a FTD occurring between Days 4-7 of a new rally effort has often signaled the beginning of the most substantial market rallies.
Investors should always limit losses if ever any stock falls more than -7% from their purchase price. Following strict sell rules is precisely how this fact-based investment system prompts investors to reduce exposure and protect cash during market downturns. Keep a watchlist of strong acting stocks with all-key criteria in anticipation of the next confirmed uptrend. See the noteworthy candidates included on the Featured Stocks Page.
Watch for an announcement via email concerning the next WEBCAST. The webcast will also be available via an updated link highlighted at the top of the Premium Member Homepage.
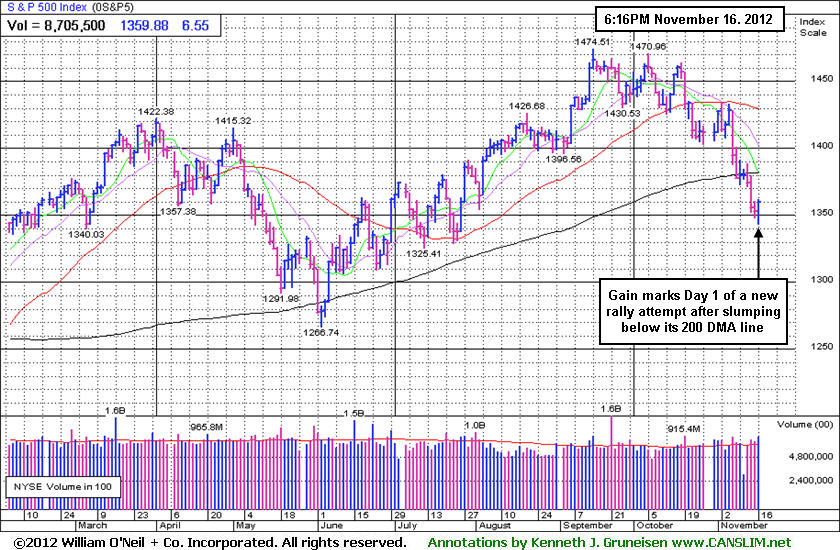
PICTURED: The S&P 500 Index's gain marks Day 1 of a new rally attempt after slumping below its 200-day moving average (DMA) line. Bargain hunting is never a part of the fact-based approach supported by CANSLIM.net. Until the major averages produce a new confirmed rally with a follow-through day, disciplined investors know that it is most important to be protecting cash.
|
 Kenneth J. Gruneisen started out as a licensed stockbroker in August 1987, a couple of months prior to the historic stock market crash that took the Dow Jones Industrial Average down -22.6% in a single day. He has published daily fact-based fundamental and technical analysis on high-ranked stocks online for two decades. Through FACTBASEDINVESTING.COM, Kenneth provides educational articles, news, market commentary, and other information regarding proven investment systems that work in good times and bad.
Comments contained in the body of this report are technical opinions only and are not necessarily those of Gruneisen Growth Corp. The material herein has been obtained from sources believed to be reliable and accurate, however, its accuracy and completeness cannot be guaranteed. Our firm, employees, and customers may effect transactions, including transactions contrary to any recommendation herein, or have positions in the securities mentioned herein or options with respect thereto. Any recommendation contained in this report may not be suitable for all investors and it is not to be deemed an offer or solicitation on our part with respect to the purchase or sale of any securities. |
|
 |
Biotech, Retail and Financial Groups Led Gainers
Kenneth J. Gruneisen - Passed the CAN SLIM® Master's Exam
The Retail Index ($RLX +0.85%) tallied a gain and modest improvements from the influential Broker/Dealer Index ($XBD +1.19%) and Bank Index ($BKX +0.64%) helped to underpin the major averages' gains on Friday. The Biotechnology Index ($BTK +2.09%) led the tech sector higher while the Internet Index ($IIX +0.44%) posted a modest gain, meanwhile the Semiconductor Index ($SOX -0.04%) finished flat and the Networking Index ($NWX -1.42%) lagged with a loss. The Gold & Silver Index ($XAU +0.80%) posted a modest gain. The Healthcare Index ($HMO +0.01%) ended unchanged. Energy-related shares were also quiet as the Integrated Oil Index ($XOI +0.07%) and Oil Services Index ($OSX +0.12%) finished flat.
Charts courtesy www.stockcharts.com
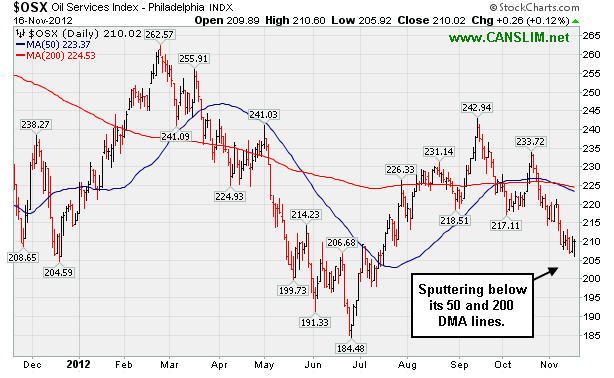
PICTURED: The Oil Services Index ($OSX +0.12%) is sputtering below its 50-day and 200-day moving average (DMA) lines.
| Oil Services |
$OSX |
210.02 |
+0.26 |
+0.12% |
-2.89% |
| Healthcare |
$HMO |
2,417.70 |
+0.18 |
+0.01% |
+5.96% |
| Integrated Oil |
$XOI |
1,172.19 |
+0.79 |
+0.07% |
-4.63% |
| Semiconductor |
$SOX |
356.00 |
-0.14 |
-0.04% |
-2.32% |
| Networking |
$NWX |
193.03 |
-2.78 |
-1.42% |
-10.28% |
| Internet |
$IIX |
302.71 |
+1.33 |
+0.44% |
+7.44% |
| Broker/Dealer |
$XBD |
81.08 |
+0.95 |
+1.19% |
-2.63% |
| Retail |
$RLX |
640.13 |
+5.41 |
+0.85% |
+25.20% |
| Gold & Silver |
$XAU |
165.67 |
+1.31 |
+0.80% |
-8.29% |
| Bank |
$BKX |
47.15 |
+0.30 |
+0.64% |
+19.73% |
| Biotech |
$BTK |
1,443.76 |
+29.60 |
+2.09% |
+32.28% |
|
|
|
 |
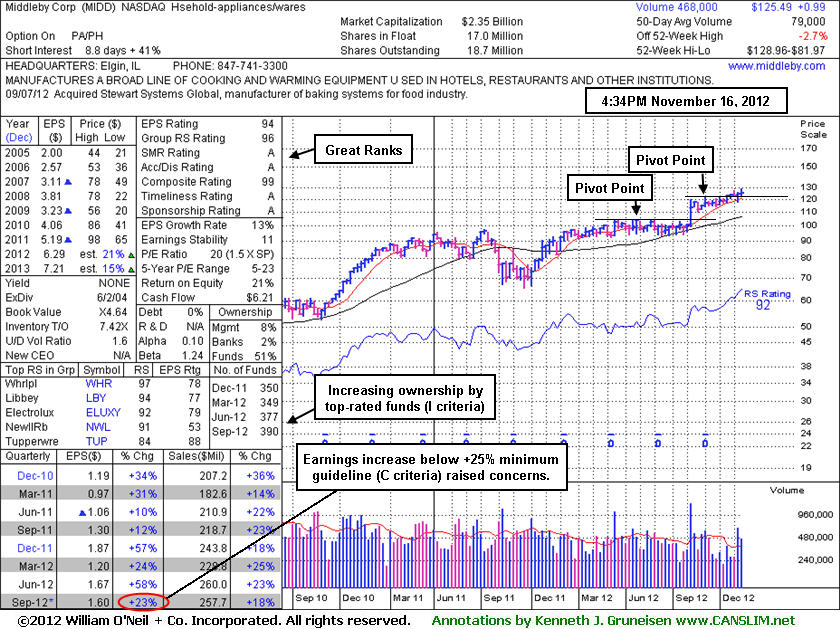
Appliance Maker Strong Despite Latest Quarter Below Minimum Guideline
Kenneth J. Gruneisen - Passed the CAN SLIM® Master's Exam
Middleby Corp (MIDD -$1.33 or -1.05% to $125.49) touched a new 52-week high today but reversed into the red at the close. Recently the high-ranked appliance maker reported earnings +23% on +18% sales for the Sep '12 quarter, below the +25% minimum earnings guideline (C criteria). Its last appearance in this FSU section was on 10/22/12 with an annotated graph under the headline, "Awaiting Technical Breakout Following New Base". Volume totals have been above average in recent weeks while it has made limited progress above its latest pivot point. When consolidating it stubbornly held its ground near its 50-day moving average (DMA) line.defining near-term chart support to watch.
Disciplined investors may watch closely for sell signals if holding it and giving it a chance to produce more climactic gains. The M criteria also remains an overriding concern that argues in favor of investors reducing exposure. Selective investors may sooner consider a fresh buy candidate without fundamental flaws once the M criteria improves with a follow -through day (FTD) confirming a new rally.
Prior quarterly comparisons showed stronger sales and earnings reasonably meeting the C criteria. Its annual earnings (A criteria) had a downturn in FY '09, yet they have otherwise been good and steady. The weekly graph below shows that the number of top-rated funds owning its shares rose from 350 in Dec '11 to 390 in Sep '12, a reassuring sign concerning the I criteria. Its current Up/Down Volume Ratio of 1.6 is an unbiased indication its shares have been under accumulation over the past 50 days. Its small supply (S criteria) of only 17.0 million shares can contribute to greater price volatility in the event of institutional buying or selling.
|
|
|
Color Codes Explained :
Y - Better candidates highlighted by our
staff of experts.
G - Previously featured
in past reports as yellow but may no longer be buyable under the
guidelines.
***Last / Change / Volume data in this table is the closing quote data***
Symbol/Exchange
Company Name
Industry Group |
PRICE |
CHANGE
(%Change) |
Day High |
Volume
(% DAV)
(% 50 day avg vol) |
52 Wk Hi
% From Hi |
Featured
Date |
Price
Featured |
Pivot Featured |
|
Max Buy |
CFNL
-
NASDAQ
Cardinal Financial Corp
BANKING - Regional - Southeast Banks
|
$15.17
|
-0.07
-0.46% |
$15.50
|
280,545
197.01% of 50 DAV
50 DAV is 142,400
|
$16.21
-6.42%
|
8/17/2012
|
$12.84
|
PP = $13.31
|
|
MB = $13.98
|
 Most Recent Note - 11/16/2012 2:04:47 PM
G - Rising today with higher volume. It has been repeatedly noted while extended from its prior base - "Prior high ($14.79 on 9/24/12) defines initial support to watch above its 50 DMA line. Disciplined investors may watch out for worrisome technical sell signals while awaiting a new base or secondary buy point and more favorable market."
>>> The latest Featured Stock Update with an annotated graph appeared on 10/25/2012. Click here.
View all notes |
Alert me of new notes |
CANSLIM.net Company Profile |
SEC |
Zacks Reports |
StockTalk |
News |
Chart |
Request a new note
C
A N
S L
I M


|
CMCSA
-
NASDAQ
Comcast Corp Cl A
MEDIA - CATV Systems
|
$35.45
|
+0.31
0.88% |
$35.57
|
15,955,467
125.25% of 50 DAV
50 DAV is 12,738,600
|
$37.96
-6.61%
|
6/11/2012
|
$29.94
|
PP = $30.98
|
|
MB = $32.53
|
Most Recent Note - 11/16/2012 12:06:22 PM
G - Losses this week violated its 50 DMA line raising concerns and triggering a technical sell signal. A rebound above that short-term average is needed for its outlook improve. Reported earnings +39% on +15% sales revenues for the Sep '12 quarter, a reassuring follow-up to the previously noted sub par quarter.
>>> The latest Featured Stock Update with an annotated graph appeared on 10/24/2012. Click here.
View all notes |
Alert me of new notes |
CANSLIM.net Company Profile |
SEC |
Zacks Reports |
StockTalk |
News |
Chart |
Request a new note
C
A N
S L
I M
|
DVA
-
NYSE
Davita Healthcare Prtns
HEALTH SERVICES - Specialized Health Services
|
$113.02
|
+0.13
0.12% |
$114.29
|
1,003,261
114.48% of 50 DAV
50 DAV is 876,400
|
$116.50
-2.99%
|
9/5/2012
|
$102.92
|
PP = $100.62
|
|
MB = $105.65
|
Most Recent Note - 11/16/2012 2:03:01 PM
G - Holding its ground only -2.4% off its 52-week high today, on track for a 9th consecutive weekly gain. Fundamental concerns were raised after it reported earnings +3% on +12% sales for the Sep '12 quarter, below the guidelines of the fact-based system.
>>> The latest Featured Stock Update with an annotated graph appeared on 11/8/2012. Click here.
View all notes |
Alert me of new notes |
CANSLIM.net Company Profile |
SEC |
Zacks Reports |
StockTalk |
News |
Chart |
Request a new note
C
A N
S L
I M
|
GPX
-
NYSE
G P Strategies Corp
DIVERSIFIED SERVICES - Education and Training Services
|
$20.40
|
-0.20
-0.97% |
$20.66
|
124,822
214.47% of 50 DAV
50 DAV is 58,200
|
$21.44
-4.85%
|
10/8/2012
|
$20.00
|
PP = $20.77
|
|
MB = $21.81
|
Most Recent Note - 11/16/2012 12:16:34 PM
G - Hovering near its 52-week high today. Earnings +0% on +12% sales revenues for the Sep '12 quarter, below the +25% minimum earnings guideline (C criteria) raised fundamental concerns. See the latest FSU analysis for more details and a new annotated graph.
>>> The latest Featured Stock Update with an annotated graph appeared on 11/15/2012. Click here.
View all notes |
Alert me of new notes |
CANSLIM.net Company Profile |
SEC |
Zacks Reports |
StockTalk |
News |
Chart |
Request a new note
C
A N
S L
I M
|
LKQ
-
NASDAQ
L K Q Corp
WHOLESALE - Auto Parts
|
$20.86
|
+0.22
1.07% |
$20.92
|
1,779,843
106.40% of 50 DAV
50 DAV is 1,672,800
|
$21.95
-4.97%
|
8/9/2012
|
$18.97
|
PP = $18.72
|
|
MB = $19.66
|
Most Recent Note - 11/14/2012 5:40:42 PM
G - Fell for a 6th consecutive small loss today. Results below the +25% minimum earnings guideline (C criteria) recently raised fundamental concerns. See the latest FSU analysis for more details and a new annotated graph.
>>> The latest Featured Stock Update with an annotated graph appeared on 11/14/2012. Click here.
View all notes |
Alert me of new notes |
CANSLIM.net Company Profile |
SEC |
Zacks Reports |
StockTalk |
News |
Chart |
Request a new note
C
A N
S L
I M
|
Symbol/Exchange
Company Name
Industry Group |
PRICE |
CHANGE
(%Change) |
Day High |
Volume
(% DAV)
(% 50 day avg vol) |
52 Wk Hi
% From Hi |
Featured
Date |
Price
Featured |
Pivot Featured |
|
Max Buy |
MIDD
-
NASDAQ
Middleby Corp
MANUFACTURING - Diversified Machinery
|
$125.49
|
-1.33
-1.05% |
$128.96
|
92,195
116.70% of 50 DAV
50 DAV is 79,000
|
$128.73
-2.52%
|
10/8/2012
|
$118.46
|
PP = $122.67
|
|
MB = $128.80
|
Most Recent Note - 11/15/2012 5:14:04 PM
Y - Traded up today with above average volume, touching a new 52-week high and finishing at its best-ever close. Reported earnings +23% on +18% sales for the Sep '12 quarter, below the +25% minimum earnings guideline (C criteria). The M criteria remains an overriding concern until a FTD confirms a new rally.
>>> The latest Featured Stock Update with an annotated graph appeared on 11/16/2012. Click here.
View all notes |
Alert me of new notes |
CANSLIM.net Company Profile |
SEC |
Zacks Reports |
StockTalk |
News |
Chart |
Request a new note
C
A N
S L
I M
|
RAX
-
NYSE
Rackspace Hosting Inc
INTERNET - Internet Software and; Services
|
$62.56
|
+1.71
2.81% |
$63.06
|
1,369,206
80.50% of 50 DAV
50 DAV is 1,700,900
|
$69.81
-10.39%
|
11/6/2012
|
$65.44
|
PP = $69.91
|
|
MB = $73.41
|
Most Recent Note - 11/16/2012 2:06:18 PM
G - Halted its slide this week but it remains well below its 50 DMA line. A rebound above that short-term average is needed for its technical stance to improve.
>>> The latest Featured Stock Update with an annotated graph appeared on 11/6/2012. Click here.
View all notes |
Alert me of new notes |
CANSLIM.net Company Profile |
SEC |
Zacks Reports |
StockTalk |
News |
Chart |
Request a new note
C
A N
S L
I M
|
RNF
-
NYSE
Rentech Nitrogen Ptnr Lp
CHEMICALS - Agricultural Chemicals
|
$35.74
|
+0.14
0.39% |
$35.99
|
565,662
139.91% of 50 DAV
50 DAV is 404,300
|
$41.15
-13.15%
|
11/1/2012
|
$39.11
|
PP = $40.15
|
|
MB = $42.16
|
Most Recent Note - 11/15/2012 12:19:03 PM
G - Slumped below its 50 DMA line today raising concerns, and its color code was changed to green. Only a prompt rebound above that important short-term average would help its outlook improve. Negative market (M criteria) and a worrisome "negative reversal" were recently noted as concerns.
>>> The latest Featured Stock Update with an annotated graph appeared on 11/2/2012. Click here.
View all notes |
Alert me of new notes |
CANSLIM.net Company Profile |
SEC |
Zacks Reports |
StockTalk |
News |
Chart |
Request a new note
C
A N
S L
I M
|
TDG
-
NYSE
Transdigm Group Inc
AEROSPACE/DEFENSE - Aerospace/Defense Products and; Services
|
$128.78
|
+3.13
2.49% |
$129.45
|
826,199
152.55% of 50 DAV
50 DAV is 541,600
|
$140.49
-8.34%
|
8/16/2012
|
$132.23
|
PP = $136.44
|
|
MB = $143.26
|
Most Recent Note - 11/16/2012 4:27:52 PM
Reported earnings +19% on +35% sales revenues for the Sep '12 quarter, below the +25% minimuim earning guideline (C criteria), raising concerns. Managed a positive reversal after testing its 200 DMA line, finishing -8.3% off its 52-week high today. Due to fundamental and technical weakness it will be dropped from the Featured Stocks list tonight.
>>> The latest Featured Stock Update with an annotated graph appeared on 10/23/2012. Click here.
View all notes |
Alert me of new notes |
CANSLIM.net Company Profile |
SEC |
Zacks Reports |
StockTalk |
News |
Chart |
Request a new note
C
A N
S L
I M
|
VSI
-
NYSE
Vitamin Shoppe Inc
SPECIALTY RETAIL - Specialty Retail, Other
|
$57.77
|
+0.35
0.61% |
$58.25
|
249,611
86.85% of 50 DAV
50 DAV is 287,400
|
$61.89
-6.66%
|
10/15/2012
|
$57.82
|
PP = $60.08
|
|
MB = $63.08
|
Most Recent Note - 11/15/2012 5:16:16 PM
G - Managed a positive reversal today, overcoming early weakness and posting a gain on higher volume while rallying back near its 50 DMA line. Completely negated its 11/06/12 breakout. It released better than expected earnings +35% on +14% sales revenues for the Sep '12 quarter.
>>> The latest Featured Stock Update with an annotated graph appeared on 11/12/2012. Click here.
View all notes |
Alert me of new notes |
CANSLIM.net Company Profile |
SEC |
Zacks Reports |
StockTalk |
News |
Chart |
Request a new note
C
A N
S L
I M
|
Symbol/Exchange
Company Name
Industry Group |
PRICE |
CHANGE
(%Change) |
Day High |
Volume
(% DAV)
(% 50 day avg vol) |
52 Wk Hi
% From Hi |
Featured
Date |
Price
Featured |
Pivot Featured |
|
Max Buy |
WPI
-
NYSE
Watson Pharmaceuticals
DRUGS - Drugs - Generic
|
$83.40
|
+0.68
0.82% |
$83.53
|
627,302
74.70% of 50 DAV
50 DAV is 839,800
|
$90.00
-7.33%
|
8/24/2012
|
$82.90
|
PP = $81.10
|
|
MB = $85.16
|
Most Recent Note - 11/15/2012 5:17:17 PM
G - Slumped further below its 50 DMA line today and finished -8.1% off its 52-week high. Reported earnings +24% on +19% sales revenues for the Sep '12 quarter, a notch below the +25% minimum guideline (C criteria).
>>> The latest Featured Stock Update with an annotated graph appeared on 11/1/2012. Click here.
View all notes |
Alert me of new notes |
CANSLIM.net Company Profile |
SEC |
Zacks Reports |
StockTalk |
News |
Chart |
Request a new note
C
A N
S L
I M
|
|
|
|
THESE ARE NOT BUY RECOMMENDATIONS!
Comments contained in the body of this report are technical
opinions only. The material herein has been obtained
from sources believed to be reliable and accurate, however,
its accuracy and completeness cannot be guaranteed.
This site is not an investment advisor, hence it does
not endorse or recommend any securities or other investments.
Any recommendation contained in this report may not
be suitable for all investors and it is not to be deemed
an offer or solicitation on our part with respect to
the purchase or sale of any securities. All trademarks,
service marks and trade names appearing in this report
are the property of their respective owners, and are
likewise used for identification purposes only.
This report is a service available
only to active Paid Premium Members.
You may opt-out of receiving report notifications
at any time. Questions or comments may be submitted
by writing to Premium Membership Services 665 S.E. 10 Street, Suite 201 Deerfield Beach, FL 33441-5634 or by calling 1-800-965-8307
or 954-785-1121.
|
|
|

