You are not logged in.
This means you
CAN ONLY VIEW reports that were published prior to Monday, April 14, 2025.
You
MUST UPGRADE YOUR MEMBERSHIP if you want to see any current reports.
AFTER MARKET UPDATE - THURSDAY, NOVEMBER 15TH, 2012
Previous After Market Report Next After Market Report >>>
|
|
|
|
DOW |
-28.57 |
12,542.38 |
-0.23% |
|
Volume |
779,371,550 |
-6% |
|
Volume |
1,973,749,330 |
-3% |
|
NASDAQ |
-9.87 |
2,836.94 |
-0.35% |
|
Advancers |
998 |
31% |
|
Advancers |
951 |
37% |
|
S&P 500 |
-2.17 |
1,353.32 |
-0.16% |
|
Decliners |
2,092 |
66% |
|
Decliners |
1,507 |
59% |
|
Russell 2000 |
-3.72 |
769.48 |
-0.48% |
|
52 Wk Highs |
12 |
|
|
52 Wk Highs |
12 |
|
|
S&P 600 |
-3.94 |
457.34 |
-0.85% |
|
52 Wk Lows |
266 |
|
|
52 Wk Lows |
184 |
|
|
 |
Weak Action With Market Lacking Leadership
Kenneth J. Gruneisen - Passed the CAN SLIM® Master's Exam
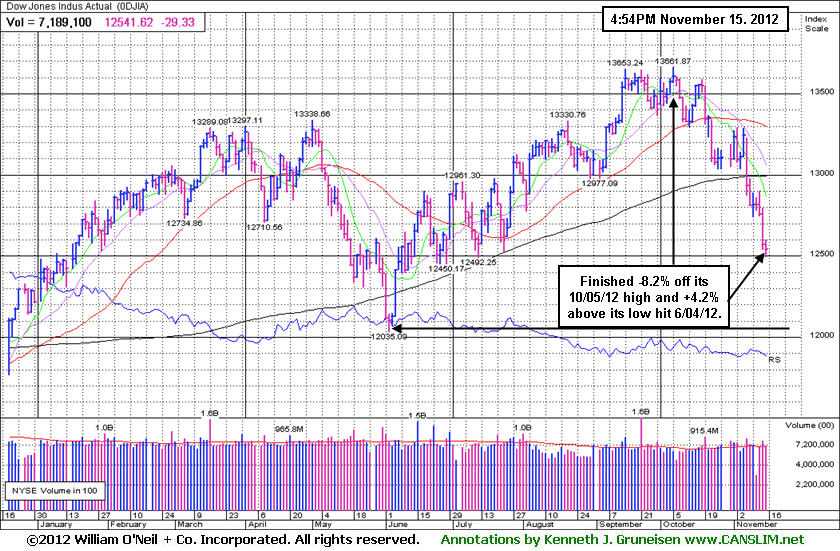
The lack of a bounce thus far proves just how weak the market remains as the major averages edge even further below their respective 200-day moving average (DMA) lines, continuing the previously noted market correction. The volume totals were reported slightly lower on the NYSE and on the Nasdaq exchange versus the prior session's totals. Decliners led advancers by more than 2-1 on the NYSE and by 3-2 on the Nasdaq exchange. The total number of stocks hitting new 52-week lows solidly outnumbered new 52-week highs on the NYSE and on the Nasdaq exchange. Leadership remained scant as there were only 5 high-ranked companies from the CANSLIM.net Leaders List making new 52-week highs and appearing on the CANSLIM.net BreakOuts Page, one up from the prior session total of 4 stocks. There were gains for 5 of the 13 high-ranked companies currently included on the Featured Stocks Page, a list that has been shrinking lately while the market environment has deteriorated.
Investors digested economic data and earnings reports, but they showed no appetite for buying stocks. On the employment front, jobless claims widely missed consensus estimates, increasing by 78,000 last week to 439,000. In a separate report, the consumer price index grew in October at the slowest pace in three months as the gauge rose +0.1% after a +0.6% gain in September. Regional reports were also in focus as Empire Manufacturing contracted for a fourth-straight month in November and the Philadelphia Fed Index displayed contraction to minus 10.7 in November after October's positive reading of 5.7. European data also garnered attention after economic growth in Germany and France failed to prevent the euro zone from entering its second recession in four years.
The tail end of third-quarter earnings season was also in the spotlight. Wal-Mart Stores Inc (WMT -3.63%) posted a higher quarterly profit, but its full-year forecast trailed some estimates and its shares fell. Fellow retailer Target Corp (TGT +1.73%) gained after it topped earnings expectations and the company handed in a holiday shopping outlook above street projections. Notable profit tallies were also scheduled for release after the close, including Dell Inc (DELL -0.21%), Gap Inc (GPS -1.10%), Sears Holdings Corp (SHLD +0.10%) and Dole Food Company Inc (DOLE -4.52%).
Regular readers may note that this commentary first mentioned a "market correction" on October 11th, calling for reduced market exposure repeatedly if investors were not already completely in cash. During market corrections the M criteria argues against new buying efforts and urges investors to take a defensive stance to protect precious capital. That stance can change back to a bullish stance where buying is encouraged when at least one of the three major averages produces a solid follow-through day (FTD). A FTD confirming a new rally requires substantial gains on higher (ideally above average) volume, coupled with healthy leadership and a respectable number of stocks hitting new 52-week highs. Historic studies have shown that a FTD occurring between Days 4-7 of a new rally effort has often signaled the beginning of the most substantial market rallies.
Investors should always limit losses if ever any stock falls more than -7% from their purchase price. Following strict sell rules is precisely how this fact-based investment system prompts investors to reduce exposure and protect cash during market downturns. Keep a watchlist of strong acting stocks with all-key criteria in anticipation of the next confirmed uptrend. See the noteworthy candidates included on the Featured Stocks Page.
Watch for an announcement via email concerning the next WEBCAST. The webcast will also be available via an updated link highlighted at the top of the Premium Member Homepage.
PICTURED: The Dow Jones Industrial Average slumped further below its 200-day moving average (DMA) line as the index finished -8.2 off its 2012 high hit on 10/05/12. It finished just +4.2% above its 6/04/12 low. Bargain hunting is never a part of the fact-based approach supported by CANSLIM.net. Until the major averages produce a new confirmed rally with a follow-through day, disciplined investors know that it is most important to be protecting cash.
|
 Kenneth J. Gruneisen started out as a licensed stockbroker in August 1987, a couple of months prior to the historic stock market crash that took the Dow Jones Industrial Average down -22.6% in a single day. He has published daily fact-based fundamental and technical analysis on high-ranked stocks online for two decades. Through FACTBASEDINVESTING.COM, Kenneth provides educational articles, news, market commentary, and other information regarding proven investment systems that work in good times and bad.
Comments contained in the body of this report are technical opinions only and are not necessarily those of Gruneisen Growth Corp. The material herein has been obtained from sources believed to be reliable and accurate, however, its accuracy and completeness cannot be guaranteed. Our firm, employees, and customers may effect transactions, including transactions contrary to any recommendation herein, or have positions in the securities mentioned herein or options with respect thereto. Any recommendation contained in this report may not be suitable for all investors and it is not to be deemed an offer or solicitation on our part with respect to the purchase or sale of any securities. |
|
 |
Tech, Retail, and Gold & Silver Indexes Fell
Kenneth J. Gruneisen - Passed the CAN SLIM® Master's Exam
The tech sector saw unanimous losses from the Semiconductor Index ($SOX -1.33%), Networking Index ($NWX -1.10%), and the Biotechnology Index ($BTK -1.06%) while the Internet Index ($IIX -0.01%) finished flat. A loss from the Retail Index ($RLX -0.90%) also weighed on the major averages while the Bank Index ($BKX +0.36%) and Broker/Dealer Index ($XBD +0.57%) struggled to post small gains. The Gold & Silver Index ($XAU -2.45%) continued to punish defensively positined investors while the Healthcare Index ($HMO +0.71%) tallied a modest gain. The Oil Services Index ($OSX +1.31%) was a standout gainer while the Integrated Oil Index ($XOI -0.10%) finished virtually unchanged.
Charts courtesy www.stockcharts.com
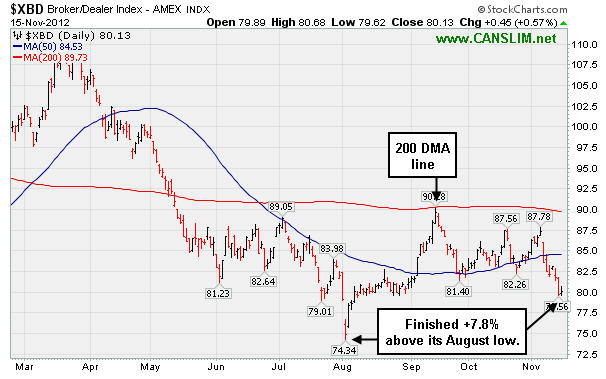
PICTURED: The Broker/Dealer Index ($XBD +0.57%) finished +7.8% above its August low. At its high point since then it ran into resistance at its 200-day moving average (DMA) line.
| Oil Services |
$OSX |
209.76 |
+2.72 |
+1.31% |
-3.01% |
| Healthcare |
$HMO |
2,417.52 |
+16.95 |
+0.71% |
+5.96% |
| Integrated Oil |
$XOI |
1,171.40 |
-1.12 |
-0.10% |
-4.69% |
| Semiconductor |
$SOX |
356.14 |
-4.80 |
-1.33% |
-2.28% |
| Networking |
$NWX |
195.81 |
-2.19 |
-1.10% |
-8.99% |
| Internet |
$IIX |
301.37 |
-0.04 |
-0.01% |
+6.97% |
| Broker/Dealer |
$XBD |
80.13 |
+0.45 |
+0.57% |
-3.77% |
| Retail |
$RLX |
650.90 |
-5.89 |
-0.90% |
+24.41% |
| Gold & Silver |
$XAU |
164.36 |
-4.13 |
-2.45% |
-9.01% |
| Bank |
$BKX |
46.85 |
+0.17 |
+0.36% |
+18.97% |
| Biotech |
$BTK |
1,414.16 |
-15.09 |
-1.06% |
+29.57% |
|
|
|
 |
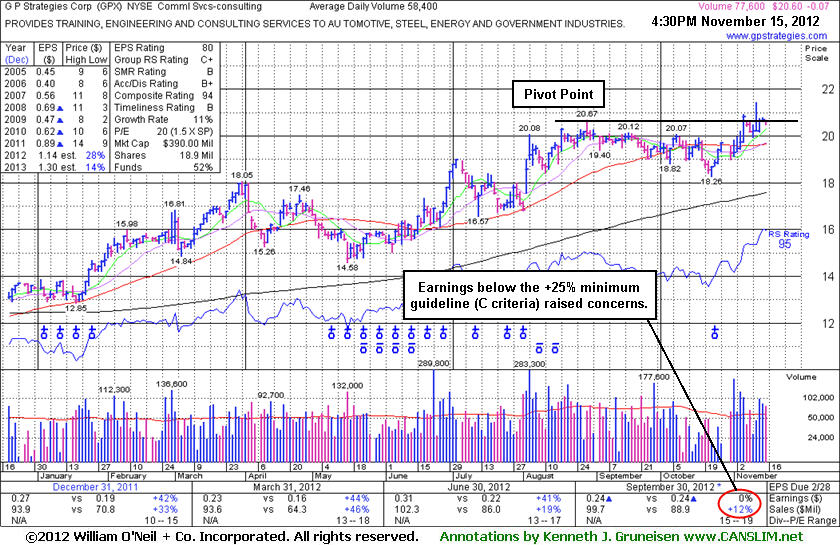
Strong Despite Earnings Below +25% Guideline Raising Concerns
Kenneth J. Gruneisen - Passed the CAN SLIM® Master's Exam
G P Strategies Corp (GPX -$0.07 or -0.34% to $20.60) has been holding its ground but failing to make meaningful headway above previously stubborn resistance in the $20 area. Recently it reported earnings +0% on +12% sales revenues for the Sep '12 quarter, below the +25% minimum earnings guideline, raising fundamental concerns with its first quarter in a long while below the +25% minimum earnings guideline (C criteria). Subsequent gains helped it to recently rise above the pivot point shown in its last appearance in this FSU section on 10/16/12 with an annotated graph under the headline, "No Technical Breakout Occurred After Latest Pivot Point Cited". However, disciplined investors may note its fundamental flaw coupled with a poor market backdrop (M criteria) makes a strong fact-based argument against any new buying efforts.
A downturn in FY '09 earnings was previously noted as a flaw concerning the A criteria, and its mediocre Group Relative Strength Rating was another concern noted with respect to the L criteria. Investors' odd are usually most favorable when choosing a stock with robust leadership in the same industry group. The number of top-rated funds owning its shares rose from 158 in Mar '12 to 171 in Sep '12, a slightly reassuring trend concerning the I criteria. Its current Up/Down Volume Ratio of 1.6 hints that its shares have been under accumulation during the past 50 days. Company management reportedly owns 25% of its shares, which keeps the directors keenly focused on building and maintaining shareholder value. Its small supply (S criteria) of 14.2 million shares in the public float is a favorable characteristic that was found in most of the market's greatest winners, however that can contribute to greater price volatility in the event of institutional buying or selling. Disciplined investors always limit losses if any stock falls more than -7% from their purchase price.
It made limited headway after the stock was long ago highlighted in yellow in the 6/29/12 mid-day report (read here) and noted - "It cleared a valid base earlier this week with volume-driven gains and no overhead supply remains. Quarterly earnings increases above the +25% guideline in the 8 latest quarterly comparisons through Dec '11 satisfy the C criteria. Recent cluster of Insider buying in May-Jun looks similar to that which was reported in Nov, Dec, and Jan as it rose toward and above prior resistance in the $14 area."
|
|
|
Color Codes Explained :
Y - Better candidates highlighted by our
staff of experts.
G - Previously featured
in past reports as yellow but may no longer be buyable under the
guidelines.
***Last / Change / Volume data in this table is the closing quote data***
Symbol/Exchange
Company Name
Industry Group |
PRICE |
CHANGE
(%Change) |
Day High |
Volume
(% DAV)
(% 50 day avg vol) |
52 Wk Hi
% From Hi |
Featured
Date |
Price
Featured |
Pivot Featured |
|
Max Buy |
CFNL
-
NASDAQ
Cardinal Financial Corp
BANKING - Regional - Southeast Banks
|
$15.24
|
-0.08
-0.52% |
$15.46
|
109,370
77.24% of 50 DAV
50 DAV is 141,600
|
$16.21
-5.98%
|
8/17/2012
|
$12.84
|
PP = $13.31
|
|
MB = $13.98
|
Most Recent Note - 11/13/2012 12:16:24 PM
G - Consolidating after getting extended from its prior base. Prior high ($14.79 on 9/24/12) defines initial support to watch above its 50 DMA line. Disciplined investors may watch out for worrisome technical sell signals while awaiting a new base or secondary buy point and more favorable market.
>>> The latest Featured Stock Update with an annotated graph appeared on 10/25/2012. Click here.
View all notes |
Alert me of new notes |
CANSLIM.net Company Profile |
SEC |
Zacks Reports |
StockTalk |
News |
Chart |
Request a new note
C
A N
S L
I M


|
CMCSA
-
NASDAQ
Comcast Corp Cl A
MEDIA - CATV Systems
|
$35.14
|
-0.26
-0.73% |
$35.70
|
11,606,159
91.08% of 50 DAV
50 DAV is 12,743,400
|
$37.96
-7.43%
|
6/11/2012
|
$29.94
|
PP = $30.98
|
|
MB = $32.53
|
Most Recent Note - 11/14/2012 4:57:24 PM
G - Loss today on near average volume violated its 50 DMA line raising concerns and triggering a technical sell signal. Only a prompt rebound above that short-term average would help its outlook improve. Reported earnings +39% on +15% sales revenues for the Sep '12 quarter, a reassuring follow-up to the previously noted sub par quarter.
>>> The latest Featured Stock Update with an annotated graph appeared on 10/24/2012. Click here.
View all notes |
Alert me of new notes |
CANSLIM.net Company Profile |
SEC |
Zacks Reports |
StockTalk |
News |
Chart |
Request a new note
C
A N
S L
I M
|
DVA
-
NYSE
Davita Healthcare Prtns
HEALTH SERVICES - Specialized Health Services
|
$112.89
|
+0.84
0.75% |
$113.10
|
782,328
89.53% of 50 DAV
50 DAV is 873,800
|
$116.50
-3.10%
|
9/5/2012
|
$102.92
|
PP = $100.62
|
|
MB = $105.65
|
Most Recent Note - 11/12/2012 4:03:21 PM
G - Holding its ground -3.2% off its 52-week high today. Fundamental concerns were raised after it reported earnings +3% on +12% sales for the Sep '12 quarter, below the guidelines of the fact-based system.
>>> The latest Featured Stock Update with an annotated graph appeared on 11/8/2012. Click here.
View all notes |
Alert me of new notes |
CANSLIM.net Company Profile |
SEC |
Zacks Reports |
StockTalk |
News |
Chart |
Request a new note
C
A N
S L
I M
|
GPX
-
NYSE
G P Strategies Corp
DIVERSIFIED SERVICES - Education and Training Services
|
$20.60
|
-0.07
-0.34% |
$20.67
|
78,295
134.07% of 50 DAV
50 DAV is 58,400
|
$21.44
-3.92%
|
10/8/2012
|
$20.00
|
PP = $20.77
|
|
MB = $21.81
|
 Most Recent Note - 11/15/2012 5:10:50 PM
G - Earnings +0% on +12% sales revenues for the Sep '12 quarter, below the +25% minimum earnings guideline (C criteria) raised fundamental concerns. See the latest FSU analysis for more details and a new annotated graph.
>>> The latest Featured Stock Update with an annotated graph appeared on 11/15/2012. Click here.
View all notes |
Alert me of new notes |
CANSLIM.net Company Profile |
SEC |
Zacks Reports |
StockTalk |
News |
Chart |
Request a new note
C
A N
S L
I M
|
LKQ
-
NASDAQ
L K Q Corp
WHOLESALE - Auto Parts
|
$20.64
|
+0.27
1.32% |
$20.72
|
2,199,060
133.09% of 50 DAV
50 DAV is 1,652,300
|
$21.95
-5.97%
|
8/9/2012
|
$18.97
|
PP = $18.72
|
|
MB = $19.66
|
Most Recent Note - 11/14/2012 5:40:42 PM
G - Fell for a 6th consecutive small loss today. Results below the +25% minimum earnings guideline (C criteria) recently raised fundamental concerns. See the latest FSU analysis for more details and a new annotated graph.
>>> The latest Featured Stock Update with an annotated graph appeared on 11/14/2012. Click here.
View all notes |
Alert me of new notes |
CANSLIM.net Company Profile |
SEC |
Zacks Reports |
StockTalk |
News |
Chart |
Request a new note
C
A N
S L
I M
|
Symbol/Exchange
Company Name
Industry Group |
PRICE |
CHANGE
(%Change) |
Day High |
Volume
(% DAV)
(% 50 day avg vol) |
52 Wk Hi
% From Hi |
Featured
Date |
Price
Featured |
Pivot Featured |
|
Max Buy |
MIDD
-
NASDAQ
Middleby Corp
MANUFACTURING - Diversified Machinery
|
$126.82
|
+2.31
1.86% |
$128.73
|
215,156
277.98% of 50 DAV
50 DAV is 77,400
|
$127.89
-0.84%
|
10/8/2012
|
$118.46
|
PP = $122.67
|
|
MB = $128.80
|
Most Recent Note - 11/15/2012 5:14:04 PM
Y - Traded up today with above average volume, touching a new 52-week high and finishing at its best-ever close. Reported earnings +23% on +18% sales for the Sep '12 quarter, below the +25% minimum earnings guideline (C criteria). The M criteria remains an overriding concern until a FTD confirms a new rally.
>>> The latest Featured Stock Update with an annotated graph appeared on 10/22/2012. Click here.
View all notes |
Alert me of new notes |
CANSLIM.net Company Profile |
SEC |
Zacks Reports |
StockTalk |
News |
Chart |
Request a new note
C
A N
S L
I M
|
N
-
NYSE
Netsuite Inc
DIVERSIFIED SERVICES - Business/Management Services
|
$57.46
|
-0.61
-1.05% |
$58.72
|
695,039
134.80% of 50 DAV
50 DAV is 515,600
|
$67.02
-14.26%
|
8/20/2012
|
$55.88
|
PP = $59.32
|
|
MB = $62.29
|
Most Recent Note - 11/15/2012 5:18:53 PM
Based on weak action it will be dropped from the Featured Stocks list tonight. Slumped further below its 50 DMA line today on higher volume, finishing -14.3% off its 52-week high. Reported earnings +60% on +31% sales revenues for the Sep '12 quarter.
>>> The latest Featured Stock Update with an annotated graph appeared on 10/26/2012. Click here.
View all notes |
Alert me of new notes |
CANSLIM.net Company Profile |
SEC |
Zacks Reports |
StockTalk |
News |
Chart |
Request a new note
C
A N
S L
I M
|
OSIS
-
NASDAQ
O S I Systems Inc
ELECTRONICS - Semiconductor Equipment and Mate
|
$54.89
|
-21.40
-28.05% |
$75.26
|
4,880,045
4,460.74% of 50 DAV
50 DAV is 109,400
|
$81.23
-32.43%
|
9/5/2012
|
$74.39
|
PP = $75.10
|
|
MB = $78.86
|
Most Recent Note - 11/15/2012 5:21:10 PM
Gapped down today then quickly suffered damaging losses with very heavy volume triggering technical sell signals and undercutting its 200 DMA line. Disciplined investors always limit losses if any stock fall -7% or more from their purchase price. Based on poor technical action it will be dropped from the Featured Stocks list tonight.
>>> The latest Featured Stock Update with an annotated graph appeared on 11/13/2012. Click here.
View all notes |
Alert me of new notes |
CANSLIM.net Company Profile |
SEC |
Zacks Reports |
StockTalk |
News |
Chart |
Request a new note
C
A N
S L
I M
|
RAX
-
NYSE
Rackspace Hosting Inc
INTERNET - Internet Software and; Services
|
$60.85
|
+0.33
0.55% |
$61.49
|
1,121,628
64.74% of 50 DAV
50 DAV is 1,732,500
|
$69.81
-12.83%
|
11/6/2012
|
$65.44
|
PP = $69.91
|
|
MB = $73.41
|
Most Recent Note - 11/14/2012 4:26:49 PM
G - Slumped further below its 50 DMA line today. A rebound above that short-term average is needed for its technical stance to improve.
>>> The latest Featured Stock Update with an annotated graph appeared on 11/6/2012. Click here.
View all notes |
Alert me of new notes |
CANSLIM.net Company Profile |
SEC |
Zacks Reports |
StockTalk |
News |
Chart |
Request a new note
C
A N
S L
I M
|
RNF
-
NYSE
Rentech Nitrogen Ptnr Lp
CHEMICALS - Agricultural Chemicals
|
$35.60
|
-1.77
-4.74% |
$37.51
|
997,940
253.22% of 50 DAV
50 DAV is 394,100
|
$41.15
-13.49%
|
11/1/2012
|
$39.11
|
PP = $40.15
|
|
MB = $42.16
|
Most Recent Note - 11/15/2012 12:19:03 PM
G - Slumped below its 50 DMA line today raising concerns, and its color code was changed to green. Only a prompt rebound above that important short-term average would help its outlook improve. Negative market (M criteria) and a worrisome "negative reversal" were recently noted as concerns.
>>> The latest Featured Stock Update with an annotated graph appeared on 11/2/2012. Click here.
View all notes |
Alert me of new notes |
CANSLIM.net Company Profile |
SEC |
Zacks Reports |
StockTalk |
News |
Chart |
Request a new note
C
A N
S L
I M
|
Symbol/Exchange
Company Name
Industry Group |
PRICE |
CHANGE
(%Change) |
Day High |
Volume
(% DAV)
(% 50 day avg vol) |
52 Wk Hi
% From Hi |
Featured
Date |
Price
Featured |
Pivot Featured |
|
Max Buy |
TDG
-
NYSE
Transdigm Group Inc
AEROSPACE/DEFENSE - Aerospace/Defense Products and; Services
|
$125.65
|
-5.74
-4.37% |
$128.89
|
2,152,817
426.55% of 50 DAV
50 DAV is 504,700
|
$140.49
-10.56%
|
8/16/2012
|
$132.23
|
PP = $136.44
|
|
MB = $143.26
|
Most Recent Note - 11/15/2012 12:26:08 PM
G - Up from earlier lows after a damaging gap down and large loss with heavy volume. Its 50 DMA line violation and weak finish which triggered a technical sell signal on the prior session. Its 200 DMA line ($117.14) defines the next chart support level.
>>> The latest Featured Stock Update with an annotated graph appeared on 10/23/2012. Click here.
View all notes |
Alert me of new notes |
CANSLIM.net Company Profile |
SEC |
Zacks Reports |
StockTalk |
News |
Chart |
Request a new note
C
A N
S L
I M
|
VSI
-
NYSE
Vitamin Shoppe Inc
SPECIALTY RETAIL - Specialty Retail, Other
|
$57.42
|
+0.90
1.59% |
$57.46
|
473,235
163.75% of 50 DAV
50 DAV is 289,000
|
$61.89
-7.22%
|
10/15/2012
|
$57.82
|
PP = $60.08
|
|
MB = $63.08
|
Most Recent Note - 11/15/2012 5:16:16 PM
G - Managed a positive reversal today, overcoming early weakness and posting a gain on higher volume while rallying back near its 50 DMA line. Completely negated its 11/06/12 breakout. It released better than expected earnings +35% on +14% sales revenues for the Sep '12 quarter.
>>> The latest Featured Stock Update with an annotated graph appeared on 11/12/2012. Click here.
View all notes |
Alert me of new notes |
CANSLIM.net Company Profile |
SEC |
Zacks Reports |
StockTalk |
News |
Chart |
Request a new note
C
A N
S L
I M
|
WPI
-
NYSE
Watson Pharmaceuticals
DRUGS - Drugs - Generic
|
$82.72
|
-0.29
-0.35% |
$83.60
|
1,122,097
133.52% of 50 DAV
50 DAV is 840,400
|
$90.00
-8.09%
|
8/24/2012
|
$82.90
|
PP = $81.10
|
|
MB = $85.16
|
Most Recent Note - 11/15/2012 5:17:17 PM
G - Slumped further below its 50 DMA line today and finished -8.1% off its 52-week high. Reported earnings +24% on +19% sales revenues for the Sep '12 quarter, a notch below the +25% minimum guideline (C criteria).
>>> The latest Featured Stock Update with an annotated graph appeared on 11/1/2012. Click here.
View all notes |
Alert me of new notes |
CANSLIM.net Company Profile |
SEC |
Zacks Reports |
StockTalk |
News |
Chart |
Request a new note
C
A N
S L
I M
|
|
|
|
THESE ARE NOT BUY RECOMMENDATIONS!
Comments contained in the body of this report are technical
opinions only. The material herein has been obtained
from sources believed to be reliable and accurate, however,
its accuracy and completeness cannot be guaranteed.
This site is not an investment advisor, hence it does
not endorse or recommend any securities or other investments.
Any recommendation contained in this report may not
be suitable for all investors and it is not to be deemed
an offer or solicitation on our part with respect to
the purchase or sale of any securities. All trademarks,
service marks and trade names appearing in this report
are the property of their respective owners, and are
likewise used for identification purposes only.
This report is a service available
only to active Paid Premium Members.
You may opt-out of receiving report notifications
at any time. Questions or comments may be submitted
by writing to Premium Membership Services 665 S.E. 10 Street, Suite 201 Deerfield Beach, FL 33441-5634 or by calling 1-800-965-8307
or 954-785-1121.
|
|
|

