***Last / Change / Volume data in this table is the closing quote data***
Symbol/Exchange
Company Name
Industry Group |
PRICE |
CHANGE
(%Change) |
Day High |
Volume
(% DAV)
(% 50 day avg vol) |
52 Wk Hi
% From Hi |
Featured
Date |
Price
Featured |
Pivot Featured |
|
Max Buy |
ABV
-
NYSE
Comp De Bebidas Adr
FOOD and BEVERAGE - Beverages - Brewers
|
$139.12
|
+2.00
1.46% |
$140.26
|
410,921
63.02% of 50 DAV
50 DAV is 652,000
|
$145.36
-4.29%
|
11/4/2010
|
$142.35
|
PP = $143.63
|
|
MB = $150.81
|
 Most Recent Note - 11/15/2010 4:35:07 PM
Y - Small gap up gain today with light volume. Disciplined investors may consider any new high close above its pivot point with heavy volume to be a new (or add-on) buy signal. Recent low ($133.38 on 10/27/10) defines support above its 50 DMA line.
>>> The latest Featured Stock Update with an annotated graph appeared on 10/11/2010. Click here.
View all notes |
Alert me of new notes |
CANSLIM.net Company Profile |
SEC |
Zacks Reports |
StockTalk |
News |
Chart |
Request a new note
C
A N
S L
I M


|
ARUN
-
NASDAQ
Aruba Networks Inc
COMPUTER HARDWARE - Networking andamp; Communication Dev
|
$21.59
|
-1.13
-4.97% |
$23.16
|
2,885,209
119.57% of 50 DAV
50 DAV is 2,412,900
|
$23.85
-9.48%
|
8/30/2010
|
$18.12
|
PP = $18.51
|
|
MB = $19.44
|
Most Recent Note - 11/15/2010 4:23:12 PM
G - Closed near the session low today with a considerable loss with slightly above average volume indicative of distributional pressure. Its 50 DMA line defines important near-term support to watch. Earnings news is due on Wednesday, November 17, 2010 for its latest quarter ended October 31, 2010.
>>> The latest Featured Stock Update with an annotated graph appeared on 10/26/2010. Click here.
View all notes |
Alert me of new notes |
CANSLIM.net Company Profile |
SEC |
Zacks Reports |
StockTalk |
News |
Chart |
Request a new note
C
A N
S L
I M
|
BIDU
-
NASDAQ
Baidu Inc Ads
INTERNET - Internet Information Providers
|
$108.80
|
-1.84
-1.66% |
$111.05
|
6,215,839
53.17% of 50 DAV
50 DAV is 11,691,100
|
$115.04
-5.42%
|
9/17/2010
|
$85.73
|
PP = $88.42
|
|
MB = $92.84
|
Most Recent Note - 11/12/2010 3:46:20 PM
G - Erased the prior session's gain with volume above average. It may produce more climactic gains, however it is extended from a sound base pattern now and a riskier "late stage" candidate. BIDU is up 11-fold from when it was first featured in yellow on October 30, 2006 (read here). Following a deep correction and Bear Market, it has been a fixture on the Featured Stocks page and rallied +212% in the 14 months since returning to prominence September 8, 2009 (read here).
>>> The latest Featured Stock Update with an annotated graph appeared on 10/7/2010. Click here.
View all notes |
Alert me of new notes |
CANSLIM.net Company Profile |
SEC |
Zacks Reports |
StockTalk |
News |
Chart |
Request a new note
C
A N
S L
I M
|
CACC
-
NASDAQ
Credit Acceptance Corp
FINANCIAL SERVICES - Credit Services
|
$57.39
|
-1.65
-2.79% |
$59.41
|
49,016
195.28% of 50 DAV
50 DAV is 25,100
|
$63.45
-9.55%
|
11/3/2010
|
$59.86
|
PP = $63.55
|
|
MB = $66.73
|
Most Recent Note - 11/15/2010 4:27:30 PM
G - Slumped well below its 50 DMA line with a 7th consecutive loss today with above average volume. Color code is changed to green based on its deterioration, meanwhile its $55.07 low (on 10/04/10) defines the nearest chart support level to watch above its long ago chart highs ($53.97).
>>> The latest Featured Stock Update with an annotated graph appeared on 10/29/2010. Click here.
View all notes |
Alert me of new notes |
CANSLIM.net Company Profile |
SEC |
Zacks Reports |
StockTalk |
News |
Chart |
Request a new note
C
A N
S L
I M
|
CMG
-
NYSE
Chipotle Mexican Grill
LEISURE - Restaurants
|
$230.37
|
-3.65
-1.56% |
$239.88
|
704,926
87.38% of 50 DAV
50 DAV is 806,700
|
$240.78
-4.32%
|
9/1/2010
|
$158.31
|
PP = $155.52
|
|
MB = $163.30
|
Most Recent Note - 11/15/2010 4:43:30 PM
G - Consolidating near all-time highs, stubbornly holding its ground after recent volume-driven gains. It may produce more climactic gains, however it is very extended from any sound base pattern. Its 50 DMA line (now $187) defines the nearest chart support level.
>>> The latest Featured Stock Update with an annotated graph appeared on 10/28/2010. Click here.
View all notes |
Alert me of new notes |
CANSLIM.net Company Profile |
SEC |
Zacks Reports |
StockTalk |
News |
Chart |
Request a new note
C
A N
S L
I M
|
Symbol/Exchange
Company Name
Industry Group |
PRICE |
CHANGE
(%Change) |
Day High |
Volume
(% DAV)
(% 50 day avg vol) |
52 Wk Hi
% From Hi |
Featured
Date |
Price
Featured |
Pivot Featured |
|
Max Buy |
CTRP
-
NASDAQ
Ctrip.Com Intl Ltd Adr
LEISURE - Resorts and Casinos
|
$46.31
|
-1.62
-3.38% |
$47.90
|
3,124,093
157.18% of 50 DAV
50 DAV is 1,987,600
|
$53.16
-12.89%
|
9/24/2010
|
$46.75
|
PP = $47.11
|
|
MB = $49.47
|
Most Recent Note - 11/15/2010 10:10:26 AM
G - Slumping below its 50 DMA line again today, raising concerns while trading near recent chart lows in the $45 area. More damaging losses on above average volume would not bode well, while a strong finish would be an encouraging sign of support.
>>> The latest Featured Stock Update with an annotated graph appeared on 9/28/2010. Click here.
View all notes |
Alert me of new notes |
CANSLIM.net Company Profile |
SEC |
Zacks Reports |
StockTalk |
News |
Chart |
Request a new note
C
A N
S L
I M
|
DECK
-
NASDAQ
Deckers Outdoor Corp
CONSUMER NON-DURABLES - Textile - Apparel Footwear
|
$60.92
|
+0.30
0.49% |
$61.93
|
763,283
63.99% of 50 DAV
50 DAV is 1,192,900
|
$63.55
-4.14%
|
10/27/2010
|
$54.16
|
PP = $54.86
|
|
MB = $57.60
|
Most Recent Note - 11/12/2010 4:50:25 PM
G - Extended from its latest sound base, consolidating well above prior highs in the $54-56 area defining important chart support to watch.
>>> The latest Featured Stock Update with an annotated graph appeared on 10/27/2010. Click here.
View all notes |
Alert me of new notes |
CANSLIM.net Company Profile |
SEC |
Zacks Reports |
StockTalk |
News |
Chart |
Request a new note
C
A N
S L
I M
|
EBIX
-
NASDAQ
Ebix Inc
COMPUTER SOFTWARE and SERVICES - Business Software and Services
|
$21.55
|
-0.17
-0.78% |
$21.92
|
1,476,241
200.33% of 50 DAV
50 DAV is 736,900
|
$28.21
-23.61%
|
9/23/2010
|
$21.78
|
PP = $22.74
|
|
MB = $23.88
|
Most Recent Note - 11/15/2010 10:18:05 AM
G - Slumping further today after Friday's violation of its 50 DMA line and prior chart lows on 3 times average volume after a gap down triggered technical sell signals. Prior resistance in the $20 defines the next support level to watch.
>>> The latest Featured Stock Update with an annotated graph appeared on 9/24/2010. Click here.
View all notes |
Alert me of new notes |
CANSLIM.net Company Profile |
SEC |
Zacks Reports |
StockTalk |
News |
Chart |
Request a new note
C
A N
S L
I M
|
EZPW
-
NASDAQ
Ezcorp Inc Cl A
SPECIALTY RETAIL - Specialty Retail, Other
|
$25.19
|
+0.00
0.00% |
$25.33
|
322,165
108.11% of 50 DAV
50 DAV is 298,000
|
$25.65
-1.79%
|
11/5/2010
|
$24.02
|
PP = $23.85
|
|
MB = $25.04
|
Most Recent Note - 11/12/2010 5:35:40 PM
G - Hovering at its all-time high, stubbornly holding its ground after a streak of gains with above average volume. Technically, it broke out from a 6-month cup shaped base without a proper handle last week.
>>> The latest Featured Stock Update with an annotated graph appeared on 11/6/2010. Click here.
View all notes |
Alert me of new notes |
CANSLIM.net Company Profile |
SEC |
Zacks Reports |
StockTalk |
News |
Chart |
Request a new note
C
A N
S L
I M
|
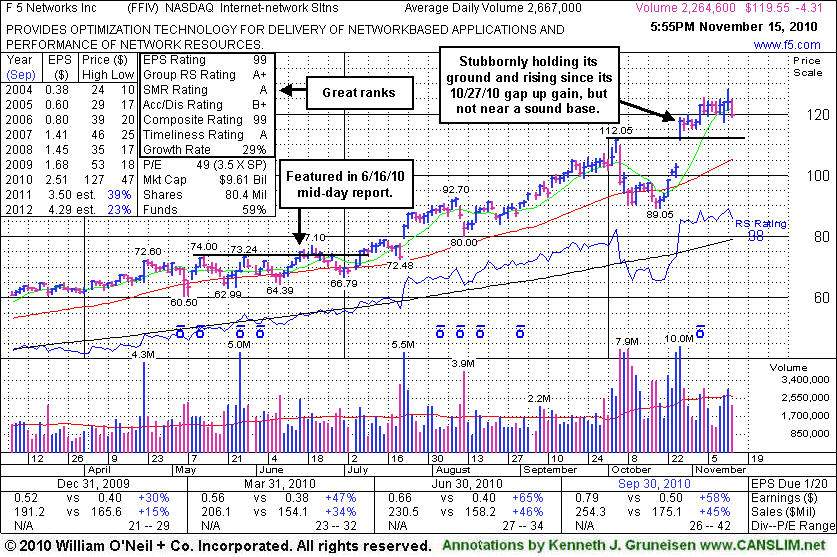
FFIV
-
NASDAQ
F 5 Networks Inc
INTERNET - Internet Software and Services
|
$119.55
|
-4.31
-3.48% |
$124.49
|
2,265,188
85.82% of 50 DAV
50 DAV is 2,639,600
|
$127.95
-6.57%
|
6/16/2010
|
$74.50
|
PP = $74.10
|
|
MB = $77.81
|
Most Recent Note - 11/15/2010 4:24:50 PM
G - Hovering near all-time highs, extended from a sound base pattern. Prior highs in the $112 area define initial chart support.
>>> The latest Featured Stock Update with an annotated graph appeared on 11/15/2010. Click here.
View all notes |
Alert me of new notes |
CANSLIM.net Company Profile |
SEC |
Zacks Reports |
StockTalk |
News |
Chart |
Request a new note
C
A N
S L
I M
|
Symbol/Exchange
Company Name
Industry Group |
PRICE |
CHANGE
(%Change) |
Day High |
Volume
(% DAV)
(% 50 day avg vol) |
52 Wk Hi
% From Hi |
Featured
Date |
Price
Featured |
Pivot Featured |
|
Max Buy |
FOSL
-
NASDAQ
Fossil Inc
CONSUMER DURABLES - Recreational Goods, Other
|
$67.99
|
+0.25
0.37% |
$69.08
|
824,143
106.53% of 50 DAV
50 DAV is 773,600
|
$70.07
-2.97%
|
10/20/2010
|
$54.12
|
PP = $55.61
|
|
MB = $58.39
|
Most Recent Note - 11/12/2010 4:52:47 PM
G - Holding its ground stubbornly after volume-driven gains, extended from any sound base. This high-ranked leader from the Retail/Wholesale Jewelry group reported very strong sales revenues and earnings increases for the quarter ended September 30, 2010 versus the year ago period, and its sales revenues increases have shown impressive acceleration in sequential quarterly comparisons.
>>> The latest Featured Stock Update with an annotated graph appeared on 10/5/2010. Click here.
View all notes |
Alert me of new notes |
CANSLIM.net Company Profile |
SEC |
Zacks Reports |
StockTalk |
News |
Chart |
Request a new note
C
A N
S L
I M
|
HMSY
-
NASDAQ
H M S Holdings Corp
COMPUTER SOFTWARE and SERVICES - Healthcare Information Service
|
$61.09
|
-0.01
-0.02% |
$61.96
|
282,882
132.68% of 50 DAV
50 DAV is 213,200
|
$62.91
-2.89%
|
9/27/2010
|
$57.97
|
PP = $58.36
|
|
MB = $61.28
|
Most Recent Note - 11/15/2010 1:22:18 PM
Y - Perched less than -3% off its 52-week high with no resistance remaining due to overhead supply. Prompt support showed up near its 50 DMA line while trading was volatile near its latest earnings report. Any subsequent violation of its 50 DMA could raise greater concerns.
>>> The latest Featured Stock Update with an annotated graph appeared on 9/27/2010. Click here.
View all notes |
Alert me of new notes |
CANSLIM.net Company Profile |
SEC |
Zacks Reports |
StockTalk |
News |
Chart |
Request a new note
C
A N
S L
I M
|
HS
-
NYSE
Healthspring Inc
HEALTH SERVICES - Health Care Plans
|
$27.21
|
-0.62
-2.23% |
$28.02
|
455,856
62.42% of 50 DAV
50 DAV is 730,300
|
$29.80
-8.69%
|
8/27/2010
|
$19.91
|
PP = $19.75
|
|
MB = $20.74
|
Most Recent Note - 11/15/2010 4:33:24 PM
G - Finished near the session low today -8.7% off its 52-week high, and volume totals have recently been cooling while consolidating above its 50 DMA line which acted as support.
>>> The latest Featured Stock Update with an annotated graph appeared on 10/22/2010. Click here.
View all notes |
Alert me of new notes |
CANSLIM.net Company Profile |
SEC |
Zacks Reports |
StockTalk |
News |
Chart |
Request a new note
C
A N
S L
I M
|
IGTE
-
NASDAQ
Igate Corp
COMPUTER SOFTWARE and SERVICES - Information Technology Service
|
$22.65
|
+0.32
1.44% |
$22.90
|
604,525
88.17% of 50 DAV
50 DAV is 685,600
|
$22.73
-0.34%
|
10/26/2010
|
$17.29
|
PP = $19.55
|
|
MB = $20.53
|
Most Recent Note - 11/15/2010 4:37:00 PM
G - A small gain on below average volume today ended 5 cents off its best ever close. Extended from its latest base, its prior chart highs in the $19 area define initial chart support above its 50 DMA line.
>>> The latest Featured Stock Update with an annotated graph appeared on 11/11/2010. Click here.
View all notes |
Alert me of new notes |
CANSLIM.net Company Profile |
SEC |
Zacks Reports |
StockTalk |
News |
Chart |
Request a new note
C
A N
S L
I M
|
JOBS
-
NASDAQ
Fifty One Job Inc Ads
DIVERSIFIED SERVICES - Staffing and; Outsourcing Service
|
$46.90
|
-0.17
-0.36% |
$47.97
|
354,472
167.60% of 50 DAV
50 DAV is 211,500
|
$51.75
-9.37%
|
10/13/2010
|
$42.07
|
PP = $40.60
|
|
MB = $42.63
|
Most Recent Note - 11/15/2010 10:14:14 AM
G - Slumping again today amid broad-based weakness in many China-related names, violating previously noted initial support defined buy an upward trendline connecting its September-November lows. Its 50 DMA line is the next important support to watch.
>>> The latest Featured Stock Update with an annotated graph appeared on 9/16/2010. Click here.
View all notes |
Alert me of new notes |
CANSLIM.net Company Profile |
SEC |
Zacks Reports |
StockTalk |
News |
Chart |
Request a new note
C
A N
S L
I M
|
Symbol/Exchange
Company Name
Industry Group |
PRICE |
CHANGE
(%Change) |
Day High |
Volume
(% DAV)
(% 50 day avg vol) |
52 Wk Hi
% From Hi |
Featured
Date |
Price
Featured |
Pivot Featured |
|
Max Buy |
LFT
-
NYSE
Longtop Financl Tech Ads
COMPUTER SOFTWARE and SERVICES - Business Software and Services
|
$39.49
|
-1.55
-3.78% |
$41.01
|
1,263,429
248.95% of 50 DAV
50 DAV is 507,500
|
$42.86
-7.86%
|
11/5/2010
|
$41.83
|
PP = $40.96
|
|
MB = $43.01
|
Most Recent Note - 11/15/2010 10:06:26 AM
G - Violated prior highs in the $40-41 area and slumped quickly below its 50 DMA line today, raising concerns. Color code is changed to green, and only a prompt rebound above the $40 would help its outlook.
>>> The latest Featured Stock Update with an annotated graph appeared on 10/14/2010. Click here.
View all notes |
Alert me of new notes |
CANSLIM.net Company Profile |
SEC |
Zacks Reports |
StockTalk |
News |
Chart |
Request a new note
C
A N
S L
I M
|
LULU
-
NASDAQ
Lululemon Athletica
MANUFACTURING - Textile Manufacturing
|
$46.70
|
-0.72
-1.52% |
$47.86
|
632,797
53.28% of 50 DAV
50 DAV is 1,187,600
|
$49.75
-6.13%
|
10/8/2010
|
$47.66
|
PP = $46.67
|
|
MB = $49.00
|
Most Recent Note - 11/12/2010 4:18:18 PM
Y - Consolidating in a healthy fashion with volume totals cooling after considerable gains with above average volume. Its 50 DMA line is an initial support level above recent lows in the $42 area.
>>> The latest Featured Stock Update with an annotated graph appeared on 10/8/2010. Click here.
View all notes |
Alert me of new notes |
CANSLIM.net Company Profile |
SEC |
Zacks Reports |
StockTalk |
News |
Chart |
Request a new note
C
A N
S L
I M
|
MWIV
-
NASDAQ
M W I Veterinary Supply
HEALTH SERVICES - Medical Instruments and; Supplies
|
$58.88
|
+0.09
0.15% |
$59.89
|
17,518
31.01% of 50 DAV
50 DAV is 56,500
|
$63.94
-7.91%
|
11/4/2010
|
$61.79
|
PP = $59.60
|
|
MB = $62.58
|
Most Recent Note - 11/15/2010 4:47:02 PM
Y - Small gain today with light volume following a pullback below its pivot point with losses on light volume late last week. Its 50 DMA line has been repeatedly noted as a very important support level.
>>> The latest Featured Stock Update with an annotated graph appeared on 11/2/2010. Click here.
View all notes |
Alert me of new notes |
CANSLIM.net Company Profile |
SEC |
Zacks Reports |
StockTalk |
News |
Chart |
Request a new note
C
A N
S L
I M
|
NEM
-
NYSE
Newmont Mining Corp
METALS and MINING - Gold
|
$60.66
|
-0.89
-1.45% |
$61.98
|
4,904,737
71.70% of 50 DAV
50 DAV is 6,841,100
|
$65.50
-7.39%
|
8/31/2010
|
$61.32
|
PP = $63.48
|
|
MB = $66.65
|
Most Recent Note - 11/12/2010 4:21:33 PM
G - Gapped down today and closed below its 50 DMA line, yet it remains only -6% off its 52-week high. Distributional action has raised concerns, meanwhile its Relative Strength rank has also slumped to 67, below the 80+ guideline. Recent lows in the $57 area define near-term support above its 200 DMA line.
>>> The latest Featured Stock Update with an annotated graph appeared on 11/10/2010. Click here.
View all notes |
Alert me of new notes |
CANSLIM.net Company Profile |
SEC |
Zacks Reports |
StockTalk |
News |
Chart |
Request a new note
C
A N
S L
I M
|
NEOG
-
NASDAQ
Neogen Corp
DRUGS - Diagnostic Substances
|
$36.12
|
+0.17
0.47% |
$36.84
|
30,492
30.83% of 50 DAV
50 DAV is 98,900
|
$36.90
-2.11%
|
9/1/2010
|
$30.79
|
PP = $30.49
|
|
MB = $32.01
|
Most Recent Note - 11/15/2010 4:41:20 PM
G - Hovering near all-time highs today with light volume. Investors had recent opportunity to accumulate shares per the investment system guidelines for a "secondary buy point" noted since 11/02/10. Its 50 DMA line defines support to watch.
>>> The latest Featured Stock Update with an annotated graph appeared on 10/13/2010. Click here.
View all notes |
Alert me of new notes |
CANSLIM.net Company Profile |
SEC |
Zacks Reports |
StockTalk |
News |
Chart |
Request a new note
C
A N
S L
I M
|
Symbol/Exchange
Company Name
Industry Group |
PRICE |
CHANGE
(%Change) |
Day High |
Volume
(% DAV)
(% 50 day avg vol) |
52 Wk Hi
% From Hi |
Featured
Date |
Price
Featured |
Pivot Featured |
|
Max Buy |
NFLX
-
NASDAQ
Netflix Inc
SPECIALTY RETAIL - Music and Video Stores
|
$168.30
|
-4.70
-2.72% |
$173.12
|
4,567,304
81.17% of 50 DAV
50 DAV is 5,627,100
|
$184.74
-8.90%
|
11/9/2010
|
$173.10
|
PP = $184.84
|
|
MB = $194.08
|
Most Recent Note - 11/15/2010 4:29:22 PM
Y - Consolidating near all-time highs, stubbornly holding its ground. It has formed an advanced "ascending base" type pattern marked by 3 pullbacks in the 10-20% range since its earlier technical breakout (on 8/10/10) from a double bottom base. Color code was changed to yellow with new pivot point cited based on its 52-week high plus ten cents. A subsequent breakout with heavy volume would signal a new (or add-on) technical buy signal, however it is a riskier "late stage" set-up.
>>> The latest Featured Stock Update with an annotated graph appeared on 10/1/2010. Click here.
View all notes |
Alert me of new notes |
CANSLIM.net Company Profile |
SEC |
Zacks Reports |
StockTalk |
News |
Chart |
Request a new note
C
A N
S L
I M
|
NTAP
-
NASDAQ
Netapp Inc
COMPUTER HARDWARE - Data Storage Devices
|
$53.93
|
-0.18
-0.33% |
$54.89
|
4,922,836
68.98% of 50 DAV
50 DAV is 7,137,000
|
$57.96
-6.95%
|
9/8/2010
|
$46.98
|
PP = $44.99
|
|
MB = $47.24
|
Most Recent Note - 11/12/2010 4:13:37 PM
G - Down on average volume today, consolidating above its 50 DMA line and prior highs that define important chart support to watch. It is extended from any sound base.
>>> The latest Featured Stock Update with an annotated graph appeared on 11/3/2010. Click here.
View all notes |
Alert me of new notes |
CANSLIM.net Company Profile |
SEC |
Zacks Reports |
StockTalk |
News |
Chart |
Request a new note
C
A N
S L
I M
|
ORCL
-
NASDAQ
Oracle Corp
COMPUTER SOFTWARE and SERVICES - Application Software
|
$28.40
|
+0.08
0.28% |
$28.77
|
21,634,457
52.63% of 50 DAV
50 DAV is 41,102,900
|
$29.82
-4.76%
|
9/20/2010
|
$27.32
|
PP = $26.73
|
|
MB = $28.07
|
Most Recent Note - 11/12/2010 5:42:27 PM
Y - Perched -5% off its 52-week high after 6 consecutive losses. Volume totals have been cooling in recent weeks. Prior highs and its 50 DMA line define important chart support in the $27 area. Color code is changed to yellow as it may be considered buyable after finding support at its 10-week average up to +5% above its latest high ($29.82) as a valid secondary buy point. A new pivot point is not cited because it has not formed a sound new base pattern.
>>> The latest Featured Stock Update with an annotated graph appeared on 9/20/2010. Click here.
View all notes |
Alert me of new notes |
CANSLIM.net Company Profile |
SEC |
Zacks Reports |
StockTalk |
News |
Chart |
Request a new note
C
A N
S L
I M
|
PAY
-
NYSE
Verifone Systems Inc
COMPUTER HARDWARE - Transaction Automation Systems
|
$32.64
|
+0.08
0.25% |
$33.40
|
611,178
46.84% of 50 DAV
50 DAV is 1,304,700
|
$35.94
-9.18%
|
8/25/2010
|
$24.30
|
PP = $23.74
|
|
MB = $24.93
|
Most Recent Note - 11/12/2010 4:02:10 PM
G - Consolidating above prior highs ($31.40) and its 50 DMA line with volume totals cooling. It has the look of an advanced "ascending base" pattern after an impressive rally from its 7/26/10 breakout.
>>> The latest Featured Stock Update with an annotated graph appeared on 10/25/2010. Click here.
View all notes |
Alert me of new notes |
CANSLIM.net Company Profile |
SEC |
Zacks Reports |
StockTalk |
News |
Chart |
Request a new note
C
A N
S L
I M
|
RAX
-
NYSE
Rackspace Hosting Inc
INTERNET - Internet Software and; Services
|
$27.05
|
-0.84
-3.01% |
$27.76
|
1,573,536
58.24% of 50 DAV
50 DAV is 2,701,800
|
$29.35
-7.84%
|
9/21/2010
|
$22.84
|
PP = $23.61
|
|
MB = $24.79
|
Most Recent Note - 11/15/2010 9:54:06 AM
G - Gapped down today, slumping toward prior highs near $26 that define initial chart support above its 50 DMA line. This high-ranked Internet - Network Solutions firm is -8% from last week's all-time highs.
>>> The latest Featured Stock Update with an annotated graph appeared on 9/21/2010. Click here.
View all notes |
Alert me of new notes |
CANSLIM.net Company Profile |
SEC |
Zacks Reports |
StockTalk |
News |
Chart |
Request a new note
C
A N
S L
I M
|
Symbol/Exchange
Company Name
Industry Group |
PRICE |
CHANGE
(%Change) |
Day High |
Volume
(% DAV)
(% 50 day avg vol) |
52 Wk Hi
% From Hi |
Featured
Date |
Price
Featured |
Pivot Featured |
|
Max Buy |
ROVI
-
NASDAQ
Rovi Corp
COMPUTER SOFTWARE andamp; SERVICES - Security Software andamp; Services
|
$52.51
|
+0.29
0.56% |
$53.13
|
824,930
51.80% of 50 DAV
50 DAV is 1,592,600
|
$53.61
-2.05%
|
10/29/2010
|
$49.99
|
PP = $53.10
|
|
MB = $55.76
|
Most Recent Note - 11/15/2010 4:39:33 PM
Y - Holding its ground stubbornly, today it closed 62 cents off its best close of 2010. Volume totals have recently been drying up, a sign that only a few small investors are exiting. Disciplined investors will watch for subsequent gains above its pivot point with volume conviction that would trigger a new (or add-on) technical buy signal, and always limit losses if a stock falls more than -7% from the purchase price, per the system guidelines. Initial support to watch is defined by its 50 DMA line, then its prior chart low, where violations would trigger technical sell signals.
>>> The latest Featured Stock Update with an annotated graph appeared on 10/20/2010. Click here.
View all notes |
Alert me of new notes |
CANSLIM.net Company Profile |
SEC |
Zacks Reports |
StockTalk |
News |
Chart |
Request a new note
C
A N
S L
I M
|
SHOO
-
NASDAQ
Steven Madden Limited
CONSUMER NON-DURABLES - Textile - Apparel Footwear
|
$41.39
|
+0.39
0.95% |
$42.50
|
366,377
105.92% of 50 DAV
50 DAV is 345,900
|
$44.85
-7.71%
|
9/15/2010
|
$38.94
|
PP = $40.27
|
|
MB = $42.28
|
Most Recent Note - 11/15/2010 4:48:43 PM
G - Still finding support just above its 50 DMA line and prior chart highs in the $40 area. More damaging losses leading to a close below its short-term average would raise concerns and trigger technical sell signals.
>>> The latest Featured Stock Update with an annotated graph appeared on 9/29/2010. Click here.
View all notes |
Alert me of new notes |
CANSLIM.net Company Profile |
SEC |
Zacks Reports |
StockTalk |
News |
Chart |
Request a new note
C
A N
S L
I M
|
SLW
-
NYSE
Silver Wheaton Corp
METALS and; MINING - Silver
|
$32.99
|
-0.80
-2.37% |
$34.73
|
9,796,638
115.81% of 50 DAV
50 DAV is 8,459,200
|
$37.20
-11.32%
|
8/25/2010
|
$21.40
|
PP = $21.99
|
|
MB = $23.09
|
Most Recent Note - 11/15/2010 4:30:37 PM
G - Very extended from any sound base, it has been sputtering since its worrisome "negative reversal" on 11/09/10. Its 50 DMA line and prior highs in the $28 area define the nearest chart support.
>>> The latest Featured Stock Update with an annotated graph appeared on 10/18/2010. Click here.
View all notes |
Alert me of new notes |
CANSLIM.net Company Profile |
SEC |
Zacks Reports |
StockTalk |
News |
Chart |
Request a new note
C
A N
S L
I M
|
UA
-
NYSE
Under Armour Inc Cl A
CONSUMER NON-DURABLES - Textile - Apparel Clothing
|
$49.69
|
-0.86
-1.70% |
$51.93
|
449,909
58.26% of 50 DAV
50 DAV is 772,300
|
$52.30
-4.99%
|
9/9/2010
|
$39.99
|
PP = $40.10
|
|
MB = $42.11
|
Most Recent Note - 11/12/2010 4:09:45 PM
G - Extended from any sound base and support at its 50 DMA line. It has not encountered any distributional pressure and could produce more climactic gains. Some fundamental flaws with respect to the fact-based investment system have been recently noted as concerns.
>>> The latest Featured Stock Update with an annotated graph appeared on 11/4/2010. Click here.
View all notes |
Alert me of new notes |
CANSLIM.net Company Profile |
SEC |
Zacks Reports |
StockTalk |
News |
Chart |
Request a new note
C
A N
S L
I M
|
ULTA
-
NASDAQ
Ulta Salon Cosm & Frag
SPECIALTY RETAIL - Specialty Retail, Other
|
$31.80
|
-0.18
-0.56% |
$32.74
|
159,661
27.91% of 50 DAV
50 DAV is 572,100
|
$33.50
-5.07%
|
9/3/2010
|
$26.36
|
PP = $25.89
|
|
MB = $27.18
|
Most Recent Note - 11/15/2010 4:50:38 PM
G - Volume totals have been continually drying up since its big gain on 10/12/10. It is within close striking distance of its 52-week highs and its all-time high of $35.63 in Nov '07. Its 50 DMA line defines initial support to watch above prior chart highs in the $26 area. It could produce more climactic gains, however it is currently extended from any sound base.
>>> The latest Featured Stock Update with an annotated graph appeared on 11/1/2010. Click here.
View all notes |
Alert me of new notes |
CANSLIM.net Company Profile |
SEC |
Zacks Reports |
StockTalk |
News |
Chart |
Request a new note
C
A N
S L
I M
|
Symbol/Exchange
Company Name
Industry Group |
PRICE |
CHANGE
(%Change) |
Day High |
Volume
(% DAV)
(% 50 day avg vol) |
52 Wk Hi
% From Hi |
Featured
Date |
Price
Featured |
Pivot Featured |
|
Max Buy |
VIT
-
NYSE
Vanceinfo Tech Inc Ads
COMPUTER SOFTWARE and SERVICES - Business Software and Services
|
$35.14
|
-0.22
-0.62% |
$36.26
|
705,158
118.32% of 50 DAV
50 DAV is 596,000
|
$38.43
-8.56%
|
7/8/2010
|
$25.20
|
PP = $26.58
|
|
MB = $27.91
|
Most Recent Note - 11/12/2010 3:54:18 PM
G - It could produce more climactic gains, meanwhile, its 50 DMA line defines important chart support to watch. VIT endured distributional pressure this week after it had been repeatedly noted - "Extended from any sound base pattern."
>>> The latest Featured Stock Update with an annotated graph appeared on 10/21/2010. Click here.
View all notes |
Alert me of new notes |
CANSLIM.net Company Profile |
SEC |
Zacks Reports |
StockTalk |
News |
Chart |
Request a new note
C
A N
S L
I M
|