You are not logged in.
This means you
CAN ONLY VIEW reports that were published prior to Monday, April 14, 2025.
You
MUST UPGRADE YOUR MEMBERSHIP if you want to see any current reports.
AFTER MARKET UPDATE - TUESDAY, NOVEMBER 13TH, 2012
Previous After Market Report Next After Market Report >>>
|
|
|
|
DOW |
-58.90 |
12,756.18 |
-0.46% |
|
Volume |
676,281,220 |
+132% |
|
Volume |
1,735,044,960 |
+30% |
|
NASDAQ |
-20.37 |
2,883.89 |
-0.70% |
|
Advancers |
979 |
31% |
|
Advancers |
805 |
31% |
|
S&P 500 |
-5.50 |
1,374.53 |
-0.40% |
|
Decliners |
2,080 |
66% |
|
Decliners |
1,668 |
65% |
|
Russell 2000 |
-4.75 |
789.01 |
-0.60% |
|
52 Wk Highs |
36 |
|
|
52 Wk Highs |
20 |
|
|
S&P 600 |
-3.94 |
457.34 |
-0.85% |
|
52 Wk Lows |
118 |
|
|
52 Wk Lows |
131 |
|
|
 |
Major Averages Lack Leadership Necessary to Rally
Kenneth J. Gruneisen - Passed the CAN SLIM® Master's Exam
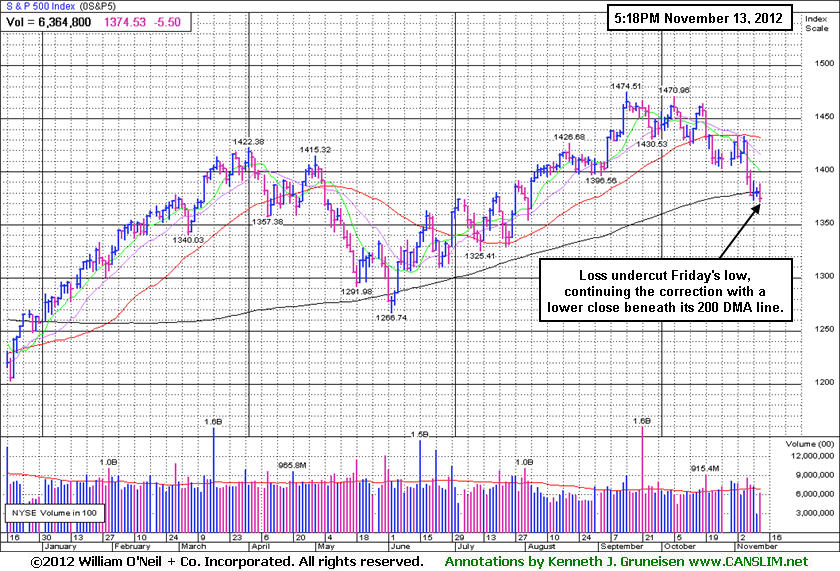
Tuesday's losses sent the S&P 500 Index and the Nasdaq Composite Index to new correction lows while the Dow Jones Industrial Average avoided undercutting its Friday low after dipping within 6 points of doing so. The volume totals were reported higher on the NYSE and on the Nasdaq exchange versus the prior session's totals, a sign of greater distributional pressure still coming from the institutional crowd. Decliners led advancers by more than 2-1 on the NYSE and on the Nasdaq exchange. The total number of stocks hitting new 52-week lows outnumbered new 52-week highs on the NYSE and on the Nasdaq exchange. There were 10 high-ranked companies from the CANSLIM.net Leaders List making new 52-week highs and appearing on the CANSLIM.net BreakOuts Page, down from the prior session total of 19 stocks. There were gains for 6 of the 14 high-ranked companies currently included on the Featured Stocks Page, a list that has been shrinking lately while the market environment has deteriorated.
The NFIB's small business optimism index advanced to a five-month high in October. That and encouraging retailer profit tallies were overshadowed by lingering debt concerns both here and abroad, however, which dragged markets lower. The political wrangling in Washington over the fiscal cliff continued to put a damper on investor sentiment. Meanwhile in Europe, lawmakers gave Greece two more years to lower its deficit, but failed to agree on how the country will repay its debt. Greece's finance minister said he expects a deal to be reached on rescue funding at next week's meeting.
Overall, the majority of sectors were lower. Technology was the worst performing group, led lower by Microsoft Corp (MSFT -3.22%) . Financials also paced the late retreat as JP Morgan Chase Co (JPM -1.33%) and Citigroup Inc (C -0.71%) lost ground. However, the defensive utility stocks gained ground as Duke Energy Corp (DUK +0.91%) edged higher. Consumer discretionary shares were also a bright spot thanks to Home Depot Inc (HD +3.63%) which topped earnings expectations and upped its full-year guidance, helping its shares touch the highest level since 2000. Dick's Sporting Goods Inc (DKS +4.66%) also posted an upbeat earnings report. The tail end of earnings season continues with Cisco System's Inc (CSCO -0.03%) profit tally due out after the closing bell tonight.
In fixed-income, Treasuries were higher with the 10-year note up 5/32 to yield 1.59%.
Regular readers may note that this commentary first mentioned a "market correction" on October 11th, calling for reduced market exposure repeatedly if investors were not already completely in cash. During market corrections the M criteria argues against new buying efforts and urges investors to take a defensive stance to protect precious capital. That stance can change back to a bullish stance where buying is encouraged when at least one of the three major averages produces a solid follow-through day (FTD). A FTD confirming a new rally requires substantial gains on higher (ideally above average) volume, coupled with healthy leadership and a respectable number of stocks hitting new 52-week highs. Historic studies have shown that a FTD occurring between Days 4-7 of a new rally effort has often signaled the beginning of the most substantial market rallies.
Investors should always limit losses if ever any stock falls more than -7% from their purchase price. Following strict sell rules is precisely how this fact-based investment system prompts investors to reduce exposure and protect cash during market downturns. Keep a watchlist of strong acting stocks with all-key criteria in anticipation of the next confirmed uptrend. See the noteworthy candidates included on the Featured Stocks Page.
Watch for an announcement via email concerning the next WEBCAST. The webcast will also be available via an updated link highlighted at the top of the Premium Member Homepage.
PICTURED: The S&P 500 Index undercut Friday's lows and closed further below its 200-day moving average (DMA) line (1,381) as the benchmark index finished -6.8% off its 2012 high hit on 9/14/12. Bargain hunting is never a part of the fact-based approach supported by CANSLIM.net. Until the major averages produce a new confirmed rally with a follow-through day, disciplined investors know that it is most important to be protecting cash.
|
 Kenneth J. Gruneisen started out as a licensed stockbroker in August 1987, a couple of months prior to the historic stock market crash that took the Dow Jones Industrial Average down -22.6% in a single day. He has published daily fact-based fundamental and technical analysis on high-ranked stocks online for two decades. Through FACTBASEDINVESTING.COM, Kenneth provides educational articles, news, market commentary, and other information regarding proven investment systems that work in good times and bad.
Comments contained in the body of this report are technical opinions only and are not necessarily those of Gruneisen Growth Corp. The material herein has been obtained from sources believed to be reliable and accurate, however, its accuracy and completeness cannot be guaranteed. Our firm, employees, and customers may effect transactions, including transactions contrary to any recommendation herein, or have positions in the securities mentioned herein or options with respect thereto. Any recommendation contained in this report may not be suitable for all investors and it is not to be deemed an offer or solicitation on our part with respect to the purchase or sale of any securities. |
|
 |
Financial, Commodity-Linked, Tech and Retail Indexes Fell
Kenneth J. Gruneisen - Passed the CAN SLIM® Master's Exam
The Broker/Dealer Index ($XBD -1.62%) and Bank Index ($BKX -1.14%) had a negative influence on the major averages as financial shares helped lead the market lower. Commodity-linked groups also fell as the Gold & Silver Index ($XAU -1.11%) and the Integrated Oil Index ($XOI -0.92%) and Oil Services Index ($OSX -0.35%) lost ground. The tech sector saw unanimous losses from the Semiconductor Index ($SOX -0.96%), Networking Index ($NWX -1.32%), and the Internet Index ($IIX -0.78%) while the Biotechnology Index ($BTK +0.00%) finished flat. The Retail Index ($RLX -0.90%) and the Healthcare Index ($HMO -0.58%) rounded out the widely negative session.
Charts courtesy www.stockcharts.com
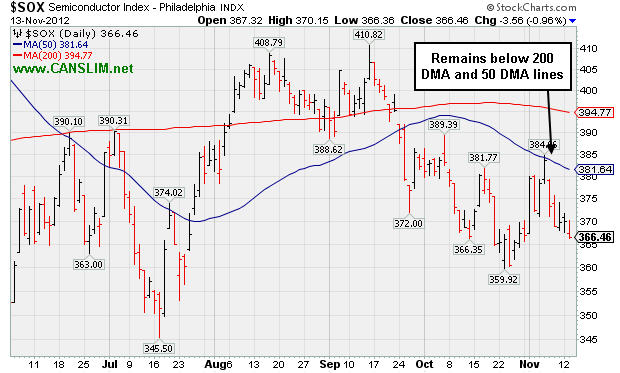
PICTURED: The Semiconductor Index ($SOX -0.96%) is trading below its 50-day and 200-day moving average (DMA) lines.
| Oil Services |
$OSX |
210.33 |
-0.74 |
-0.35% |
-2.75% |
| Healthcare |
$HMO |
2,438.00 |
-14.28 |
-0.58% |
+6.85% |
| Integrated Oil |
$XOI |
1,189.42 |
-11.08 |
-0.92% |
-3.23% |
| Semiconductor |
$SOX |
366.46 |
-3.56 |
-0.96% |
+0.55% |
| Networking |
$NWX |
198.79 |
-2.66 |
-1.32% |
-7.61% |
| Internet |
$IIX |
304.25 |
-2.40 |
-0.78% |
+7.99% |
| Broker/Dealer |
$XBD |
81.72 |
-1.34 |
-1.62% |
-1.86% |
| Retail |
$RLX |
650.90 |
-5.89 |
-0.90% |
+24.41% |
| Gold & Silver |
$XAU |
176.72 |
-1.99 |
-1.11% |
-2.17% |
| Bank |
$BKX |
47.66 |
-0.55 |
-1.14% |
+21.03% |
| Biotech |
$BTK |
1,457.25 |
+0.03 |
+0.00% |
+33.52% |
|
|
|
 |
50-Day Moving Average Line Defines Important Support
Kenneth J. Gruneisen - Passed the CAN SLIM® Master's Exam
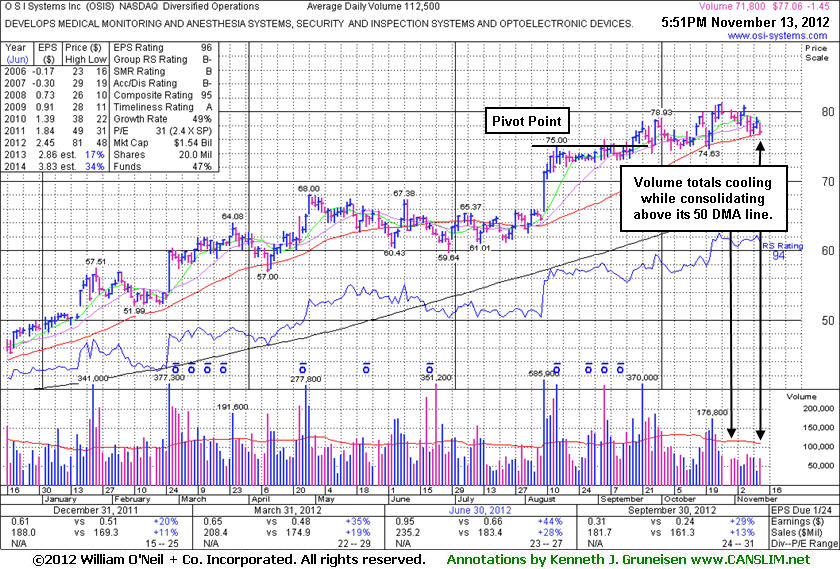
O S I Systems Inc (OSIS -$1.45 or -1.85% to $77.06) is consolidating above its 50-day moving average (DMA) line, an important support level. A violation of that short-term average may trigger a technical sell signal. It has not formed a sound new base pattern. Its last appearance in this FSU section was on 10/18/12 with an annotated daily graph under the headline, "Few Investors Heading For Exits While Perched At High". Volume totals have been cooling in recent weeks while holding its ground, a sign that very few investors have been heading for the exits. 0
It reported earnings +29% on +13% sales revenues for the quarter ended September 30, 2012 versus the year ago period, above the +25% minimum earnings guideline (C criteria) for a 3rd consecutive quarterly comparison. Its annual earnings (A criteria) growth history has also been very strong. Ownership by top-rated funds rose from 281 in Sep '11 to 314 in the Sep '12 quarter, a reassuring sign concerning the I criteria.
|
|
|
Color Codes Explained :
Y - Better candidates highlighted by our
staff of experts.
G - Previously featured
in past reports as yellow but may no longer be buyable under the
guidelines.
***Last / Change / Volume data in this table is the closing quote data***
Symbol/Exchange
Company Name
Industry Group |
PRICE |
CHANGE
(%Change) |
Day High |
Volume
(% DAV)
(% 50 day avg vol) |
52 Wk Hi
% From Hi |
Featured
Date |
Price
Featured |
Pivot Featured |
|
Max Buy |
ASPS
-
NASDAQ
Altisource Ptf Sltns Sa
REAL ESTATE - Property Management/Developmen
|
$105.51
|
-1.64
-1.53% |
$109.78
|
184,939
83.72% of 50 DAV
50 DAV is 220,900
|
$129.72
-18.66%
|
9/24/2012
|
$87.24
|
PP = $92.39
|
|
MB = $97.01
|
Most Recent Note - 11/12/2012 4:17:46 PM
G - Consolidating above important support at its 50 DMA line and recent lows. Subsequent violations would raise concerns and trigger technical sell signals.
>>> The latest Featured Stock Update with an annotated graph appeared on 11/9/2012. Click here.
View all notes |
Alert me of new notes |
CANSLIM.net Company Profile |
SEC |
Zacks Reports |
StockTalk |
News |
Chart |
Request a new note
C
A N
S L
I M


|
CFNL
-
NASDAQ
Cardinal Financial Corp
BANKING - Regional - Southeast Banks
|
$15.68
|
+0.08
0.51% |
$15.83
|
201,164
147.91% of 50 DAV
50 DAV is 136,000
|
$16.21
-3.27%
|
8/17/2012
|
$12.84
|
PP = $13.31
|
|
MB = $13.98
|
 Most Recent Note - 11/13/2012 12:16:24 PM
G - Consolidating after getting extended from its prior base. Prior high ($14.79 on 9/24/12) defines initial support to watch above its 50 DMA line. Disciplined investors may watch out for worrisome technical sell signals while awaiting a new base or secondary buy point and more favorable market.
>>> The latest Featured Stock Update with an annotated graph appeared on 10/25/2012. Click here.
View all notes |
Alert me of new notes |
CANSLIM.net Company Profile |
SEC |
Zacks Reports |
StockTalk |
News |
Chart |
Request a new note
C
A N
S L
I M
|
CMCSA
-
NASDAQ
Comcast Corp Cl A
MEDIA - CATV Systems
|
$36.11
|
-0.05
-0.15% |
$36.59
|
12,544,415
99.08% of 50 DAV
50 DAV is 12,660,800
|
$37.96
-4.87%
|
6/11/2012
|
$29.94
|
PP = $30.98
|
|
MB = $32.53
|
Most Recent Note - 11/12/2012 3:58:08 PM
G - Reported earnings +39% on +15% sales revenues for the Sep '12 quarter, a reassuring follow-up to the previously noted sub par quarter. It slumped under an upward trendline with losses last week and it is now testing important support near its 50 DMA line.
>>> The latest Featured Stock Update with an annotated graph appeared on 10/24/2012. Click here.
View all notes |
Alert me of new notes |
CANSLIM.net Company Profile |
SEC |
Zacks Reports |
StockTalk |
News |
Chart |
Request a new note
C
A N
S L
I M
|
DVA
-
NYSE
Davita Healthcare Prtns
HEALTH SERVICES - Specialized Health Services
|
$112.61
|
-0.29
-0.26% |
$113.46
|
578,031
67.17% of 50 DAV
50 DAV is 860,600
|
$116.50
-3.34%
|
9/5/2012
|
$102.92
|
PP = $100.62
|
|
MB = $105.65
|
Most Recent Note - 11/12/2012 4:03:21 PM
G - Holding its ground -3.2% off its 52-week high today. Fundamental concerns were raised after it reported earnings +3% on +12% sales for the Sep '12 quarter, below the guidelines of the fact-based system.
>>> The latest Featured Stock Update with an annotated graph appeared on 11/8/2012. Click here.
View all notes |
Alert me of new notes |
CANSLIM.net Company Profile |
SEC |
Zacks Reports |
StockTalk |
News |
Chart |
Request a new note
C
A N
S L
I M
|
GPX
-
NYSE
G P Strategies Corp
DIVERSIFIED SERVICES - Education and Training Services
|
$20.64
|
+0.45
2.23% |
$20.75
|
100,240
176.17% of 50 DAV
50 DAV is 56,900
|
$21.44
-3.73%
|
10/8/2012
|
$20.00
|
PP = $20.77
|
|
MB = $21.81
|
Most Recent Note - 11/13/2012 12:28:06 PM
G - Holding its ground but failing to make headway above previously stubborn resistance in the $20 area. Previously noted - "Recently reported earnings +0% on +12% sales revenues for the Sep '12 quarter, below the +25% minimum earnings guideline, raising fundamental concerns."
>>> The latest Featured Stock Update with an annotated graph appeared on 10/16/2012. Click here.
View all notes |
Alert me of new notes |
CANSLIM.net Company Profile |
SEC |
Zacks Reports |
StockTalk |
News |
Chart |
Request a new note
C
A N
S L
I M
|
Symbol/Exchange
Company Name
Industry Group |
PRICE |
CHANGE
(%Change) |
Day High |
Volume
(% DAV)
(% 50 day avg vol) |
52 Wk Hi
% From Hi |
Featured
Date |
Price
Featured |
Pivot Featured |
|
Max Buy |
LKQ
-
NASDAQ
L K Q Corp
WHOLESALE - Auto Parts
|
$20.88
|
-0.20
-0.95% |
$21.44
|
1,482,655
90.99% of 50 DAV
50 DAV is 1,629,400
|
$21.95
-4.87%
|
8/9/2012
|
$18.97
|
PP = $18.72
|
|
MB = $19.66
|
Most Recent Note - 11/12/2012 3:51:46 PM
G - Reversed into the red after early gains, now on track today for a 4th consecutive small loss. No resistance remains due to overhead supply. Showed impressive resilience and strength after reporting earnings +6% on +30% sales revenues for the Sep '12 quarter. Results below the +25% minimum earnings guideline (C criteria) raised fundamental concerns.
>>> The latest Featured Stock Update with an annotated graph appeared on 10/19/2012. Click here.
View all notes |
Alert me of new notes |
CANSLIM.net Company Profile |
SEC |
Zacks Reports |
StockTalk |
News |
Chart |
Request a new note
C
A N
S L
I M
|
MIDD
-
NASDAQ
Middleby Corp
MANUFACTURING - Diversified Machinery
|
$126.27
|
+1.27
1.02% |
$127.64
|
49,172
61.62% of 50 DAV
50 DAV is 79,800
|
$127.89
-1.27%
|
10/8/2012
|
$118.46
|
PP = $122.67
|
|
MB = $128.80
|
Most Recent Note - 11/13/2012 3:35:30 PM
Y - Trading up today with light volume within striking distance of a best-ever close. Reported earnings +23% on +18% sales for the Sep '12 quarter, below the +25% minimum earnings guideline (C criteria). The M criteria remains an overriding concern until a FTD confirms a new rally.
>>> The latest Featured Stock Update with an annotated graph appeared on 10/22/2012. Click here.
View all notes |
Alert me of new notes |
CANSLIM.net Company Profile |
SEC |
Zacks Reports |
StockTalk |
News |
Chart |
Request a new note
C
A N
S L
I M
|
N
-
NYSE
Netsuite Inc
DIVERSIFIED SERVICES - Business/Management Services
|
$60.10
|
-0.32
-0.53% |
$60.94
|
206,555
39.74% of 50 DAV
50 DAV is 519,800
|
$67.02
-10.33%
|
8/20/2012
|
$55.88
|
PP = $59.32
|
|
MB = $62.29
|
Most Recent Note - 11/13/2012 3:36:48 PM
G - Quietly consolidating under its 50 DMA line today -10.1% off its 52-week high. It did not form a sound new base pattern. Until the major averages are back in a confirmed rally the M criteria argues against any new buying efforts. Reported earnings +60% on +31% sales revenues for the Sep '12 quarter.
>>> The latest Featured Stock Update with an annotated graph appeared on 10/26/2012. Click here.
View all notes |
Alert me of new notes |
CANSLIM.net Company Profile |
SEC |
Zacks Reports |
StockTalk |
News |
Chart |
Request a new note
C
A N
S L
I M
|
OSIS
-
NASDAQ
O S I Systems Inc
ELECTRONICS - Semiconductor Equipment and Mate
|
$77.06
|
-1.45
-1.85% |
$78.34
|
71,812
63.83% of 50 DAV
50 DAV is 112,500
|
$81.23
-5.13%
|
9/5/2012
|
$74.39
|
PP = $75.10
|
|
MB = $78.86
|
Most Recent Note - 11/13/2012 6:05:42 PM
G - Consolidating above its 50 DMA line, an important support level. It has not formed a sound new base pattern. See the latest FSU analysis for more details and a new annotated graph.
>>> The latest Featured Stock Update with an annotated graph appeared on 11/13/2012. Click here.
View all notes |
Alert me of new notes |
CANSLIM.net Company Profile |
SEC |
Zacks Reports |
StockTalk |
News |
Chart |
Request a new note
C
A N
S L
I M
|
RAX
-
NYSE
Rackspace Hosting Inc
INTERNET - Internet Software and; Services
|
$62.35
|
+0.26
0.42% |
$63.11
|
1,040,366
59.84% of 50 DAV
50 DAV is 1,738,600
|
$69.81
-10.69%
|
11/6/2012
|
$65.44
|
PP = $69.91
|
|
MB = $73.41
|
Most Recent Note - 11/12/2012 1:48:50 PM
G - Halting its slide with a gain today following a damaging 5-session slump below its 50 DMA line with volume-driven losses. A rebound above that short-term average is needed for its technical stance to improve.
>>> The latest Featured Stock Update with an annotated graph appeared on 11/6/2012. Click here.
View all notes |
Alert me of new notes |
CANSLIM.net Company Profile |
SEC |
Zacks Reports |
StockTalk |
News |
Chart |
Request a new note
C
A N
S L
I M
|
Symbol/Exchange
Company Name
Industry Group |
PRICE |
CHANGE
(%Change) |
Day High |
Volume
(% DAV)
(% 50 day avg vol) |
52 Wk Hi
% From Hi |
Featured
Date |
Price
Featured |
Pivot Featured |
|
Max Buy |
RNF
-
NYSE
Rentech Nitrogen Ptnr Lp
CHEMICALS - Agricultural Chemicals
|
$38.72
|
+0.14
0.36% |
$39.50
|
392,594
101.73% of 50 DAV
50 DAV is 385,900
|
$41.15
-5.91%
|
11/1/2012
|
$39.11
|
PP = $40.15
|
|
MB = $42.16
|
Most Recent Note - 11/12/2012 1:50:15 PM
Y - Small gap up today with light volume behind its gain. Endured distributional pressure amid a negative market (M criteria) after hitting a new 52-week high on 11/02/12 and a worrisome "negative reversal" for a loss with above average volume.
>>> The latest Featured Stock Update with an annotated graph appeared on 11/2/2012. Click here.
View all notes |
Alert me of new notes |
CANSLIM.net Company Profile |
SEC |
Zacks Reports |
StockTalk |
News |
Chart |
Request a new note
C
A N
S L
I M
|
TDG
-
NYSE
Transdigm Group Inc
AEROSPACE/DEFENSE - Aerospace/Defense Products and; Services
|
$136.00
|
+0.44
0.32% |
$136.58
|
340,277
68.47% of 50 DAV
50 DAV is 497,000
|
$140.49
-3.20%
|
8/16/2012
|
$132.23
|
PP = $136.44
|
|
MB = $143.26
|
Most Recent Note - 11/12/2012 3:55:54 PM
G - Volume totals have been below average for the past week and cooling while consolidating near its high following a special dividend on 10/23/12 when it briefly undercut its 50 DMA line.
>>> The latest Featured Stock Update with an annotated graph appeared on 10/23/2012. Click here.
View all notes |
Alert me of new notes |
CANSLIM.net Company Profile |
SEC |
Zacks Reports |
StockTalk |
News |
Chart |
Request a new note
C
A N
S L
I M
|
VSI
-
NYSE
Vitamin Shoppe Inc
SPECIALTY RETAIL - Specialty Retail, Other
|
$57.68
|
-0.08
-0.14% |
$58.55
|
222,336
76.83% of 50 DAV
50 DAV is 289,400
|
$61.89
-6.80%
|
10/15/2012
|
$57.82
|
PP = $60.08
|
|
MB = $63.08
|
Most Recent Note - 11/12/2012 5:03:16 PM
Y - Promptly slumped back into its prior base and completely negated its 11/06/12 breakout. It released better than expected earnings +35% on +14% sales revenues for the Sep '12 quarter. See the latest FSU analysis for more details and a new annotated graph.
>>> The latest Featured Stock Update with an annotated graph appeared on 11/12/2012. Click here.
View all notes |
Alert me of new notes |
CANSLIM.net Company Profile |
SEC |
Zacks Reports |
StockTalk |
News |
Chart |
Request a new note
C
A N
S L
I M
|
WPI
-
NYSE
Watson Pharmaceuticals
DRUGS - Drugs - Generic
|
$84.48
|
-0.77
-0.90% |
$85.43
|
911,008
108.38% of 50 DAV
50 DAV is 840,600
|
$90.00
-6.13%
|
8/24/2012
|
$82.90
|
PP = $81.10
|
|
MB = $85.16
|
Most Recent Note - 11/12/2012 3:59:57 PM
G - Consolidating -5.4% off its 52-week high today and testing support again at its 50 DMA line. Reported earnings +24% on +19% sales revenues for the Sep '12 quarter, a notch below the +25% minimum guideline (C criteria).
>>> The latest Featured Stock Update with an annotated graph appeared on 11/1/2012. Click here.
View all notes |
Alert me of new notes |
CANSLIM.net Company Profile |
SEC |
Zacks Reports |
StockTalk |
News |
Chart |
Request a new note
C
A N
S L
I M
|
|
|
|
THESE ARE NOT BUY RECOMMENDATIONS!
Comments contained in the body of this report are technical
opinions only. The material herein has been obtained
from sources believed to be reliable and accurate, however,
its accuracy and completeness cannot be guaranteed.
This site is not an investment advisor, hence it does
not endorse or recommend any securities or other investments.
Any recommendation contained in this report may not
be suitable for all investors and it is not to be deemed
an offer or solicitation on our part with respect to
the purchase or sale of any securities. All trademarks,
service marks and trade names appearing in this report
are the property of their respective owners, and are
likewise used for identification purposes only.
This report is a service available
only to active Paid Premium Members.
You may opt-out of receiving report notifications
at any time. Questions or comments may be submitted
by writing to Premium Membership Services 665 S.E. 10 Street, Suite 201 Deerfield Beach, FL 33441-5634 or by calling 1-800-965-8307
or 954-785-1121.
|
|
|

