You are not logged in.
This means you
CAN ONLY VIEW reports that were published prior to Monday, April 14, 2025.
You
MUST UPGRADE YOUR MEMBERSHIP if you want to see any current reports.
AFTER MARKET UPDATE - MONDAY, NOVEMBER 12TH, 2012
Previous After Market Report Next After Market Report >>>
|
|
|
|
DOW |
-0.23 |
12,815.16 |
-0.00% |
|
Volume |
291,944,220 |
-61% |
|
Volume |
1,334,612,780 |
-24% |
|
NASDAQ |
-0.61 |
2,904.26 |
-0.02% |
|
Advancers |
1,419 |
46% |
|
Advancers |
1,122 |
44% |
|
S&P 500 |
+0.15 |
1,380.00 |
+0.01% |
|
Decliners |
1,549 |
50% |
|
Decliners |
1,306 |
52% |
|
Russell 2000 |
-1.15 |
793.87 |
-0.14% |
|
52 Wk Highs |
66 |
|
|
52 Wk Highs |
23 |
|
|
S&P 600 |
-3.94 |
457.34 |
-0.85% |
|
52 Wk Lows |
82 |
|
|
52 Wk Lows |
92 |
|
|
 |
Indices Held Ground on Quiet Veteran's Day Session
Kenneth J. Gruneisen - Passed the CAN SLIM® Master's Exam
On Monday's session the markets finished flat after the biggest weekly retreat since June. The volume totals were reported lighter on the NYSE and on the Nasdaq exchange versus the prior session's totals. Decliners had a narrow lead over advancers on the NYSE and on the Nasdaq exchange. The total number of stocks hitting new 52-week lows outnumbered new 52-week highs on the NYSE and on the Nasdaq exchange. There were 19 high-ranked companies from the CANSLIM.net Leaders List making new 52-week highs and appearing on the CANSLIM.net BreakOuts Page, up from the prior session total of 12 stocks. There were gains for 8 of the 14 high-ranked companies currently included on the Featured Stocks Page, a list that has been shrinking lately while the market environment has deteriorated.
Stocks erased earlier gains as U.S. fiscal cliff fears kept investors cautious. The euro zone debt crisis was also in focus as investors awaited the outcome of a meeting between finance ministers surrounding the next installment of a Greek bailout. Meanwhile, encouraging Chinese data was overlooked as the nation's export growth increased to a five-month high. On the downside, Japan posted the biggest drop in GDP last quarter since being hit by natural disasters in March 2011.
M&A activity garnered attention as Jefferies Group Inc (JEF +14.02%) and Titanium Metals Corp (TIE +42.61%) increased rallied after both companies were separately purchased in stock and cash deals. Overall, nearly all sectors were higher.
Over in fixed-income, U.S. bond markets were closed in observance of Veteran's Day.
Regular readers may note that this commentary first mentioned a "market correction" on October 11th, calling for reduced market exposure repeatedly if investors were not already completely in cash. During market corrections the M criteria argues against new buying efforts and urges investors to take a defensive stance to protect precious capital. That stance can change back to a bullish stance where buying is encouraged when at least one of the three major averages produces a solid follow-through day (FTD). A FTD confirming a new rally requires substantial gains on higher (ideally above average) volume, coupled with healthy leadership and a respectable number of stocks hitting new 52-week highs. Historic studies have shown that a FTD occurring between Days 4-7 of a new rally effort has often signaled the beginning of the most substantial market rallies.
Investors should always limit losses if ever any stock falls more than -7% from their purchase price. Following strict sell rules is precisely how this fact-based investment system prompts investors to reduce exposure and protect cash during market downturns. Keep a watchlist of strong acting stocks with all-key criteria in anticipation of the next confirmed uptrend. See the noteworthy candidates included on the Featured Stocks Page.
Watch for an announcement via email concerning the next WEBCAST. The webcast will also be available via an updated link highlighted at the top of the Premium Member Homepage.
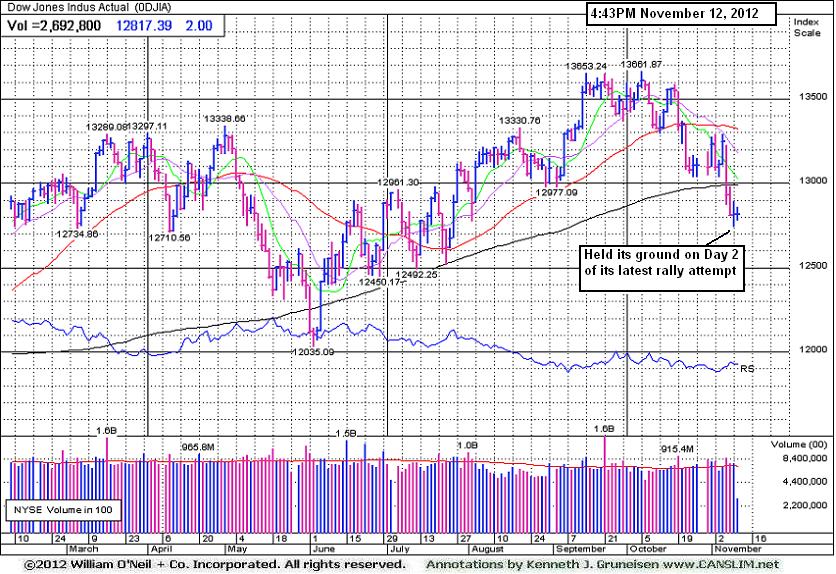
PICTURED: The Dow Jones Industrial Average held its ground on Day 2 of its latest rally attempt. It remains below its 200-day moving average (DMA) line (12,993) and finished -6.2% off its 2012 high. Bargain hunting is never a part of the fact-based approach supported by CANSLIM.net. Until the major averages produce a new confirmed rally with a follow-through day, disciplined investors know that it is most important to be protecting cash
|
 Kenneth J. Gruneisen started out as a licensed stockbroker in August 1987, a couple of months prior to the historic stock market crash that took the Dow Jones Industrial Average down -22.6% in a single day. He has published daily fact-based fundamental and technical analysis on high-ranked stocks online for two decades. Through FACTBASEDINVESTING.COM, Kenneth provides educational articles, news, market commentary, and other information regarding proven investment systems that work in good times and bad.
Comments contained in the body of this report are technical opinions only and are not necessarily those of Gruneisen Growth Corp. The material herein has been obtained from sources believed to be reliable and accurate, however, its accuracy and completeness cannot be guaranteed. Our firm, employees, and customers may effect transactions, including transactions contrary to any recommendation herein, or have positions in the securities mentioned herein or options with respect thereto. Any recommendation contained in this report may not be suitable for all investors and it is not to be deemed an offer or solicitation on our part with respect to the purchase or sale of any securities. |
|
 |
Mixed Group Action on Indecisive Session
Kenneth J. Gruneisen - Passed the CAN SLIM® Master's Exam
The Broker/Dealer Index ($XBD +1.02%) posted a decent gain while the Bank Index ($BKX +0.17%) edged higher. Meanwhile, the Retail Index ($RLX -0.90%) was weak and defensive groups including the Gold & Silver Index ($XAU -1.33%) and the Healthcare Index ($HMO -0.60%) fell. The Biotechnology Index ($BTK +1.02%) led the tech sector while the Networking Index ($NWX +0.69%) and the Internet Index ($IIX +0.54%) posted smaller gains, and the Semiconductor Index ($SOX +0.09%) ended virtually flat. The Oil Services Index ($OSX +0.79%) posted a gain while the Integrated Oil Index ($XOI -0.09%) also ended virtually flat.
Charts courtesy www.stockcharts.com

PICTURED: The Biotechnology Index ($BTK +1.02%) rebounded above its 200-day moving average (DMA) line.
| Oil Services |
$OSX |
211.07 |
+1.66 |
+0.79% |
-2.41% |
| Healthcare |
$HMO |
2,450.98 |
-14.82 |
-0.60% |
+7.42% |
| Integrated Oil |
$XOI |
1,200.53 |
-1.05 |
-0.09% |
-2.32% |
| Semiconductor |
$SOX |
370.02 |
+0.32 |
+0.09% |
+1.53% |
| Networking |
$NWX |
201.92 |
+1.38 |
+0.69% |
-6.16% |
| Internet |
$IIX |
307.23 |
+1.65 |
+0.54% |
+9.05% |
| Broker/Dealer |
$XBD |
82.93 |
+0.84 |
+1.02% |
-0.40% |
| Retail |
$RLX |
650.90 |
-5.89 |
-0.90% |
+24.41% |
| Gold & Silver |
$XAU |
178.71 |
-2.40 |
-1.33% |
-1.07% |
| Bank |
$BKX |
48.21 |
+0.08 |
+0.17% |
+22.42% |
| Biotech |
$BTK |
1,458.73 |
+14.69 |
+1.02% |
+33.65% |
|
|
|
 |
Promptly Negated Recent Breakout
Kenneth J. Gruneisen - Passed the CAN SLIM® Master's Exam
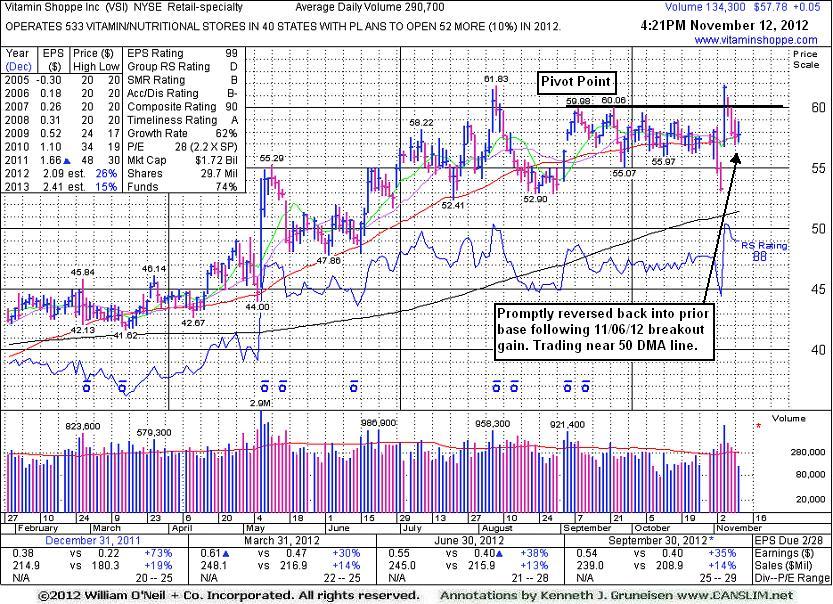
Vitamin Shoppe Inc's (VSI +$0.03 or +0.05% to $57.76) promptly slumped back to a close in its prior base, completely negating its 11/06/12 breakout. It released better than expected earnings +35% on +14% sales revenues for the Sep '12 quarter. VSI was last shown in this FSU section on 10/15/12 with an annotated graph under the headline, "Quiet Consolidation Has Look of New Base", while consolidating near its 50-day moving average (DMA) line. Odds are not favorable without proof of fresh institutional accumulation and also more reassuring signs from the broader market (M criteria). Meanwhile, below its short-term average the recent lows near $53 define the next important chart support.
Additional leadership (L criteria) shown by other stocks in the Retail - Specialty group has been a reassuring sign, however the Group Relative Strength Rating fell to 18 from 94 when the stock was shown in this section on 7/02/12. Fundamentally, it has earned high ranks after showing strong quarterly and annual earnings increases satisfying the C and A criteria. The number of top-rated funds owning its shares rose from 288 in Jun '11 to 383 in Sep '12, a reassuring sign concerning the I criteria. Vitamin Shoppe has 29.7 million shares outstanding. That small supply is not a bad thing, but could contribute to greater price volatility. Historic studies have shown that once companies have grown their supply (S criteria) of shares outstanding to hundreds of millions, or even billions of shares outstanding, they are less likely candidates to be "above average" gainers.
|
|
|
Color Codes Explained :
Y - Better candidates highlighted by our
staff of experts.
G - Previously featured
in past reports as yellow but may no longer be buyable under the
guidelines.
***Last / Change / Volume data in this table is the closing quote data***
Symbol/Exchange
Company Name
Industry Group |
PRICE |
CHANGE
(%Change) |
Day High |
Volume
(% DAV)
(% 50 day avg vol) |
52 Wk Hi
% From Hi |
Featured
Date |
Price
Featured |
Pivot Featured |
|
Max Buy |
ASPS
-
NASDAQ
Altisource Ptf Sltns Sa
REAL ESTATE - Property Management/Developmen
|
$107.15
|
-2.43
-2.22% |
$112.34
|
172,758
78.78% of 50 DAV
50 DAV is 219,300
|
$129.72
-17.40%
|
9/24/2012
|
$87.24
|
PP = $92.39
|
|
MB = $97.01
|
 Most Recent Note - 11/12/2012 4:17:46 PM
G - Consolidating above important support at its 50 DMA line and recent lows. Subsequent violations would raise concerns and trigger technical sell signals.
>>> The latest Featured Stock Update with an annotated graph appeared on 11/9/2012. Click here.
View all notes |
Alert me of new notes |
CANSLIM.net Company Profile |
SEC |
Zacks Reports |
StockTalk |
News |
Chart |
Request a new note
C
A N
S L
I M


|
CFNL
-
NASDAQ
Cardinal Financial Corp
BANKING - Regional - Southeast Banks
|
$15.60
|
+0.30
1.96% |
$15.76
|
247,845
187.48% of 50 DAV
50 DAV is 132,200
|
$16.21
-3.76%
|
8/17/2012
|
$12.84
|
PP = $13.31
|
|
MB = $13.98
|
Most Recent Note - 11/12/2012 4:19:23 PM
G - Gain today with above average volume broke a 3 session losing streak. Extended from its prior base, its prior high ($14.79 on 9/24/12) defines initial support to watch above its 50 DMA line. Disciplined investors may watch out for worrisome technical sell signals while awaiting a new base or secondary buy point and more favorable market.
>>> The latest Featured Stock Update with an annotated graph appeared on 10/25/2012. Click here.
View all notes |
Alert me of new notes |
CANSLIM.net Company Profile |
SEC |
Zacks Reports |
StockTalk |
News |
Chart |
Request a new note
C
A N
S L
I M
|
CMCSA
-
NASDAQ
Comcast Corp Cl A
MEDIA - CATV Systems
|
$36.17
|
+0.05
0.12% |
$36.24
|
8,246,626
65.27% of 50 DAV
50 DAV is 12,634,800
|
$37.96
-4.73%
|
6/11/2012
|
$29.94
|
PP = $30.98
|
|
MB = $32.53
|
Most Recent Note - 11/12/2012 3:58:08 PM
G - Reported earnings +39% on +15% sales revenues for the Sep '12 quarter, a reassuring follow-up to the previously noted sub par quarter. It slumped under an upward trendline with losses last week and it is now testing important support near its 50 DMA line.
>>> The latest Featured Stock Update with an annotated graph appeared on 10/24/2012. Click here.
View all notes |
Alert me of new notes |
CANSLIM.net Company Profile |
SEC |
Zacks Reports |
StockTalk |
News |
Chart |
Request a new note
C
A N
S L
I M
|
DVA
-
NYSE
Davita Healthcare Prtns
HEALTH SERVICES - Specialized Health Services
|
$112.90
|
+0.47
0.42% |
$113.34
|
554,114
64.76% of 50 DAV
50 DAV is 855,700
|
$116.50
-3.09%
|
9/5/2012
|
$102.92
|
PP = $100.62
|
|
MB = $105.65
|
Most Recent Note - 11/12/2012 4:03:21 PM
G - Holding its ground -3.2% off its 52-week high today. Fundamental concerns were raised after it reported earnings +3% on +12% sales for the Sep '12 quarter, below the guidelines of the fact-based system.
>>> The latest Featured Stock Update with an annotated graph appeared on 11/8/2012. Click here.
View all notes |
Alert me of new notes |
CANSLIM.net Company Profile |
SEC |
Zacks Reports |
StockTalk |
News |
Chart |
Request a new note
C
A N
S L
I M
|
GPX
-
NYSE
G P Strategies Corp
DIVERSIFIED SERVICES - Education and Training Services
|
$20.19
|
+0.00
0.00% |
$21.44
|
45,618
79.61% of 50 DAV
50 DAV is 57,300
|
$20.93
-3.54%
|
10/8/2012
|
$20.00
|
PP = $20.77
|
|
MB = $21.81
|
Most Recent Note - 11/12/2012 3:50:07 PM
G - Holding its ground but failing to make headway since hitting a new 52-week high when last noted on 11/06/12 - "Recently reported earnings +0% on +12% sales revenues for the Sep '12 quarter, below the +25% minimum earnings guideline, raising fundamental concerns."
>>> The latest Featured Stock Update with an annotated graph appeared on 10/16/2012. Click here.
View all notes |
Alert me of new notes |
CANSLIM.net Company Profile |
SEC |
Zacks Reports |
StockTalk |
News |
Chart |
Request a new note
C
A N
S L
I M
|
Symbol/Exchange
Company Name
Industry Group |
PRICE |
CHANGE
(%Change) |
Day High |
Volume
(% DAV)
(% 50 day avg vol) |
52 Wk Hi
% From Hi |
Featured
Date |
Price
Featured |
Pivot Featured |
|
Max Buy |
LKQ
-
NASDAQ
L K Q Corp
WHOLESALE - Auto Parts
|
$21.08
|
-0.11
-0.52% |
$21.74
|
1,436,446
88.88% of 50 DAV
50 DAV is 1,616,200
|
$21.95
-3.96%
|
8/9/2012
|
$18.97
|
PP = $18.72
|
|
MB = $19.66
|
Most Recent Note - 11/12/2012 3:51:46 PM
G - Reversed into the red after early gains, now on track today for a 4th consecutive small loss. No resistance remains due to overhead supply. Showed impressive resilience and strength after reporting earnings +6% on +30% sales revenues for the Sep '12 quarter. Results below the +25% minimum earnings guideline (C criteria) raised fundamental concerns.
>>> The latest Featured Stock Update with an annotated graph appeared on 10/19/2012. Click here.
View all notes |
Alert me of new notes |
CANSLIM.net Company Profile |
SEC |
Zacks Reports |
StockTalk |
News |
Chart |
Request a new note
C
A N
S L
I M
|
MIDD
-
NASDAQ
Middleby Corp
MANUFACTURING - Diversified Machinery
|
$125.00
|
+0.50
0.40% |
$126.63
|
60,001
74.63% of 50 DAV
50 DAV is 80,400
|
$127.89
-2.26%
|
10/8/2012
|
$118.46
|
PP = $122.67
|
|
MB = $128.80
|
Most Recent Note - 11/9/2012 4:00:54 PM
Y - Found prompt support at its 50 DMA line this week. Reported earnings +23% on +18% sales for the Sep '12 quarter, below the +25% minimum earnings guideline (C criteria). The M criteria remains an overriding concern until a FTD confirms a new rally.
>>> The latest Featured Stock Update with an annotated graph appeared on 10/22/2012. Click here.
View all notes |
Alert me of new notes |
CANSLIM.net Company Profile |
SEC |
Zacks Reports |
StockTalk |
News |
Chart |
Request a new note
C
A N
S L
I M
|
N
-
NYSE
Netsuite Inc
DIVERSIFIED SERVICES - Business/Management Services
|
$60.42
|
-0.24
-0.40% |
$61.03
|
270,727
52.12% of 50 DAV
50 DAV is 519,400
|
$67.02
-9.85%
|
8/20/2012
|
$55.88
|
PP = $59.32
|
|
MB = $62.29
|
Most Recent Note - 11/9/2012 4:02:24 PM
G - Consolidating near its 50 DMA line today -9.3% off its 52-week high. It did not form a sound new base pattern. Until the major averages are back in a confirmed rally the M criteria argues against any new buying efforts. Reported earnings +60% on +31% sales revenues for the Sep '12 quarter.
>>> The latest Featured Stock Update with an annotated graph appeared on 10/26/2012. Click here.
View all notes |
Alert me of new notes |
CANSLIM.net Company Profile |
SEC |
Zacks Reports |
StockTalk |
News |
Chart |
Request a new note
C
A N
S L
I M
|
OSIS
-
NASDAQ
O S I Systems Inc
ELECTRONICS - Semiconductor Equipment and Mate
|
$78.51
|
+0.77
0.99% |
$79.21
|
39,119
34.19% of 50 DAV
50 DAV is 114,400
|
$81.23
-3.35%
|
9/5/2012
|
$74.39
|
PP = $75.10
|
|
MB = $78.86
|
Most Recent Note - 11/12/2012 4:01:57 PM
G - Consolidating above its 50 DMA line, an important support level. It has not formed a sound new base pattern.
>>> The latest Featured Stock Update with an annotated graph appeared on 10/18/2012. Click here.
View all notes |
Alert me of new notes |
CANSLIM.net Company Profile |
SEC |
Zacks Reports |
StockTalk |
News |
Chart |
Request a new note
C
A N
S L
I M
|
RAX
-
NYSE
Rackspace Hosting Inc
INTERNET - Internet Software and; Services
|
$62.09
|
+1.61
2.66% |
$62.68
|
1,459,163
83.66% of 50 DAV
50 DAV is 1,744,100
|
$69.81
-11.06%
|
11/6/2012
|
$65.44
|
PP = $69.91
|
|
MB = $73.41
|
Most Recent Note - 11/12/2012 1:48:50 PM
G - Halting its slide with a gain today following a damaging 5-session slump below its 50 DMA line with volume-driven losses. A rebound above that short-term average is needed for its technical stance to improve.
>>> The latest Featured Stock Update with an annotated graph appeared on 11/6/2012. Click here.
View all notes |
Alert me of new notes |
CANSLIM.net Company Profile |
SEC |
Zacks Reports |
StockTalk |
News |
Chart |
Request a new note
C
A N
S L
I M
|
Symbol/Exchange
Company Name
Industry Group |
PRICE |
CHANGE
(%Change) |
Day High |
Volume
(% DAV)
(% 50 day avg vol) |
52 Wk Hi
% From Hi |
Featured
Date |
Price
Featured |
Pivot Featured |
|
Max Buy |
RNF
-
NYSE
Rentech Nitrogen Ptnr Lp
CHEMICALS - Agricultural Chemicals
|
$38.58
|
+1.04
2.77% |
$38.65
|
223,514
58.00% of 50 DAV
50 DAV is 385,400
|
$41.15
-6.25%
|
11/1/2012
|
$39.11
|
PP = $40.15
|
|
MB = $42.16
|
Most Recent Note - 11/12/2012 1:50:15 PM
Y - Small gap up today with light volume behind its gain. Endured distributional pressure amid a negative market (M criteria) after hitting a new 52-week high on 11/02/12 and a worrisome "negative reversal" for a loss with above average volume.
>>> The latest Featured Stock Update with an annotated graph appeared on 11/2/2012. Click here.
View all notes |
Alert me of new notes |
CANSLIM.net Company Profile |
SEC |
Zacks Reports |
StockTalk |
News |
Chart |
Request a new note
C
A N
S L
I M
|
TDG
-
NYSE
Transdigm Group Inc
AEROSPACE/DEFENSE - Aerospace/Defense Products and; Services
|
$135.56
|
-1.76
-1.28% |
$137.20
|
268,532
54.14% of 50 DAV
50 DAV is 496,000
|
$140.49
-3.51%
|
8/16/2012
|
$132.23
|
PP = $136.44
|
|
MB = $143.26
|
Most Recent Note - 11/12/2012 3:55:54 PM
G - Volume totals have been below average for the past week and cooling while consolidating near its high following a special dividend on 10/23/12 when it briefly undercut its 50 DMA line.
>>> The latest Featured Stock Update with an annotated graph appeared on 10/23/2012. Click here.
View all notes |
Alert me of new notes |
CANSLIM.net Company Profile |
SEC |
Zacks Reports |
StockTalk |
News |
Chart |
Request a new note
C
A N
S L
I M
|
VSI
-
NYSE
Vitamin Shoppe Inc
SPECIALTY RETAIL - Specialty Retail, Other
|
$57.76
|
+0.03
0.05% |
$58.86
|
140,852
48.45% of 50 DAV
50 DAV is 290,700
|
$61.89
-6.67%
|
10/15/2012
|
$57.82
|
PP = $60.08
|
|
MB = $63.08
|
Most Recent Note - 11/12/2012 5:03:16 PM
Y - Promptly slumped back into its prior base and completely negated its 11/06/12 breakout. It released better than expected earnings +35% on +14% sales revenues for the Sep '12 quarter. See the latest FSU analysis for more details and a new annotated graph.
>>> The latest Featured Stock Update with an annotated graph appeared on 11/12/2012. Click here.
View all notes |
Alert me of new notes |
CANSLIM.net Company Profile |
SEC |
Zacks Reports |
StockTalk |
News |
Chart |
Request a new note
C
A N
S L
I M
|
WPI
-
NYSE
Watson Pharmaceuticals
DRUGS - Drugs - Generic
|
$85.25
|
+0.14
0.16% |
$86.50
|
778,891
91.66% of 50 DAV
50 DAV is 849,800
|
$90.00
-5.28%
|
8/24/2012
|
$82.90
|
PP = $81.10
|
|
MB = $85.16
|
Most Recent Note - 11/12/2012 3:59:57 PM
G - Consolidating -5.4% off its 52-week high today and testing support again at its 50 DMA line. Reported earnings +24% on +19% sales revenues for the Sep '12 quarter, a notch below the +25% minimum guideline (C criteria).
>>> The latest Featured Stock Update with an annotated graph appeared on 11/1/2012. Click here.
View all notes |
Alert me of new notes |
CANSLIM.net Company Profile |
SEC |
Zacks Reports |
StockTalk |
News |
Chart |
Request a new note
C
A N
S L
I M
|
|
|
|
THESE ARE NOT BUY RECOMMENDATIONS!
Comments contained in the body of this report are technical
opinions only. The material herein has been obtained
from sources believed to be reliable and accurate, however,
its accuracy and completeness cannot be guaranteed.
This site is not an investment advisor, hence it does
not endorse or recommend any securities or other investments.
Any recommendation contained in this report may not
be suitable for all investors and it is not to be deemed
an offer or solicitation on our part with respect to
the purchase or sale of any securities. All trademarks,
service marks and trade names appearing in this report
are the property of their respective owners, and are
likewise used for identification purposes only.
This report is a service available
only to active Paid Premium Members.
You may opt-out of receiving report notifications
at any time. Questions or comments may be submitted
by writing to Premium Membership Services 665 S.E. 10 Street, Suite 201 Deerfield Beach, FL 33441-5634 or by calling 1-800-965-8307
or 954-785-1121.
|
|
|

