You are not logged in.
This means you
CAN ONLY VIEW reports that were published prior to Monday, April 14, 2025.
You
MUST UPGRADE YOUR MEMBERSHIP if you want to see any current reports.
AFTER MARKET UPDATE - WEDNESDAY, NOVEMBER 11TH, 2009
Previous After Market Report Next After Market Report >>>
|
|
|
|
DOW |
+44.29 |
10,291.26 |
+0.43% |
|
Volume |
1,045,722,880 |
-3% |
|
Volume |
1,891,243,900 |
-7% |
|
NASDAQ |
+15.82 |
2,166.90 |
+0.74% |
|
Advancers |
1,879 |
61% |
|
Advancers |
1,697 |
60% |
|
S&P 500 |
+5.50 |
1,098.51 |
+0.50% |
|
Decliners |
1,124 |
36% |
|
Decliners |
1,018 |
36% |
|
Russell 2000 |
+5.78 |
592.71 |
+0.98% |
|
52 Wk Highs |
211 |
|
|
52 Wk Highs |
109 |
|
|
S&P 600 |
+2.81 |
314.35 |
+0.90% |
|
52 Wk Lows |
6 |
|
|
52 Wk Lows |
22 |
|
|
 |
Gains On Lighter Volume Reveal Lackluster Buying Demand
Adam Sarhan, Contributing Writer,
The major averages rallied on Wednesday, sending the benchmark S&P 500 Index to a fresh 2009 high on positive economic and political data. However, volume, a critical component of institutional demand, was reported lower on both major exchanges. That signaled that large institutions were not aggressively buying stocks. Advancers led decliners by about a 3-to-2 ratio on the NYSE and on the Nasdaq exchange. There were 47 high-ranked companies from the CANSLIM.net Leaders List making a new 52-week high and appearing on the CANSLIM.net BreakOuts Page, higher than the 36 issues that appeared on the prior session. In terms of new leadership, it was encouraging to see new 52-week highs outnumber new 52-week lows on the NYSE and Nasdaq exchange.
Overnight, China reported that its industrial production surged thanks in part to strong demand. This bodes well for the global economic recovery and helps allay concern that the 8-month rally in global equities is exaggerated. Elsewhere, the Fed signaled they do not plan on raising rates any time soon. This also removed a ton of pressure on those that subscribe to the notion that the stock market's 8-month advance was due to a massive government induced liquidity driven rally. The underlying notion is that banks are able to borrow money near record lows and then use that money however they may see fit. Most financial institutions have earned tremendous profits in recent quarters thanks in part to the relative ease of borrowing money. In general, people don't like to hold cash (especially when rates are near zero), instead they prefer to invest it. That basically summarizes the robust move we have seen in global capital markets in recent months.
The S&P 500 Index, which skidded -38% in 2008, has rebounded +62% from a 12-year low in March. So far, approximately eighty percent of S&P 500 companies have released their Q3 results and the market's reaction of late has been muted at best. At the beginning of earnings season, the market was steady, then sold off, then bounced back over the past week and a half as buyers showed up and bought shares. The average company in the S&P 500 that has reported their Q3 results have topped estimates according to the latest data provided by Bloomberg.com. The government reported that Q3 GDP rose last month which in part helped companies beat estimates.
PICTURED: The S&P 500 Index hit a new 2009 high before pulling back and closing below the 1,100 mark.
|
|
|
 |
Financial And Tech Indexes Among Groups With Encouraging Gains
Kenneth J. Gruneisen - Passed the CAN SLIM® Master's Exam
Financial and tech sector gains were a source of encouraging strength that helped underpin the major averages' gains on Wednesday. The Broker/Dealer Index ($XBD +1.10%) and Bank Index ($BKX +1.12%) tallied small gains. The Semiconductor Index ($SOX +1.36%) and Networking Index ($NWX +1.72%) outpaced the Internet Index ($IIX +0.62%) and Biotechnology Index ($BTK +0.40%). The Healthcare Index ($HMO +0.82%) and Oil Services Index ($OSX +1.03%) also traded with a positive bias. Meanwhile, the Integrated Oil Index ($XOI -0.35%) and Retail Index ($RLX -0.32%) closed with slight losses, making them laggards on the mostly positive session.
Charts courtesy www.stockcharts.com
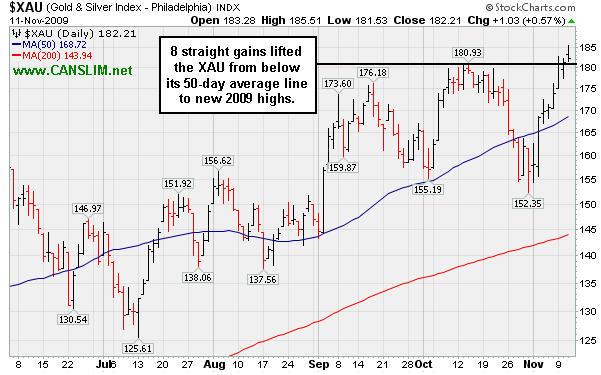
PICTURED: The Gold & Silver Index ($XAU +0.57%) has posted 8 consecutive gains, rallying from below its 50-day moving average (DMA) line to new 2009 highs.
| Oil Services |
$OSX |
202.01 |
+2.05 |
+1.03% |
+66.41% |
| Healthcare |
$HMO |
1,321.85 |
+10.69 |
+0.82% |
+37.67% |
| Integrated Oil |
$XOI |
1,097.26 |
-3.84 |
-0.35% |
+12.00% |
| Semiconductor |
$SOX |
315.76 |
+4.24 |
+1.36% |
+48.82% |
| Networking |
$NWX |
227.91 |
+3.85 |
+1.72% |
+58.39% |
| Internet |
$IIX |
225.38 |
+1.38 |
+0.62% |
+68.48% |
| Broker/Dealer |
$XBD |
119.05 |
+1.29 |
+1.10% |
+53.67% |
| Retail |
$RLX |
403.86 |
-1.31 |
-0.32% |
+44.62% |
| Gold & Silver |
$XAU |
182.21 |
+1.03 |
+0.57% |
+47.12% |
| Bank |
$BKX |
44.22 |
+0.49 |
+1.12% |
-0.23% |
| Biotech |
$BTK |
903.49 |
+3.64 |
+0.40% |
+39.61% |
|
|
|
 |
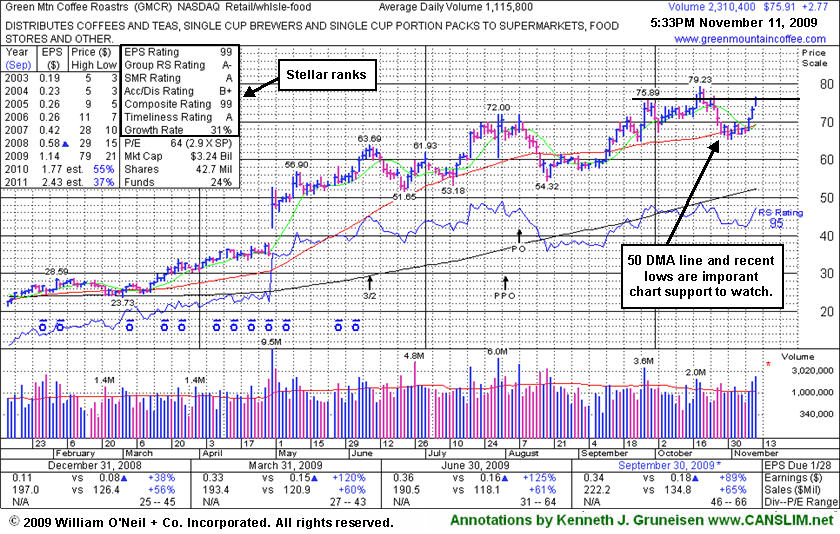
Choppy Action Has Not Allowed Sound Base To Form
Kenneth J. Gruneisen - Passed the CAN SLIM® Master's Exam
Green Mountain Coffee Roasters (GMCR +$2.77 or +3.79% to $75.91) posted a third consecutive gain today, rising with above average volume for its third highest close ever. That leaves almost no overhead supply remaining to act as resistance, however its choppy action in recent weeks has not allowed for a sound new base to form. It found support near its 50-day moving average line after it negated its recent breakout from a cup-with-high-handle pattern and slumped below its July highs, triggering technical sell signals.
Disciplined investors avoid buying stocks with flawed base patterns, and they always limit losses at any time a stock falls more than 7-8% from their buy price. If any add-on purchases were made after GMCR's later stage breakouts, those positions might have been sold to effectively limit risk, meanwhile, shares of the stock bought at earlier levels might still be justifiable to hold. Any deterioration under recent chart lows would raise concerns, and subsequent losses under its 50 DMA line would trigger technical sell signals as more worrisome signs of weakness.
Do not be confused by the 3-for-2 split that occurred in the interim, as GMCR has traded up as much as +204% since appearing with an annotated graph under the headline "It May Soon Be Time To Go Green" when featured in the January 2009 CANSLIM.net News (read here).
|
|
|
Color Codes Explained :
Y - Better candidates highlighted by our
staff of experts.
G - Previously featured
in past reports as yellow but may no longer be buyable under the
guidelines.
***Last / Change / Volume quote data in this table corresponds with the timestamp on the note***
Symbol/Exchange
Company Name
Industry Group |
Last |
Chg. |
Vol
% DAV |
Date Featured |
Price Featured |
Latest Pivot Point
Featured |
Status |
| Latest Max Buy Price |
ARST
-
|
$25.99
|
-0.73
|
524,687
78% DAV
670,900
|
9/1/2009
(Date
Featured) |
$19.91
(Price
Featured) |
PP = $20.90 |
G |
| MB = $21.95 |
Most Recent Note - 11/11/2009 6:03:27 PM
G - Small loss today on light volume broke a streak of 5 consecutive gains. Color code remains green while dismissing its 10/15/09 high as a new pivot point, with concern over its "late stage" action without a recent base of substantial length. ARST was first featured in yellow at $19.91 in the 9/01/09 mid-day report with an annotated daily graph (read here).
>>> The latest Featured Stock Update with an annotated graph appeared on 11/6/2009. click here.
|
|
C
A
S
I |
News |
Chart |
SEC
View all notes Alert
me of new notes
Company
Profile
|
ASIA
-
|
$25.61
|
+0.58
|
1,423,846
177% DAV
805,700
|
10/14/2009
(Date
Featured) |
$23.05
(Price
Featured) |
PP = $22.19 |
G |
| MB = $23.30 |
Most Recent Note - 11/11/2009 6:09:43 PM
G - Small gap up gain today with above average volume for another new 52-week high, getting extended from its latest sound base. Featured 10/14/09 in the mid-day report (read here) as it gapped up for a new 52-week high with 5 times average volume, triggering a technical buy signal by blasting above its pivot point. First featured in the August 2009 CANSLIM.net News (read here).
>>> The latest Featured Stock Update with an annotated graph appeared on 10/30/2009. click here.
|
|
C
A
S
I |
News |
Chart |
SEC
View all notes Alert
me of new notes
Company
Profile
|
BIDU
- NASDAQ
Baidu Inc Ads
INTERNET - Internet Information Providers
|
$430.51
|
+2.39
|
2,153,292
111% DAV
1,932,400
|
9/8/2009
(Date
Featured) |
$351.80
(Price
Featured) |
PP = $368.59 |
G |
| MB = $387.02 |
Most Recent Note - 11/11/2009 6:13:25 PM
G - Gain today was its 7th consecutive gain on light or near average volume, closing -2% from all-time highs. Proved resilient near its 50 DMA line after its 10/27/09 gap down. As recently noted, "Choppy action has not allowed it to form a sound base in recent weeks." BIDU traded up as much as +23% from its price when featured in yellow in the 9/08/09 Mid-Day BreakOuts Report (read here).
>>> The latest Featured Stock Update with an annotated graph appeared on 11/10/2009. click here.
|
|
C
A
S
I |
News |
Chart |
SEC
View all notes Alert
me of new notes
Company
Profile
|
CACC
- NASDAQ
Credit Acceptance Corp
FINANCIAL SERVICES - Credit Services
|
$34.49
|
+0.63
|
29,083
76% DAV
38,200
|
9/29/2009
(Date
Featured) |
$33.48
(Price
Featured) |
PP = $32.60 |
G |
| MB = $34.23 |
Most Recent Note - 11/11/2009 6:14:51 PM
G - Small gap up gain today on light volume while still consolidating in an orderly fashion above prior chart highs and its 50 DMA line in the $32 area, coinciding as an important support level to watch on pullbacks. The Finance - Consumer/Commercial Loans firm has maintained a great track record of annual and quarterly sales revenues and earnings increases. It was featured on 9/29/09 in yellow in the mid-day report (read here).
>>> The latest Featured Stock Update with an annotated graph appeared on 11/5/2009. click here.
|
|
C
A
S
I |
News |
Chart |
SEC
View all notes Alert
me of new notes
Company
Profile
|
CRM
- NYSE
Salesforce.com Inc
INTERNET - Internet Software & Services
|
$63.53
|
-0.14
|
1,788,957
89% DAV
2,012,800
|
8/16/2009
(Date
Featured) |
$47.12
(Price
Featured) |
PP = $45.59 |
G |
| MB = $47.87 |
Most Recent Note - 11/11/2009 6:16:35 PM
G - Holding its ground this week near 2009 highs. Found support and rallied up from its 50 DMA line last week after noted technical deterioration raised some concerns. Recent chart lows in the $56 area are important support now, and any violation would raise more serious concerns and trigger more worrisome technical sell signals.
>>> The latest Featured Stock Update with an annotated graph appeared on 11/9/2009. click here.
|
|
C
A
S
I |
News |
Chart |
SEC
View all notes Alert
me of new notes
Company
Profile
|
GMCR
- NASDAQ
Green Mtn Coffee Roastrs
FOOD & BEVERAGE - Processed & Packaged Goods
|
$75.91
|
+2.77
|
3,385,185
279% DAV
1,213,500
|
10/5/2009
(Date
Featured) |
$71.11
(Price
Featured) |
PP = $75.89 |
G |
| MB = $79.68 |
Most Recent Note - 11/11/2009 6:20:01 PM
G - Posted a third consecutive gain today, rising with above average volume for its third highest close ever. That leaves almost no overhead supply remaining to act as resistance, however its choppy action in recent weeks has not allowed for a sound new base to form. Deterioration under its 50 DMA or recent lows near $65 would raise more serious concerns.
>>> The latest Featured Stock Update with an annotated graph appeared on 11/11/2009. click here.
|
|
C
A
S
I |
News |
Chart |
SEC
View all notes Alert
me of new notes
Company
Profile
|
|
|
|
THESE ARE NOT BUY RECOMMENDATIONS!
Comments contained in the body of this report are technical
opinions only. The material herein has been obtained
from sources believed to be reliable and accurate, however,
its accuracy and completeness cannot be guaranteed.
This site is not an investment advisor, hence it does
not endorse or recommend any securities or other investments.
Any recommendation contained in this report may not
be suitable for all investors and it is not to be deemed
an offer or solicitation on our part with respect to
the purchase or sale of any securities. All trademarks,
service marks and trade names appearing in this report
are the property of their respective owners, and are
likewise used for identification purposes only.
This report is a service available
only to active Paid Premium Members.
You may opt-out of receiving report notifications
at any time. Questions or comments may be submitted
by writing to Premium Membership Services 665 S.E. 10 Street, Suite 201 Deerfield Beach, FL 33441-5634 or by calling 1-800-965-8307
or 954-785-1121.
|
|
|


