You are not logged in.
This means you
CAN ONLY VIEW reports that were published prior to Monday, April 14, 2025.
You
MUST UPGRADE YOUR MEMBERSHIP if you want to see any current reports.
AFTER MARKET UPDATE - TUESDAY, NOVEMBER 10TH, 2009
Previous After Market Report Next After Market Report >>>
|
|
|
|
DOW |
+20.03 |
10,246.97 |
+0.20% |
|
Volume |
1,072,800,890 |
-13% |
|
Volume |
2,034,836,060 |
-2% |
|
NASDAQ |
-2.98 |
2,151.08 |
-0.14% |
|
Advancers |
1,283 |
41% |
|
Advancers |
893 |
31% |
|
S&P 500 |
-0.07 |
1,093.01 |
-0.01% |
|
Decliners |
1,748 |
56% |
|
Decliners |
1,826 |
64% |
|
Russell 2000 |
-5.34 |
586.97 |
-0.90% |
|
52 Wk Highs |
173 |
|
|
52 Wk Highs |
81 |
|
|
S&P 600 |
-2.22 |
311.54 |
-0.71% |
|
52 Wk Lows |
8 |
|
|
52 Wk Lows |
33 |
|
|
 |
Dow Rises While Other Indices and More Stocks Pull Back Quietly
Adam Sarhan, Contributing Writer,
The major averages traded lower for most of the session and remained confined to a relatively tight trading range one day after the market produced a follow-through day (FTD) which confirmed the latest new rally attempt. Volume, a critical component of institutional demand, was reported lower on the NYSE and on the Nasdaq exchange which signaled large institutions were not aggressively dumping stocks. Decliners led advancers by a 3-to-2 ratio on the NYSE and by a 2-to-1 ratio on the Nasdaq exchange. There were 36 high-ranked companies from the CANSLIM.net Leaders List making a new 52-week high and appearing on the CANSLIM.net BreakOuts Page, lower than the 52 issues that appeared on the prior session. In terms of new leadership, it was encouraging to see new 52-week highs outnumber new 52-week lows on the NYSE and Nasdaq exchange.
Stocks ended mixed but near their intra-day highs which was a very healthy sign considering the 6-day advance they just experienced. The inverse relationship between stocks and the US dollar is alive and well considering the recent action in both these markets. Tim Johnston, who manages $125 million for a private family office in New York told me that "This is not a bull market in stocks as much as it is a bear market in the dollar. The key is to watch the dollar." Many people on Wall Street agree with Tim and subscribe to the notion that the massive rally we have seen in stocks from the March lows has been the direct result of the massive coordinated global stimulus packages, not fresh earnings-powered growth. Typically, economic recoveries are led by the next batch of young entrepreneurial companies that sport strong sales and earnings growth.
The term "funny money" has been used to describe the primary catalyst behind the market's recent gains and its inability to go down. That has narrowed the spectrum of stocks to a small universe of highly liquid leaders that continue to advance as many professional fund managers play "catch-up." Other areas of leadership emerged from non-traditional leaders such as overseas stocks or commodity related names with little (if any) earnings to speak of. Remember that it is our job to capitalize on the market and play by the market's rules, not resort to guesswork. That said, the best course of action is buy the strongest names that break out of solid bases, no exception. When a stock triggers a buy signal be ready to step up and buy. If you have done a good job of protecting cash, that should be easier to do, meanwhile those who have suffered great losses often find it harder to have confidence to buy when the time is right to do so.
The news on the economic front was mixed. The National Association of Realtors said that home prices fell in 8 out of every 10 US cities last quarter. Sellers continue to lower prices to attract buyers which has caused the price of the average home to decline to $177,900 which is -11% below Q3 2008's levels. Distressed sales, a.k.a. deeply discounted sales, made up 30% of all deals according to their data. The good news in the report was that home sales continued to climb and two dozen cities saw home prices actually climb! Remember the ideal scenario for the real-estate market to recover will be higher home prices coupled with more sales.
PICTURED: The Dow Jones Industrial Average continues to outperform its peers. It just hit a fresh 2009 high while all the other major averages ended lower on Tuesday.
|
|
|
 |
Retail Index Climbs To Another New 2009 High
Kenneth J. Gruneisen - Passed the CAN SLIM® Master's Exam
The tech sector was mixed as the Networking Index ($NWX -2.00%) was a standout laggard, meanwhile the Semiconductor Index ($SOX +0.08%) held its ground, and the Biotechnology Index ($BTK +0.40%) and Internet Index ($IIX +0.54%) posted modest gains. Modest gains from the Retail Index ($RLX +0.52%) and Healthcare Index ($HMO +0.76%) also helped. The Gold & Silver Index ($XAU +0.18%) and Integrated Oil Index ($XOI +0.27%) posted very small gains while the Oil Services Index ($OSX -0.52%) fell slightly more percentage-wise. The Broker/Dealer Index ($XBD -0.06%) essentially held its ground, but the Bank Index ($BKX -1.42%) backpedaled.
Charts courtesy www.stockcharts.com
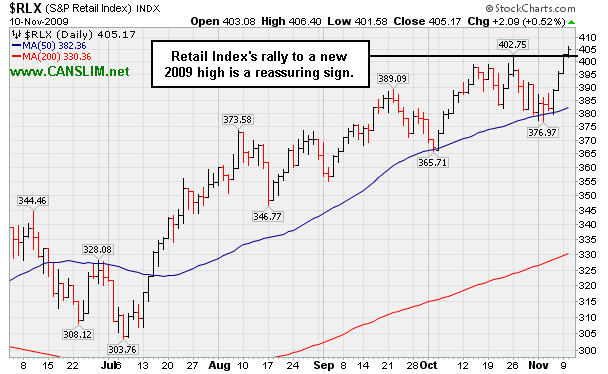
PICTURED: The Retail Index's ($RLX +0.52%) rally to a new 2009 high is a reassuring sign.
| Oil Services |
$OSX |
199.96 |
-1.04 |
-0.52% |
+64.73% |
| Healthcare |
$HMO |
1,311.16 |
+9.90 |
+0.76% |
+36.55% |
| Integrated Oil |
$XOI |
1,101.10 |
+2.94 |
+0.27% |
+12.39% |
| Semiconductor |
$SOX |
311.52 |
+0.26 |
+0.08% |
+46.83% |
| Networking |
$NWX |
224.06 |
-4.57 |
-2.00% |
+55.72% |
| Internet |
$IIX |
224.00 |
+1.21 |
+0.54% |
+67.45% |
| Broker/Dealer |
$XBD |
117.76 |
-0.07 |
-0.06% |
+52.01% |
| Retail |
$RLX |
405.17 |
+2.09 |
+0.52% |
+45.09% |
| Gold & Silver |
$XAU |
181.18 |
+0.33 |
+0.18% |
+46.29% |
| Bank |
$BKX |
43.73 |
-0.63 |
-1.42% |
-1.33% |
| Biotech |
$BTK |
899.85 |
+3.60 |
+0.40% |
+39.04% |
|
|
|
 |
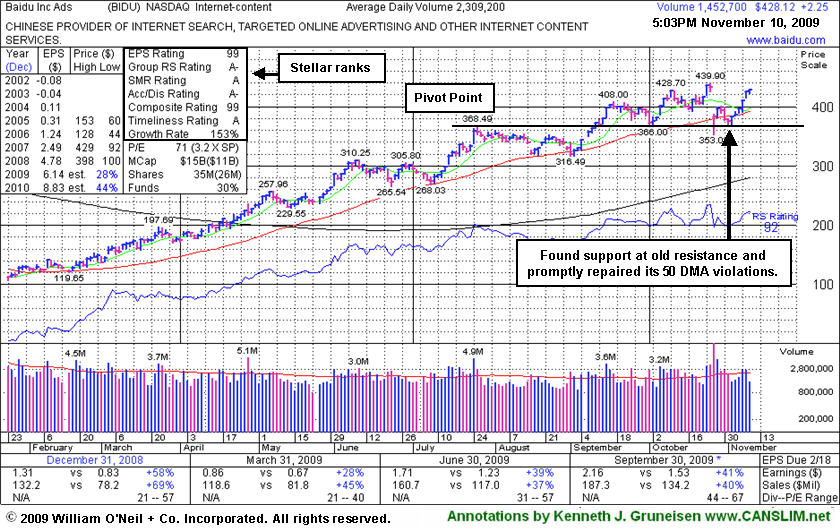
Baidu Recently Proved Resilient After Sharp Sell Off On Earnings News
Kenneth J. Gruneisen - Passed the CAN SLIM® Master's Exam
Baidu.com, Inc. (BIDU +$2.25 or +0.53% to $428.12) today posted its 6th consecutive gain on light or near average volume. It proved resilient near its 50 DMA line after its 10/27/09 gap down. It made an admirable stand above prior chart highs (that were the basis for its previously cited pivot point) since its last appearance in this FSU section on 10/28/09 under the headline "Chinese Internet Content Firm Gapped Down To Classic Chart Support Level". In that report it was observed that, "Whenever a stock which has made a many-fold run up in price flashes its largest point loss on the highest volume down day in more than 10 months, such clearly negative action may be considered a technical sell signal."
Broader market (M criteria) weakness and distributional pressure on the major market averages at the time heightened concerns investors might have while holding any stocks. Since then, however, the market dug its heels in and produced a solid follow through day. The stock also proved its resilience, but as recently noted, "Choppy action has not allowed it to form a sound base in recent weeks." Patience may allow for a proper base to form, however there is not an ideal entry point under the guidelines now.
BIDU traded up as much as +23% from its price when featured in yellow in the 9/08/09 Mid-Day BreakOuts Report (read here). The number of top-rated funds owning BIDU's shares rose from 112 in Sept '08 to 160 in Jun '09, clear evidence its shares were being accumulated. An earlier FSU appearance described some of the more extensive prior coverage this Chinese Internet search provider has received (read here).
|
|
|
Color Codes Explained :
Y - Better candidates highlighted by our
staff of experts.
G - Previously featured
in past reports as yellow but may no longer be buyable under the
guidelines.
***Last / Change / Volume quote data in this table corresponds with the timestamp on the note***
Symbol/Exchange
Company Name
Industry Group |
Last |
Chg. |
Vol
% DAV |
Date Featured |
Price Featured |
Latest Pivot Point
Featured |
Status |
| Latest Max Buy Price |
ARST
-
|
$26.72
|
+0.47
|
396,437
59% DAV
670,900
|
9/1/2009
(Date
Featured) |
$19.91
(Price
Featured) |
PP = $20.90 |
G |
| MB = $21.95 |
Most Recent Note - 11/10/2009 4:48:53 PM
G - Rallied today on light volume for a 5th consecutive gain and another new all-time high. Color code remains green while dismissing its 10/15/09 high as a new pivot point, with concern over its "late stage" action without a recent base of substantial length. ARST was first featured in yellow at $19.91 in the 9/01/09 mid-day report with an annotated daily graph (read here).
>>> The latest Featured Stock Update with an annotated graph appeared on 11/6/2009. click here.
|
|
C
A
S
I |
News |
Chart |
SEC
View all notes Alert
me of new notes
Company
Profile
|
ASIA
-
|
$25.03
|
+0.08
|
1,141,373
142% DAV
805,700
|
10/14/2009
(Date
Featured) |
$23.05
(Price
Featured) |
PP = $22.19 |
G |
| MB = $23.30 |
Most Recent Note - 11/10/2009 4:50:59 PM
G - Small gain today for another new 52-week high, getting extended from its latest sound base. Featured 10/14/09 in the mid-day report (read here) as it gapped up for a new 52-week high with 5 times average volume, triggering a technical buy signal by blasting above its pivot point. First featured in the August 2009 CANSLIM.net News (read here).
>>> The latest Featured Stock Update with an annotated graph appeared on 10/30/2009. click here.
|
|
C
A
S
I |
News |
Chart |
SEC
View all notes Alert
me of new notes
Company
Profile
|
BIDU
- NASDAQ
Baidu Inc Ads
INTERNET - Internet Information Providers
|
$428.12
|
+2.25
|
1,456,943
75% DAV
1,932,400
|
9/8/2009
(Date
Featured) |
$351.80
(Price
Featured) |
PP = $368.59 |
G |
| MB = $387.02 |
Most Recent Note - 11/10/2009 4:53:20 PM
G - Gain today was its 6th consecutive gain on light or near average volume. Proved resilient near its 50 DMA line after its 10/27/09 gap down. As recently noted, "Choppy action has not allowed it to form a sound base in recent weeks." BIDU traded up as much as +23% from its price when featured in yellow in the 9/08/09 Mid-Day BreakOuts Report (read here).
>>> The latest Featured Stock Update with an annotated graph appeared on 11/10/2009. click here.
|
|
C
A
S
I |
News |
Chart |
SEC
View all notes Alert
me of new notes
Company
Profile
|
CACC
- NASDAQ
Credit Acceptance Corp
FINANCIAL SERVICES - Credit Services
|
$33.86
|
-0.53
|
64,049
168% DAV
38,200
|
9/29/2009
(Date
Featured) |
$33.48
(Price
Featured) |
PP = $32.60 |
G |
| MB = $34.23 |
Most Recent Note - 11/10/2009 4:57:49 PM
G - Negative reversal for a loss today with higher volume indicates distributional pressure. Still consolidating in an orderly fashion above prior chart highs and its 50 DMA line in the $32 area, coinciding as an important support level to watch on pullbacks. The Finance - Consumer/Commercial Loans firm has maintained a great track record of annual and quarterly sales revenues and earnings increases. It was featured on 9/29/09 in yellow in the mid-day report (read here).
>>> The latest Featured Stock Update with an annotated graph appeared on 11/5/2009. click here.
|
|
C
A
S
I |
News |
Chart |
SEC
View all notes Alert
me of new notes
Company
Profile
|
CRM
- NYSE
Salesforce.com Inc
INTERNET - Internet Software & Services
|
$63.67
|
+0.18
|
1,586,987
79% DAV
2,012,800
|
8/16/2009
(Date
Featured) |
$47.12
(Price
Featured) |
PP = $45.59 |
G |
| MB = $47.87 |
Most Recent Note - 11/10/2009 4:59:50 PM
G - Gain today on average volume for a new 2009 high close. Found support and rallied up from its 50 DMA line last week after noted technical deterioration raised some concerns. Recent chart lows in the $56 area are important support now, and any violation would raise more serious concerns and trigger more worrisome technical sell signals.
>>> The latest Featured Stock Update with an annotated graph appeared on 11/9/2009. click here.
|
|
C
A
S
I |
News |
Chart |
SEC
View all notes Alert
me of new notes
Company
Profile
|
GMCR
- NASDAQ
Green Mtn Coffee Roastrs
FOOD & BEVERAGE - Processed & Packaged Goods
|
$73.14
|
+2.47
|
1,809,705
149% DAV
1,213,500
|
10/5/2009
(Date
Featured) |
$71.11
(Price
Featured) |
PP = $75.89 |
G |
| MB = $79.68 |
Most Recent Note - 11/10/2009 5:01:51 PM
G - Gain today on above average volume indicates accumulation while rising up from its 50 DMA line ($68.79). Deterioration under its 50 DMA or recent lows near $65 would raise more serious concerns.
>>> The latest Featured Stock Update with an annotated graph appeared on 10/29/2009. click here.
|
|
C
A
S
I |
News |
Chart |
SEC
View all notes Alert
me of new notes
Company
Profile
|
|
|
|
THESE ARE NOT BUY RECOMMENDATIONS!
Comments contained in the body of this report are technical
opinions only. The material herein has been obtained
from sources believed to be reliable and accurate, however,
its accuracy and completeness cannot be guaranteed.
This site is not an investment advisor, hence it does
not endorse or recommend any securities or other investments.
Any recommendation contained in this report may not
be suitable for all investors and it is not to be deemed
an offer or solicitation on our part with respect to
the purchase or sale of any securities. All trademarks,
service marks and trade names appearing in this report
are the property of their respective owners, and are
likewise used for identification purposes only.
This report is a service available
only to active Paid Premium Members.
You may opt-out of receiving report notifications
at any time. Questions or comments may be submitted
by writing to Premium Membership Services 665 S.E. 10 Street, Suite 201 Deerfield Beach, FL 33441-5634 or by calling 1-800-965-8307
or 954-785-1121.
|
|
|


