You are not logged in.
This means you
CAN ONLY VIEW reports that were published prior to Monday, April 14, 2025.
You
MUST UPGRADE YOUR MEMBERSHIP if you want to see any current reports.
AFTER MARKET UPDATE - FRIDAY, NOVEMBER 9TH, 2012
Previous After Market Report Next After Market Report >>>
|
|
|
|
DOW |
+4.07 |
12,815.39 |
+0.03% |
|
Volume |
740,123,600 |
-2% |
|
Volume |
1,746,174,070 |
-4% |
|
NASDAQ |
+9.29 |
2,904.87 |
+0.32% |
|
Advancers |
1,449 |
46% |
|
Advancers |
1,236 |
49% |
|
S&P 500 |
+2.34 |
1,379.85 |
+0.17% |
|
Decliners |
1,580 |
50% |
|
Decliners |
1,209 |
47% |
|
Russell 2000 |
+1.37 |
795.02 |
+0.17% |
|
52 Wk Highs |
57 |
|
|
52 Wk Highs |
16 |
|
|
S&P 600 |
-3.94 |
457.34 |
-0.85% |
|
52 Wk Lows |
109 |
|
|
52 Wk Lows |
122 |
|
|
 |
Indices Halt Slide But Lack Leadership
Kenneth J. Gruneisen - Passed the CAN SLIM® Master's Exam
For the week, the Dow Jones Industrial Average lost -2.1%, the benchmark S&P 500 Index shed -2.4%, and the Nasdaq Composite Index gave up -2.6%. The Dow Jones Industrial Average and the Nasdaq Composite Index remained below their 200-day moving average (DMA) lines after the week's damaging losses. On Friday's session the major averages posted gains but finished off their session highs. The volume totals were reported lighter on the NYSE and on the Nasdaq exchange versus the prior session's totals. Advancers and decliners were evenly mixed on the NYSE and on the Nasdaq exchange. The total number of stocks hitting new 52-week lows outnumbered new 52-week highs on the NYSE and on the Nasdaq exchange. Leadership also waned as there were 12 high-ranked companies from the CANSLIM.net Leaders List making new 52-week highs and appearing on the CANSLIM.net BreakOuts Page, down from the prior session total of 15 stocks. There were gains for only 6 of the 14 high-ranked companies currently included on the Featured Stocks Page, a list that has been shrinking lately while the market environment has deteriorated.
The major averages found early traction on Friday following Speaker John Boehner's press conference on the fiscal cliff, but the indices retreated from their highs after comments from President Obama indicated a clear difference of opinion between his administration and the republican led congress.
Economic data was mixed with import prices rising more than expected and consumer sentiment topping consensus estimates. Stocks traded in a narrow range throughout Friday's session, and seven of the 10 sectors ended higher, led by an advance in tech stocks. Kayak Software Corp (KYAK +27.80%) on news that it was being acquired by Priceline.com (PCLN -0.32%) in a $1.8 billion deal. On the earnings front, shares of Walt Disney Co (DIS -5.96%) and J.C. Penny Company Inc (JCP -4.84%) were off after the companies posted disappointing profit tallies.
Turning to fixed income markets, Treasuries ended little changed along the curve. The benchmark 10-year note was up 1/32 to yield 1.62% and the 30-year bond was higher by 1/8 of a point to yield 2.75%.
Regular readers may note that this commentary first mentioned a "market correction" on October 11th, calling for reduced market exposure repeatedly if investors were not already completely in cash. During market corrections the M criteria argues against new buying efforts and urges investors to take a defensive stance to protect precious capital. That stance can change back to a bullish stance where buying is encouraged when at least one of the three major averages produces a solid follow-through day (FTD). A FTD confirming a new rally requires substantial gains on higher (ideally above average) volume, coupled with healthy leadership and a respectable number of stocks hitting new 52-week highs. Historic studies have shown that a FTD occurring between Days 4-7 of a new rally effort has often signaled the beginning of the most substantial market rallies.
Investors should always limit losses if ever any stock falls more than -7% from their purchase price. Following strict sell rules is precisely how this fact-based investment system prompts investors to reduce exposure and protect cash during market downturns. Keep a watchlist of strong acting stocks with all-key criteria in anticipation of the next confirmed uptrend. See the noteworthy candidates included on the Featured Stocks Page.
Watch for an announcement via email concerning the next WEBCAST. The webcast will also be available via an updated link highlighted at the top of the Premium Member Homepage.
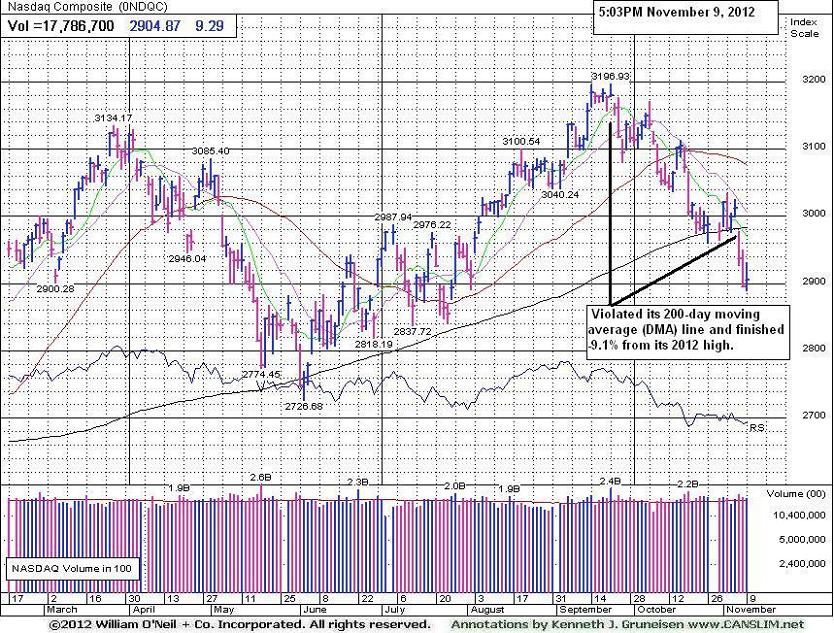
PICTURED: The Nasdaq Composite Index is below its 200-day moving average (DMA) line (2,983.38) and the tech-heavy index finished the week -9.1% off its 2012 high hit on September 21, 2012. In early-June it promptly found support after undercutting its 200 DMA line. While the major indices linger below their 200 DMA lines the risk of more serious losses becomes a greater concern. Bargain hunting is never a part of the fact-based approach supported by CANSLIM.net. Until the major averages produce a new confirmed rally with a follow-through day, disciplined investors know that it is most important to be protecting cash.
|
 Kenneth J. Gruneisen started out as a licensed stockbroker in August 1987, a couple of months prior to the historic stock market crash that took the Dow Jones Industrial Average down -22.6% in a single day. He has published daily fact-based fundamental and technical analysis on high-ranked stocks online for two decades. Through FACTBASEDINVESTING.COM, Kenneth provides educational articles, news, market commentary, and other information regarding proven investment systems that work in good times and bad.
Comments contained in the body of this report are technical opinions only and are not necessarily those of Gruneisen Growth Corp. The material herein has been obtained from sources believed to be reliable and accurate, however, its accuracy and completeness cannot be guaranteed. Our firm, employees, and customers may effect transactions, including transactions contrary to any recommendation herein, or have positions in the securities mentioned herein or options with respect thereto. Any recommendation contained in this report may not be suitable for all investors and it is not to be deemed an offer or solicitation on our part with respect to the purchase or sale of any securities. |
|
 |
Tech Sector Helps Market Halt Slide
Kenneth J. Gruneisen - Passed the CAN SLIM® Master's Exam
The tech sector saw modest gains from the Semiconductor Index ($SOX +0.24%), Networking Index ($NWX +0.44%), and the Internet Index ($IIX +0.57%) while the Biotechnology Index ($BTK +1.60%) was a leading gainer. The Broker/Dealer Index ($XBD -0.55%) lost ground while the Bank Index ($BKX +0.08%) held its ground. Energy-related shares remained quiet as the Integrated Oil Index ($XOI -0.10%) and Oil Services Index ($OSX +0.07%) were little changed on the session. The Healthcare Index ($HMO +0.14%) inched higher, meanwhile the Gold & Silver Index ($XAU -1.37%) was a standout decliner.
Charts courtesy www.stockcharts.com
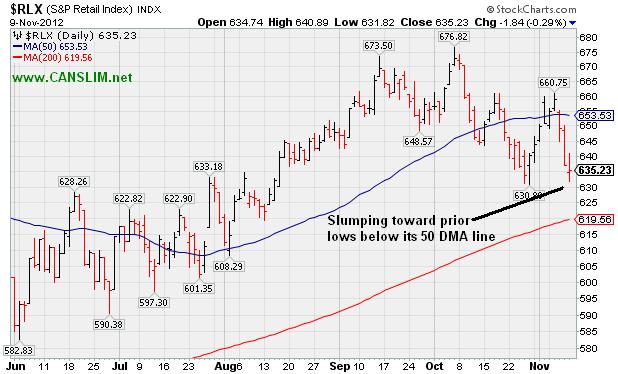
PICTURED: The Retail Index ($RLX -0.90%) is slumping toward prior lows below its 50-day moving average (DMA) line.
| Oil Services |
$OSX |
209.41 |
+0.14 |
+0.07% |
-3.18% |
| Healthcare |
$HMO |
2,465.80 |
+3.41 |
+0.14% |
+8.07% |
| Integrated Oil |
$XOI |
1,201.59 |
-1.20 |
-0.10% |
-2.24% |
| Semiconductor |
$SOX |
369.70 |
+0.90 |
+0.24% |
+1.44% |
| Networking |
$NWX |
200.54 |
+0.87 |
+0.44% |
-6.80% |
| Internet |
$IIX |
305.59 |
+1.73 |
+0.57% |
+8.46% |
| Broker/Dealer |
$XBD |
82.10 |
-0.46 |
-0.55% |
-1.41% |
| Retail |
$RLX |
650.90 |
-5.89 |
-0.90% |
+24.41% |
| Gold & Silver |
$XAU |
181.11 |
-2.52 |
-1.37% |
+0.26% |
| Bank |
$BKX |
48.13 |
+0.04 |
+0.08% |
+22.22% |
| Biotech |
$BTK |
1,444.04 |
+22.68 |
+1.60% |
+32.31% |
|
|
|
 |
Distributional Action in Stock and Broader Market
Kenneth J. Gruneisen - Passed the CAN SLIM® Master's Exam
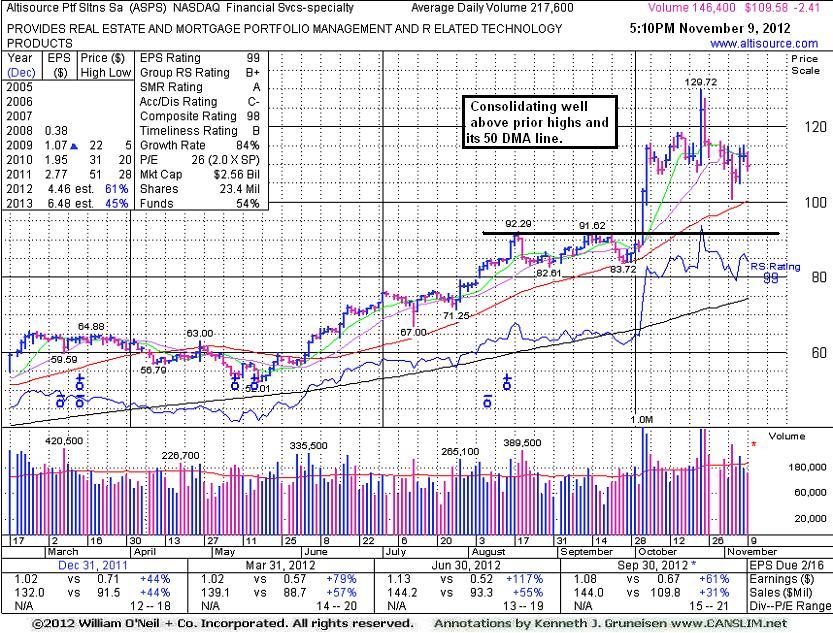
Altisource Portfolio Solutions Sa (ASPS -$2.41 or -2.15% to $109.58) rallied back this week following a spurt of distributional losses with above average volume. Important support to watch is at its 50-day moving average (DMA) line, then prior highs in the $92 area define the next chart support level. It was recently noted as "Very extended from its latest base." Its current Up/Down Volume Ratio of 1.2 is an unbiased indication its shares have been under accumulation over the past 50 days, however its Accumulation/Distribution rating slumped to a C- from a B when last shown in this FSU section on 10/12/12 with an annotated graph under the headline, "New High Close Following Latest Breakout". It subsequently blasted as high as $129.72 on 10/24/12, trading up +116% from when first featured in yellow in the June 5, 2012 mid-day report (read here).
On 9/24/2012 its color code was changed to yellow with new pivot point cited based on its 8/20/12 high plus 10 cents. On 10/03/12 its volume-driven gain above its pivot point triggered a new (or add-on) technical buy signal and it quickly got extended beyond its "max buy" level. Time will tell if it might form another sound base pattern, however the market conditions (M criteria) are an overriding concern arguing for greater caution at the current time.
It reported earnings +61% on +31% sales revenues for the quarter ended September 30, 2012 versus the year ago period. Earnings increases have been above the +25% guideline, satisfying the C criteria, and backed by solid sales revenues increases in the 5 latest quarterly comparisons. This Luxembourg-based Financial Services firm's small supply (S criteria) of only 15.4 million shares in the public float can contribute to greater volatility in the event of institutional buying or selling. The number of top-rated funds owning its shares rose from 108 in Sep '11 to 160 in Sep '12, a reassuring sign concerning the I criteria.
|
|
|
Color Codes Explained :
Y - Better candidates highlighted by our
staff of experts.
G - Previously featured
in past reports as yellow but may no longer be buyable under the
guidelines.
***Last / Change / Volume data in this table is the closing quote data***
Symbol/Exchange
Company Name
Industry Group |
PRICE |
CHANGE
(%Change) |
Day High |
Volume
(% DAV)
(% 50 day avg vol) |
52 Wk Hi
% From Hi |
Featured
Date |
Price
Featured |
Pivot Featured |
|
Max Buy |
ASPS
-
NASDAQ
Altisource Ptf Sltns Sa
REAL ESTATE - Property Management/Developmen
|
$109.58
|
-2.41
-2.15% |
$113.07
|
146,491
67.45% of 50 DAV
50 DAV is 217,200
|
$129.72
-15.53%
|
9/24/2012
|
$87.24
|
PP = $92.39
|
|
MB = $97.01
|
 Most Recent Note - 11/9/2012 5:54:50 PM
G - Rallied back this week following a spurt of losses with above average volume. Important support to watch is at its 50 DMA line. See the latest FSU analysis for more details and a new annotated graph.
>>> The latest Featured Stock Update with an annotated graph appeared on 11/9/2012. Click here.
View all notes |
Alert me of new notes |
CANSLIM.net Company Profile |
SEC |
Zacks Reports |
StockTalk |
News |
Chart |
Request a new note
C
A N
S L
I M


|
CFNL
-
NASDAQ
Cardinal Financial Corp
BANKING - Regional - Southeast Banks
|
$15.30
|
-0.06
-0.40% |
$15.58
|
255,592
203.01% of 50 DAV
50 DAV is 125,900
|
$16.21
-5.61%
|
8/17/2012
|
$12.84
|
PP = $13.31
|
|
MB = $13.98
|
Most Recent Note - 11/9/2012 12:24:21 PM
G - Consolidating after getting extended from its prior base, its prior high ($14.79 on 9/24/12) defines initial support to watch above its 50 DMA line. Disciplined investors may watch out for worrisome technical sell signals while awaiting a new base or secondary buy point and more favorable market.
>>> The latest Featured Stock Update with an annotated graph appeared on 10/25/2012. Click here.
View all notes |
Alert me of new notes |
CANSLIM.net Company Profile |
SEC |
Zacks Reports |
StockTalk |
News |
Chart |
Request a new note
C
A N
S L
I M
|
CMCSA
-
NASDAQ
Comcast Corp Cl A
MEDIA - CATV Systems
|
$36.12
|
-0.08
-0.22% |
$36.31
|
12,117,596
96.66% of 50 DAV
50 DAV is 12,536,800
|
$37.96
-4.85%
|
6/11/2012
|
$29.94
|
PP = $30.98
|
|
MB = $32.53
|
Most Recent Note - 11/7/2012 3:57:39 PM
G - Pulling back from its 52-week high today for a 3rd consecutive small loss with slightly above average volume. Reported earnings +39% on +15% sales revenues for the Sep '12 quarter, a reassuring follow-up to the previously noted sub par quarter. Upward trendline and 50 DMA line define near term support where violations would trigger technical sell signals.
>>> The latest Featured Stock Update with an annotated graph appeared on 10/24/2012. Click here.
View all notes |
Alert me of new notes |
CANSLIM.net Company Profile |
SEC |
Zacks Reports |
StockTalk |
News |
Chart |
Request a new note
C
A N
S L
I M
|
DVA
-
NYSE
Davita Healthcare Prtns
HEALTH SERVICES - Specialized Health Services
|
$112.43
|
+0.61
0.55% |
$112.76
|
915,996
109.42% of 50 DAV
50 DAV is 837,100
|
$116.50
-3.49%
|
9/5/2012
|
$102.92
|
PP = $100.62
|
|
MB = $105.65
|
Most Recent Note - 11/8/2012 5:25:57 PM
G - Pulled back with above average volume behind a 2nd consecutive loss while finishing -4% off its 52-week high. Fundamental concerns were raised after it reported earnings +3% on +12% sales for the Sep '12 quarter, below the guidelines of the fact-based system. See the latest FSU analysis for more details and a new annotated graph.
>>> The latest Featured Stock Update with an annotated graph appeared on 11/8/2012. Click here.
View all notes |
Alert me of new notes |
CANSLIM.net Company Profile |
SEC |
Zacks Reports |
StockTalk |
News |
Chart |
Request a new note
C
A N
S L
I M
|
GPX
-
NYSE
G P Strategies Corp
DIVERSIFIED SERVICES - Education and Training Services
|
$20.19
|
+0.01
0.05% |
$20.46
|
27,814
48.37% of 50 DAV
50 DAV is 57,500
|
$20.93
-3.54%
|
10/8/2012
|
$20.00
|
PP = $20.77
|
|
MB = $21.81
|
Most Recent Note - 11/6/2012 4:19:43 PM
G - Today's 4th consecutive gain with above average volume helped it hit a new 52-week high. Recently reported earnings +0% on +12% sales revenues for the Sep '12 quarter, below the +25% minimum earnings guideline, raising fundamental concerns.
>>> The latest Featured Stock Update with an annotated graph appeared on 10/16/2012. Click here.
View all notes |
Alert me of new notes |
CANSLIM.net Company Profile |
SEC |
Zacks Reports |
StockTalk |
News |
Chart |
Request a new note
C
A N
S L
I M
|
Symbol/Exchange
Company Name
Industry Group |
PRICE |
CHANGE
(%Change) |
Day High |
Volume
(% DAV)
(% 50 day avg vol) |
52 Wk Hi
% From Hi |
Featured
Date |
Price
Featured |
Pivot Featured |
|
Max Buy |
LKQ
-
NASDAQ
L K Q Corp
WHOLESALE - Auto Parts
|
$21.19
|
-0.17
-0.80% |
$21.59
|
1,350,161
84.82% of 50 DAV
50 DAV is 1,591,800
|
$21.95
-3.46%
|
8/9/2012
|
$18.97
|
PP = $18.72
|
|
MB = $19.66
|
Most Recent Note - 11/6/2012 4:21:45 PM
G - Rallied with near average volume today for best-ever close. No resistance remains due to overhead supply. Showed impressive resilience and strength after reporting earnings +6% on +30% sales revenues for the Sep '12 quarter. Results below the +25% minimum earnings guideline (C criteria) raised fundamental concerns.
>>> The latest Featured Stock Update with an annotated graph appeared on 10/19/2012. Click here.
View all notes |
Alert me of new notes |
CANSLIM.net Company Profile |
SEC |
Zacks Reports |
StockTalk |
News |
Chart |
Request a new note
C
A N
S L
I M
|
MIDD
-
NASDAQ
Middleby Corp
MANUFACTURING - Diversified Machinery
|
$124.50
|
+1.91
1.56% |
$125.35
|
112,804
138.58% of 50 DAV
50 DAV is 81,400
|
$127.89
-2.65%
|
10/8/2012
|
$118.46
|
PP = $122.67
|
|
MB = $128.80
|
Most Recent Note - 11/9/2012 4:00:54 PM
Y - Found prompt support at its 50 DMA line this week. Reported earnings +23% on +18% sales for the Sep '12 quarter, below the +25% minimum earnings guideline (C criteria). The M criteria remains an overriding concern until a FTD confirms a new rally.
>>> The latest Featured Stock Update with an annotated graph appeared on 10/22/2012. Click here.
View all notes |
Alert me of new notes |
CANSLIM.net Company Profile |
SEC |
Zacks Reports |
StockTalk |
News |
Chart |
Request a new note
C
A N
S L
I M
|
N
-
NYSE
Netsuite Inc
DIVERSIFIED SERVICES - Business/Management Services
|
$60.66
|
+0.66
1.10% |
$61.16
|
352,573
68.24% of 50 DAV
50 DAV is 516,700
|
$67.02
-9.49%
|
8/20/2012
|
$55.88
|
PP = $59.32
|
|
MB = $62.29
|
Most Recent Note - 11/9/2012 4:02:24 PM
G - Consolidating near its 50 DMA line today -9.3% off its 52-week high. It did not form a sound new base pattern. Until the major averages are back in a confirmed rally the M criteria argues against any new buying efforts. Reported earnings +60% on +31% sales revenues for the Sep '12 quarter.
>>> The latest Featured Stock Update with an annotated graph appeared on 10/26/2012. Click here.
View all notes |
Alert me of new notes |
CANSLIM.net Company Profile |
SEC |
Zacks Reports |
StockTalk |
News |
Chart |
Request a new note
C
A N
S L
I M
|
OSIS
-
NASDAQ
O S I Systems Inc
ELECTRONICS - Semiconductor Equipment and Mate
|
$77.74
|
+0.46
0.60% |
$78.29
|
72,818
63.71% of 50 DAV
50 DAV is 114,300
|
$81.23
-4.30%
|
9/5/2012
|
$74.39
|
PP = $75.10
|
|
MB = $78.86
|
Most Recent Note - 11/7/2012 1:21:13 PM
G - Pulling back from its 52-week high today with a loss on light volume. Recently found prompt support at its 50 DMA line, and it is still slightly extended from its prior base.
>>> The latest Featured Stock Update with an annotated graph appeared on 10/18/2012. Click here.
View all notes |
Alert me of new notes |
CANSLIM.net Company Profile |
SEC |
Zacks Reports |
StockTalk |
News |
Chart |
Request a new note
C
A N
S L
I M
|
RAX
-
NYSE
Rackspace Hosting Inc
INTERNET - Internet Software and; Services
|
$60.48
|
-1.06
-1.72% |
$61.17
|
2,601,913
150.55% of 50 DAV
50 DAV is 1,728,300
|
$69.81
-13.36%
|
11/6/2012
|
$65.44
|
PP = $69.91
|
|
MB = $73.41
|
Most Recent Note - 11/9/2012 3:57:41 PM
G - Recently slumping well below its 50 DMA line with damaging volume-driven losses. A rebound above that short-term average is needed for its technical stance to improve.
>>> The latest Featured Stock Update with an annotated graph appeared on 11/6/2012. Click here.
View all notes |
Alert me of new notes |
CANSLIM.net Company Profile |
SEC |
Zacks Reports |
StockTalk |
News |
Chart |
Request a new note
C
A N
S L
I M
|
Symbol/Exchange
Company Name
Industry Group |
PRICE |
CHANGE
(%Change) |
Day High |
Volume
(% DAV)
(% 50 day avg vol) |
52 Wk Hi
% From Hi |
Featured
Date |
Price
Featured |
Pivot Featured |
|
Max Buy |
RNF
-
NYSE
Rentech Nitrogen Ptnr Lp
CHEMICALS - Agricultural Chemicals
|
$37.54
|
-0.85
-2.21% |
$38.13
|
312,039
81.26% of 50 DAV
50 DAV is 384,000
|
$41.15
-8.77%
|
11/1/2012
|
$39.11
|
PP = $40.15
|
|
MB = $42.16
|
Most Recent Note - 11/9/2012 3:59:32 PM
Y - Gapped down today. Endured distributional pressure amid a negative market (M criteria) after hitting a new 52-week high on 11/02/12 and a worrisome "negative reversal" for a loss with above average volume.
>>> The latest Featured Stock Update with an annotated graph appeared on 11/2/2012. Click here.
View all notes |
Alert me of new notes |
CANSLIM.net Company Profile |
SEC |
Zacks Reports |
StockTalk |
News |
Chart |
Request a new note
C
A N
S L
I M
|
TDG
-
NYSE
Transdigm Group Inc
AEROSPACE/DEFENSE - Aerospace/Defense Products and; Services
|
$137.32
|
+0.17
0.12% |
$138.21
|
242,889
48.01% of 50 DAV
50 DAV is 505,900
|
$140.49
-2.26%
|
8/16/2012
|
$132.23
|
PP = $136.44
|
|
MB = $143.26
|
Most Recent Note - 11/6/2012 4:28:00 PM
G - Hit a new high (following a 10/23/12 special dividend) with today's gain on light volume. When noted on 10/23/12 it undercut its 50 DMA line, yet it promptly rebounded back above that important short-term average.
>>> The latest Featured Stock Update with an annotated graph appeared on 10/23/2012. Click here.
View all notes |
Alert me of new notes |
CANSLIM.net Company Profile |
SEC |
Zacks Reports |
StockTalk |
News |
Chart |
Request a new note
C
A N
S L
I M
|
VSI
-
NYSE
Vitamin Shoppe Inc
SPECIALTY RETAIL - Specialty Retail, Other
|
$57.73
|
-0.21
-0.36% |
$58.99
|
271,871
95.29% of 50 DAV
50 DAV is 285,300
|
$61.89
-6.72%
|
10/15/2012
|
$57.82
|
PP = $60.08
|
|
MB = $63.08
|
Most Recent Note - 11/8/2012 5:28:24 PM
Y - Pulled back again today and its volume-driven loss led to a close back in its prior base, completely negating its 11/06/12 breakout. It released better than expected earnings +35% on +14% sales revenues for the Sep '12 quarter. Keep in mind the M criteria which argues against new buying efforts until the market is back in a confirmed rally.
>>> The latest Featured Stock Update with an annotated graph appeared on 10/15/2012. Click here.
View all notes |
Alert me of new notes |
CANSLIM.net Company Profile |
SEC |
Zacks Reports |
StockTalk |
News |
Chart |
Request a new note
C
A N
S L
I M
|
WPI
-
NYSE
Watson Pharmaceuticals
DRUGS - Drugs - Generic
|
$85.11
|
-0.61
-0.71% |
$85.99
|
693,408
79.08% of 50 DAV
50 DAV is 876,800
|
$90.00
-5.43%
|
8/24/2012
|
$82.90
|
PP = $81.10
|
|
MB = $85.16
|
Most Recent Note - 11/7/2012 3:55:28 PM
G - Consolidating just -2.9% off its 52-week high today after recently finding support at its 50 DMA line. Reported earnings +24% on +19% sales revenues for the Sep '12 quarter, a notch below the +25% minimum guideline (C criteria). It has not formed a sound base and it is extended from a proper buy point under the fact-based system's guidelines.
>>> The latest Featured Stock Update with an annotated graph appeared on 11/1/2012. Click here.
View all notes |
Alert me of new notes |
CANSLIM.net Company Profile |
SEC |
Zacks Reports |
StockTalk |
News |
Chart |
Request a new note
C
A N
S L
I M
|
|
|
|
THESE ARE NOT BUY RECOMMENDATIONS!
Comments contained in the body of this report are technical
opinions only. The material herein has been obtained
from sources believed to be reliable and accurate, however,
its accuracy and completeness cannot be guaranteed.
This site is not an investment advisor, hence it does
not endorse or recommend any securities or other investments.
Any recommendation contained in this report may not
be suitable for all investors and it is not to be deemed
an offer or solicitation on our part with respect to
the purchase or sale of any securities. All trademarks,
service marks and trade names appearing in this report
are the property of their respective owners, and are
likewise used for identification purposes only.
This report is a service available
only to active Paid Premium Members.
You may opt-out of receiving report notifications
at any time. Questions or comments may be submitted
by writing to Premium Membership Services 665 S.E. 10 Street, Suite 201 Deerfield Beach, FL 33441-5634 or by calling 1-800-965-8307
or 954-785-1121.
|
|
|

