You are not logged in.
This means you
CAN ONLY VIEW reports that were published prior to Monday, April 14, 2025.
You
MUST UPGRADE YOUR MEMBERSHIP if you want to see any current reports.
AFTER MARKET UPDATE - THURSDAY, NOVEMBER 8TH, 2012
Previous After Market Report Next After Market Report >>>
|
|
|
|
DOW |
-121.41 |
12,811.32 |
-0.94% |
|
Volume |
758,542,390 |
-14% |
|
Volume |
1,820,817,970 |
-9% |
|
NASDAQ |
-41.71 |
2,895.58 |
-1.42% |
|
Advancers |
825 |
26% |
|
Advancers |
642 |
25% |
|
S&P 500 |
-17.02 |
1,377.51 |
-1.22% |
|
Decliners |
2,238 |
71% |
|
Decliners |
1,812 |
71% |
|
Russell 2000 |
-10.87 |
793.65 |
-1.35% |
|
52 Wk Highs |
59 |
|
|
52 Wk Highs |
32 |
|
|
S&P 600 |
-3.94 |
457.34 |
-0.85% |
|
52 Wk Lows |
77 |
|
|
52 Wk Lows |
108 |
|
|
 |
Major Averages Showed No Ability to Rally
Kenneth J. Gruneisen - Passed the CAN SLIM® Master's Exam
The major averages failed to muster any strength to rally and the market correction worsened on Thursday. The volume totals were reported lighter on the NYSE and on the Nasdaq exchange versus the prior session's totals. Breadth was very negative as decliners led advancers by nearly a 3-1 margin on the NYSE and on the Nasdaq exchange. The total number of stocks hitting new 52-week lows outnumbered new 52-week highs on the NYSE and on the Nasdaq exchange. There were 15 high-ranked companies from the CANSLIM.net Leaders List making new 52-week highs and appearing on the CANSLIM.net BreakOuts Page, down from the prior session total of 16 stocks. There were gains for only 2 of the 15 high-ranked companies currently included on the Featured Stocks Page.
The Dow Jones Industrial Average and the Nasdaq Composite Index slumped deeper below their recently violated 200-day moving average (DMA) lines, extending the indices' post-election declines as fiscal cliff concerns lingered. Euro zone debt concerns added to the negative tone. The ECB's President said the economic outlook is worsening and an EU official said a decision on unlocking Greek bailout funds may not be made until later this month. Meanwhile, economic data included jobless claims falling 8,000 to 355,000, and the U.S. trade deficit unexpectedly narrowing to $41.5 billion in September to the lowest level in almost two years.
Earnings results were also a factor in some of the session's volatility. Nine of the 10 sectors finished in the red with energy and materials the worst performing. Dow component Exxon Mobil Corp (XOM -1.26%) , and miner Cliff Natural Resources Inc (CLF -3.10%) declined. Consumer stocks underperformed with McDonalds Corp (MCD -1.99%) falling after reporting disappointing October same store sales. Over in tech, Apple Inc (AAPL -3.63%) traded down to extend its decline from its September high to -23.0%. Qualcomm Inc (QCOM +4.39%) rallied after topping earnings expectations and posting a better-than-expected full-year forecast. Dean Foods Co (DF +1.99%) also bested street projections and raised its guidance which pushed its shares up. Overall, nearly all sectors were lower. Materials and energy stocks paced the decline while the defensive utilities sector held onto gains.
In fixed-income, Treasuries were higher with the 10-year note rising 5/8 of a point to yield 1.61%.
Regular readers may note that this commentary first mentioned a "market correction" on October 11th, calling for reduced market exposure repeatedly if investors were not already completely in cash. During market corrections the M criteria argues against new buying efforts and urges investors to take a defensive stance to protect precious capital. That stance can change back to a bullish stance where buying is encouraged when at least one of the three major averages produces a solid follow-through day (FTD). A FTD confirming a new rally requires substantial gains on higher (ideally above average) volume, coupled with healthy leadership and a respectable number of stocks hitting new 52-week highs. Historic studies have shown that a FTD occurring between Days 4-7 of a new rally effort has often signaled the beginning of the most substantial market rallies.
Investors should always limit losses if ever any stock falls more than -7% from their purchase price. Following strict sell rules is precisely how this fact-based investment system prompts investors to reduce exposure and protect cash during market downturns. Keep a watchlist of strong acting stocks with all-key criteria in anticipation of the next confirmed uptrend. See the noteworthy candidates included on the Featured Stocks Page.
Watch for an announcement via email concerning the next WEBCAST. The webcast will also be available via an updated link highlighted at the top of the Premium Member Homepage.
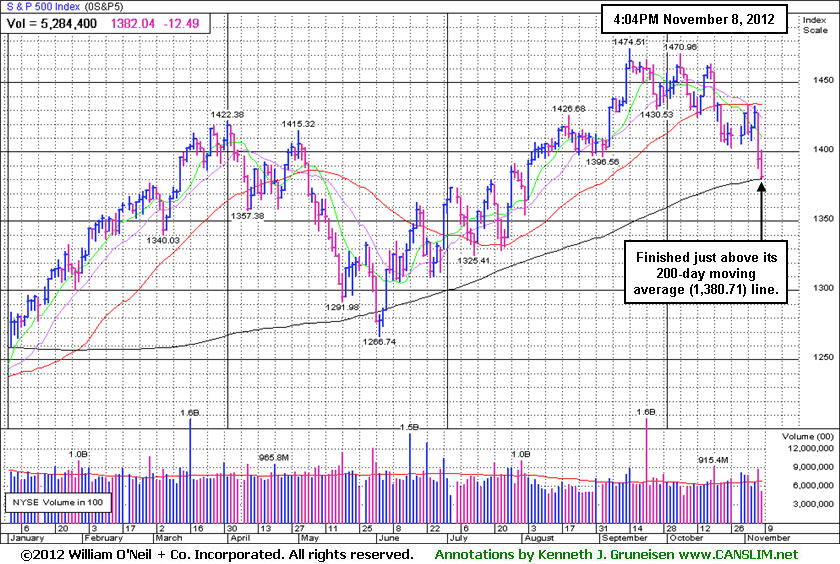
PICTURED: The S&P 500 Index finished just above its 200-day moving average (DMA) line (1,380.71). Back in early-June it promptly found support after undercutting that important long-term average. It is likely for the major averages to find support again near their long-term averages, but the risk of more serious losses remains a great concern. Bargain hunting is never a part of the fact-based approach supported by CANSLIM.net. Until the major averages produce a new confirmed rally with a follow-through day, disciplined investors know that it is most important to be protecting cash.
|
 Kenneth J. Gruneisen started out as a licensed stockbroker in August 1987, a couple of months prior to the historic stock market crash that took the Dow Jones Industrial Average down -22.6% in a single day. He has published daily fact-based fundamental and technical analysis on high-ranked stocks online for two decades. Through FACTBASEDINVESTING.COM, Kenneth provides educational articles, news, market commentary, and other information regarding proven investment systems that work in good times and bad.
Comments contained in the body of this report are technical opinions only and are not necessarily those of Gruneisen Growth Corp. The material herein has been obtained from sources believed to be reliable and accurate, however, its accuracy and completeness cannot be guaranteed. Our firm, employees, and customers may effect transactions, including transactions contrary to any recommendation herein, or have positions in the securities mentioned herein or options with respect thereto. Any recommendation contained in this report may not be suitable for all investors and it is not to be deemed an offer or solicitation on our part with respect to the purchase or sale of any securities. |
|
 |
Energy, Financial, Tech, and Healthcare Groups Fell
Kenneth J. Gruneisen - Passed the CAN SLIM® Master's Exam
Energy-related shares were weaker as the Oil Services Index ($OSX -2.47%) and Integrated Oil Index ($XOI -1.40%) led the groups in decline on Thursday. A loss for the Retail Index ($RLX -0.90%) and weakness in the Broker/Dealer Index ($XBD -1.31%) and the Bank Index ($BKX -0.62%) was also a negative influence on the major averages. The Semiconductor Index ($SOX -1.20%), Internet Index ($IIX -0.84%), and the Biotechnology Index ($BTK -0.71%) lost ground while the Networking Index ($NWX -0.09%) finished flat. Defensive groups were mixed - the Healthcare Index ($HMO -2.18%) tumbled, yet the Gold & Silver Index ($XAU +0.68%) was a standout as it edged higher.
Charts courtesy www.stockcharts.com
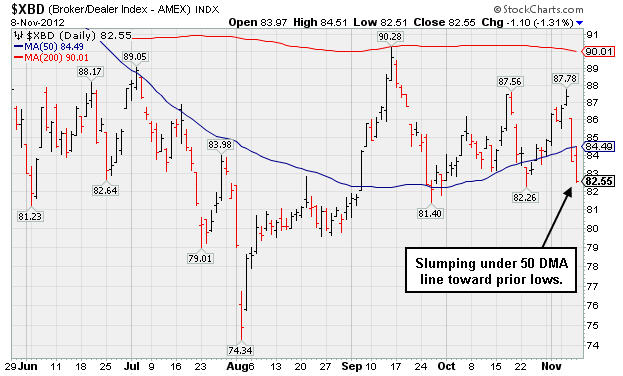
PICTURED: The Broker/Dealer Index ($XBD -1.31%) slumped under its 50-day moving average line toward prior lows.
| Oil Services |
$OSX |
209.27 |
-5.31 |
-2.47% |
-3.24% |
| Healthcare |
$HMO |
2,462.39 |
-54.94 |
-2.18% |
+7.92% |
| Integrated Oil |
$XOI |
1,202.79 |
-17.06 |
-1.40% |
-2.14% |
| Semiconductor |
$SOX |
368.80 |
-4.47 |
-1.20% |
+1.20% |
| Networking |
$NWX |
199.67 |
-0.18 |
-0.09% |
-7.20% |
| Internet |
$IIX |
303.86 |
-2.59 |
-0.84% |
+7.85% |
| Broker/Dealer |
$XBD |
82.55 |
-1.10 |
-1.31% |
-0.86% |
| Retail |
$RLX |
650.90 |
-5.89 |
-0.90% |
+24.41% |
| Gold & Silver |
$XAU |
183.63 |
+1.24 |
+0.68% |
+1.66% |
| Bank |
$BKX |
48.09 |
-0.30 |
-0.62% |
+22.12% |
| Biotech |
$BTK |
1,421.35 |
-10.10 |
-0.71% |
+30.23% |
|
|
|
 |
Weak Earnings Increase Raises Concern After 7 Weekly Gains
Kenneth J. Gruneisen - Passed the CAN SLIM® Master's Exam
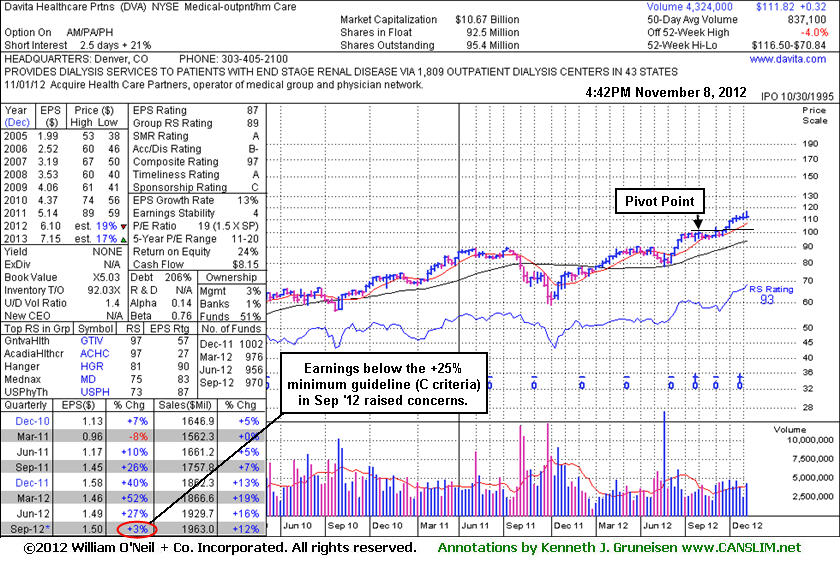
Davita Inc (DVA -$1.00 or -0.89% to $111.82) finished -4% off its 52-week high today with volume running at an above average pace behind a 2nd consecutive loss. Fundamental concerns were raised after it reported earnings +3% on +12% sales for the Sep '12 quarter, below the +25% guideline (C criteria) of the fact-based system. Disciplined investors might be inclined to give it the benefit of the doubt until technical sell signals argue more seriously for exiting, however, keep in mind that the M criteria argues in favor of protecting profits and reducing market exposure when the major averages are in a serious correction.
It may be on the cusp of closing out an 8th consecutive weekly gain. The stock was recently noted as - "Extended from its latest sound base." Prior highs and its 50-day moving average (DMA) line define near-term support to watch on pullbacks where violations may trigger technical sell signals. It was last shown in this FSU section on 10/10/12 with an annotated graph under the headline, "Extended From Base Following More Volume-Driven Gains ", yet it went on to rally higher into new high territory getting even more extended from its latest sound base. Disciplined investors avoid chasing extended stocks.
The Medical - Outpatient/Home Care firm has earned great ranks, and the industry group has a Group Relative Strength Rating of 89, a reassuring sign concerning the L criteria. It has shown steady annual earnings (A criteria) growth. Ownership by top-rated funds rose from 955 in Jun '12 to 970 in Sep '12, a slightly reassuring sign concerning the I criteria.
|
|
|
Color Codes Explained :
Y - Better candidates highlighted by our
staff of experts.
G - Previously featured
in past reports as yellow but may no longer be buyable under the
guidelines.
***Last / Change / Volume data in this table is the closing quote data***
Symbol/Exchange
Company Name
Industry Group |
PRICE |
CHANGE
(%Change) |
Day High |
Volume
(% DAV)
(% 50 day avg vol) |
52 Wk Hi
% From Hi |
Featured
Date |
Price
Featured |
Pivot Featured |
|
Max Buy |
ASPS
-
NASDAQ
Altisource Ptf Sltns Sa
REAL ESTATE - Property Management/Developmen
|
$111.99
|
+0.05
0.04% |
$115.15
|
171,552
78.98% of 50 DAV
50 DAV is 217,200
|
$129.72
-13.67%
|
9/24/2012
|
$87.24
|
PP = $92.39
|
|
MB = $97.01
|
Most Recent Note - 11/7/2012 1:23:24 PM
G - Rallying today with higher volume following a spurt of losses with above average volume. Important support to watch is at its 50 DMA line.
>>> The latest Featured Stock Update with an annotated graph appeared on 10/12/2012. Click here.
View all notes |
Alert me of new notes |
CANSLIM.net Company Profile |
SEC |
Zacks Reports |
StockTalk |
News |
Chart |
Request a new note
C
A N
S L
I M


|
CFNL
-
NASDAQ
Cardinal Financial Corp
BANKING - Regional - Southeast Banks
|
$15.36
|
-0.44
-2.77% |
$15.82
|
181,863
144.45% of 50 DAV
50 DAV is 125,900
|
$16.21
-5.23%
|
8/17/2012
|
$12.84
|
PP = $13.31
|
|
MB = $13.98
|
 Most Recent Note - 11/8/2012 5:30:11 PM
G - Pulled back for a 2nd consecutive session with above average volume while retreating from its 52-week high. It is extended from its prior base. Prior high ($14.79 on 9/24/12) defines initial support to watch above its 50 DMA line on pullbacks.
>>> The latest Featured Stock Update with an annotated graph appeared on 10/25/2012. Click here.
View all notes |
Alert me of new notes |
CANSLIM.net Company Profile |
SEC |
Zacks Reports |
StockTalk |
News |
Chart |
Request a new note
C
A N
S L
I M
|
CMCSA
-
NASDAQ
Comcast Corp Cl A
MEDIA - CATV Systems
|
$36.20
|
-0.38
-1.04% |
$36.83
|
11,591,011
92.46% of 50 DAV
50 DAV is 12,536,800
|
$37.96
-4.64%
|
6/11/2012
|
$29.94
|
PP = $30.98
|
|
MB = $32.53
|
Most Recent Note - 11/7/2012 3:57:39 PM
G - Pulling back from its 52-week high today for a 3rd consecutive small loss with slightly above average volume. Reported earnings +39% on +15% sales revenues for the Sep '12 quarter, a reassuring follow-up to the previously noted sub par quarter. Upward trendline and 50 DMA line define near term support where violations would trigger technical sell signals.
>>> The latest Featured Stock Update with an annotated graph appeared on 10/24/2012. Click here.
View all notes |
Alert me of new notes |
CANSLIM.net Company Profile |
SEC |
Zacks Reports |
StockTalk |
News |
Chart |
Request a new note
C
A N
S L
I M
|
DVA
-
NYSE
Davita Healthcare Prtns
HEALTH SERVICES - Specialized Health Services
|
$111.82
|
-1.00
-0.89% |
$113.27
|
1,138,173
135.97% of 50 DAV
50 DAV is 837,100
|
$116.50
-4.02%
|
9/5/2012
|
$102.92
|
PP = $100.62
|
|
MB = $105.65
|
Most Recent Note - 11/8/2012 5:25:57 PM
G - Pulled back with above average volume behind a 2nd consecutive loss while finishing -4% off its 52-week high. Fundamental concerns were raised after it reported earnings +3% on +12% sales for the Sep '12 quarter, below the guidelines of the fact-based system. See the latest FSU analysis for more details and a new annotated graph.
>>> The latest Featured Stock Update with an annotated graph appeared on 11/8/2012. Click here.
View all notes |
Alert me of new notes |
CANSLIM.net Company Profile |
SEC |
Zacks Reports |
StockTalk |
News |
Chart |
Request a new note
C
A N
S L
I M
|
GPX
-
NYSE
G P Strategies Corp
DIVERSIFIED SERVICES - Education and Training Services
|
$20.18
|
-0.29
-1.42% |
$20.64
|
67,044
116.60% of 50 DAV
50 DAV is 57,500
|
$20.93
-3.58%
|
10/8/2012
|
$20.00
|
PP = $20.77
|
|
MB = $21.81
|
Most Recent Note - 11/6/2012 4:19:43 PM
G - Today's 4th consecutive gain with above average volume helped it hit a new 52-week high. Recently reported earnings +0% on +12% sales revenues for the Sep '12 quarter, below the +25% minimum earnings guideline, raising fundamental concerns.
>>> The latest Featured Stock Update with an annotated graph appeared on 10/16/2012. Click here.
View all notes |
Alert me of new notes |
CANSLIM.net Company Profile |
SEC |
Zacks Reports |
StockTalk |
News |
Chart |
Request a new note
C
A N
S L
I M
|
Symbol/Exchange
Company Name
Industry Group |
PRICE |
CHANGE
(%Change) |
Day High |
Volume
(% DAV)
(% 50 day avg vol) |
52 Wk Hi
% From Hi |
Featured
Date |
Price
Featured |
Pivot Featured |
|
Max Buy |
LKQ
-
NASDAQ
L K Q Corp
WHOLESALE - Auto Parts
|
$21.36
|
-0.10
-0.47% |
$21.64
|
1,319,073
82.87% of 50 DAV
50 DAV is 1,591,800
|
$21.95
-2.69%
|
8/9/2012
|
$18.97
|
PP = $18.72
|
|
MB = $19.66
|
Most Recent Note - 11/6/2012 4:21:45 PM
G - Rallied with near average volume today for best-ever close. No resistance remains due to overhead supply. Showed impressive resilience and strength after reporting earnings +6% on +30% sales revenues for the Sep '12 quarter. Results below the +25% minimum earnings guideline (C criteria) raised fundamental concerns.
>>> The latest Featured Stock Update with an annotated graph appeared on 10/19/2012. Click here.
View all notes |
Alert me of new notes |
CANSLIM.net Company Profile |
SEC |
Zacks Reports |
StockTalk |
News |
Chart |
Request a new note
C
A N
S L
I M
|
MIDD
-
NASDAQ
Middleby Corp
MANUFACTURING - Diversified Machinery
|
$122.59
|
-2.06
-1.65% |
$125.24
|
61,343
75.36% of 50 DAV
50 DAV is 81,400
|
$127.89
-4.14%
|
10/8/2012
|
$118.46
|
PP = $122.67
|
|
MB = $128.80
|
Most Recent Note - 11/7/2012 4:01:04 PM
Y - Rallied near its 52-week high with above average volume behind today's 2nd consecutive gain, rising back above its pivot point after finding prompt support at its 50 DMA line. Reported earnings +23% on +18% sales for the Sep '12 quarter, below the +25% minimum earnings guideline (C criteria). The M criteria remains an overriding concern until a FTD confirms a new rally.
>>> The latest Featured Stock Update with an annotated graph appeared on 10/22/2012. Click here.
View all notes |
Alert me of new notes |
CANSLIM.net Company Profile |
SEC |
Zacks Reports |
StockTalk |
News |
Chart |
Request a new note
C
A N
S L
I M
|
N
-
NYSE
Netsuite Inc
DIVERSIFIED SERVICES - Business/Management Services
|
$60.00
|
-1.34
-2.18% |
$61.77
|
401,821
77.77% of 50 DAV
50 DAV is 516,700
|
$67.02
-10.47%
|
8/20/2012
|
$55.88
|
PP = $59.32
|
|
MB = $62.29
|
Most Recent Note - 11/6/2012 1:04:46 PM
G - Reported earnings +60% on +31% sales revenues for the Sep '12 quarter. Consolidating since a considerable 10/26/12 gap up and volume-driven gain from below its 50 DMA line for new 52-week and all-time highs. It did not form a sound new base pattern. Until the major averages are back in a confirmed rally the M criteria argues against any new buying efforts.
>>> The latest Featured Stock Update with an annotated graph appeared on 10/26/2012. Click here.
View all notes |
Alert me of new notes |
CANSLIM.net Company Profile |
SEC |
Zacks Reports |
StockTalk |
News |
Chart |
Request a new note
C
A N
S L
I M
|
OSIS
-
NASDAQ
O S I Systems Inc
ELECTRONICS - Semiconductor Equipment and Mate
|
$77.28
|
-1.28
-1.63% |
$79.35
|
74,051
64.79% of 50 DAV
50 DAV is 114,300
|
$81.23
-4.86%
|
9/5/2012
|
$74.39
|
PP = $75.10
|
|
MB = $78.86
|
Most Recent Note - 11/7/2012 1:21:13 PM
G - Pulling back from its 52-week high today with a loss on light volume. Recently found prompt support at its 50 DMA line, and it is still slightly extended from its prior base.
>>> The latest Featured Stock Update with an annotated graph appeared on 10/18/2012. Click here.
View all notes |
Alert me of new notes |
CANSLIM.net Company Profile |
SEC |
Zacks Reports |
StockTalk |
News |
Chart |
Request a new note
C
A N
S L
I M
|
RAX
-
NYSE
Rackspace Hosting Inc
INTERNET - Internet Software and; Services
|
$61.54
|
-1.41
-2.24% |
$63.61
|
2,173,541
125.76% of 50 DAV
50 DAV is 1,728,300
|
$69.81
-11.85%
|
11/6/2012
|
$65.44
|
PP = $69.91
|
|
MB = $73.41
|
Most Recent Note - 11/7/2012 1:16:41 PM
G - Color code is changed to green while slumping well below its 50 DMA line with a damaging volume-driven loss today raising concerns. Fundamentals (C and A criteria) remain strong. See the latest FSU analysis for more details and a new annotated graph. A recent streak of 10 consecutive weekly gains helped it rebound impressively from below its 200 DMA line following a deep consolidation since dropped from the Featured Stocks list on 5/14/12.
>>> The latest Featured Stock Update with an annotated graph appeared on 11/6/2012. Click here.
View all notes |
Alert me of new notes |
CANSLIM.net Company Profile |
SEC |
Zacks Reports |
StockTalk |
News |
Chart |
Request a new note
C
A N
S L
I M
|
Symbol/Exchange
Company Name
Industry Group |
PRICE |
CHANGE
(%Change) |
Day High |
Volume
(% DAV)
(% 50 day avg vol) |
52 Wk Hi
% From Hi |
Featured
Date |
Price
Featured |
Pivot Featured |
|
Max Buy |
RNF
-
NYSE
Rentech Nitrogen Ptnr Lp
CHEMICALS - Agricultural Chemicals
|
$38.39
|
+0.24
0.63% |
$39.80
|
274,914
71.59% of 50 DAV
50 DAV is 384,000
|
$41.15
-6.71%
|
11/1/2012
|
$39.11
|
PP = $40.15
|
|
MB = $42.16
|
Most Recent Note - 11/7/2012 3:45:24 PM
Y - Pulling back today with higher volume, enduring distributional pressure amid a negative market (M criteria). After hitting a new 52-week high on 11/02/12 a "negative reversal" for a loss with above average volume broke a streak of 5 consecutive gains.
>>> The latest Featured Stock Update with an annotated graph appeared on 11/2/2012. Click here.
View all notes |
Alert me of new notes |
CANSLIM.net Company Profile |
SEC |
Zacks Reports |
StockTalk |
News |
Chart |
Request a new note
C
A N
S L
I M
|
TDG
-
NYSE
Transdigm Group Inc
AEROSPACE/DEFENSE - Aerospace/Defense Products and; Services
|
$137.15
|
-0.85
-0.62% |
$138.68
|
305,211
60.33% of 50 DAV
50 DAV is 505,900
|
$140.49
-2.38%
|
8/16/2012
|
$132.23
|
PP = $136.44
|
|
MB = $143.26
|
Most Recent Note - 11/6/2012 4:28:00 PM
G - Hit a new high (following a 10/23/12 special dividend) with today's gain on light volume. When noted on 10/23/12 it undercut its 50 DMA line, yet it promptly rebounded back above that important short-term average.
>>> The latest Featured Stock Update with an annotated graph appeared on 10/23/2012. Click here.
View all notes |
Alert me of new notes |
CANSLIM.net Company Profile |
SEC |
Zacks Reports |
StockTalk |
News |
Chart |
Request a new note
C
A N
S L
I M
|
ULTA
-
NASDAQ
Ulta Salon Cosm & Frag
SPECIALTY RETAIL - Specialty Retail, Other
|
$90.99
|
-2.06
-2.21% |
$93.57
|
758,798
105.77% of 50 DAV
50 DAV is 717,400
|
$103.52
-12.10%
|
9/4/2012
|
$93.17
|
PP = $98.52
|
|
MB = $103.45
|
Most Recent Note - 11/8/2012 5:34:30 PM
Loss today with slightly above average volume has it testing support at its 200 DMA line, a likely support level. It faces resistance due to overhead supply up through the $100-103 range. Based on weak action it will be dropped from the Featured Stocks list tonight.
>>> The latest Featured Stock Update with an annotated graph appeared on 11/5/2012. Click here.
View all notes |
Alert me of new notes |
CANSLIM.net Company Profile |
SEC |
Zacks Reports |
StockTalk |
News |
Chart |
Request a new note
C
A N
S L
I M
|
VSI
-
NYSE
Vitamin Shoppe Inc
SPECIALTY RETAIL - Specialty Retail, Other
|
$57.94
|
-2.17
-3.61% |
$60.13
|
373,096
130.77% of 50 DAV
50 DAV is 285,300
|
$61.89
-6.38%
|
10/15/2012
|
$57.82
|
PP = $60.08
|
|
MB = $63.08
|
Most Recent Note - 11/8/2012 5:28:24 PM
Y - Pulled back again today and its volume-driven loss led to a close back in its prior base, completely negating its 11/06/12 breakout. It released better than expected earnings +35% on +14% sales revenues for the Sep '12 quarter. Keep in mind the M criteria which argues against new buying efforts until the market is back in a confirmed rally.
>>> The latest Featured Stock Update with an annotated graph appeared on 10/15/2012. Click here.
View all notes |
Alert me of new notes |
CANSLIM.net Company Profile |
SEC |
Zacks Reports |
StockTalk |
News |
Chart |
Request a new note
C
A N
S L
I M
|
WPI
-
NYSE
Watson Pharmaceuticals
DRUGS - Drugs - Generic
|
$85.72
|
-1.27
-1.46% |
$87.31
|
679,528
77.50% of 50 DAV
50 DAV is 876,800
|
$90.00
-4.76%
|
8/24/2012
|
$82.90
|
PP = $81.10
|
|
MB = $85.16
|
Most Recent Note - 11/7/2012 3:55:28 PM
G - Consolidating just -2.9% off its 52-week high today after recently finding support at its 50 DMA line. Reported earnings +24% on +19% sales revenues for the Sep '12 quarter, a notch below the +25% minimum guideline (C criteria). It has not formed a sound base and it is extended from a proper buy point under the fact-based system's guidelines.
>>> The latest Featured Stock Update with an annotated graph appeared on 11/1/2012. Click here.
View all notes |
Alert me of new notes |
CANSLIM.net Company Profile |
SEC |
Zacks Reports |
StockTalk |
News |
Chart |
Request a new note
C
A N
S L
I M
|
Symbol/Exchange
Company Name
Industry Group |
PRICE |
CHANGE
(%Change) |
Day High |
Volume
(% DAV)
(% 50 day avg vol) |
52 Wk Hi
% From Hi |
Featured
Date |
Price
Featured |
Pivot Featured |
|
Max Buy |
|
|
|
THESE ARE NOT BUY RECOMMENDATIONS!
Comments contained in the body of this report are technical
opinions only. The material herein has been obtained
from sources believed to be reliable and accurate, however,
its accuracy and completeness cannot be guaranteed.
This site is not an investment advisor, hence it does
not endorse or recommend any securities or other investments.
Any recommendation contained in this report may not
be suitable for all investors and it is not to be deemed
an offer or solicitation on our part with respect to
the purchase or sale of any securities. All trademarks,
service marks and trade names appearing in this report
are the property of their respective owners, and are
likewise used for identification purposes only.
This report is a service available
only to active Paid Premium Members.
You may opt-out of receiving report notifications
at any time. Questions or comments may be submitted
by writing to Premium Membership Services 665 S.E. 10 Street, Suite 201 Deerfield Beach, FL 33441-5634 or by calling 1-800-965-8307
or 954-785-1121.
|
|
|

